Getting Started with Visual Notebooks
Visual Notebooks is a collaborative, end-to-end analytics platform that enables business analysts, data engineers, and data scientists to use the power of advanced analytics and data science to improve decision making, share meaningful insights, and deliver improved business outcomes.
Follow along with this quick start tutorial to see how Visual Notebooks can solve real business problems.
Predictive Maintenance Tutorial
Businesses need to avoid costly unplanned downtime of equipment. In this quick start tutorial you will solve a use case to predict equipment failure from turbines before those failures occur!
During the tutorial you will be exposed to the fundamentals of Visual Notebooks by working through a simple example around Predictive Maintenance. The tutorial covers:
- Starting a workspace
- Connecting and uploading data
- Preparing data
- Training machine learning models
Creating a Visual Notebook
Let's get started! After logging in you are immediately taken to the Visual Notebooks homepage. From the homepage, you can browse and create visual notebooks, models, datasets, and dashboards. You can deploy insights and visual notebooks, view your statistics, and access learning materials including prebuilt templates to help you build your projects. Administrators can manage their teams and permissions.
Note: Before you can create a visual notebook, you must first start your workspace. Your Visual Notebooks workspace is a dedicated cloud resource for your analytics. It is:
- Ephemeral: turn on the workspace when you are doing analytics, then turn it off when you are not to save costs
- Scalable: choose a workspace size anywhere from 16GB to 1PB+ to perform analytics on any size dataset with a single click
- Secure: the workspace and data are only available to the specified user by default
- Performant: the workspace is entirely dedicated to your user--there is no risk of other users impacting your work
Workspace Start
To start a workspace, click the "pill" in the upper right hand corner. When a modal appears, select Start then select Activate.
Once the workspace is on, the pill turns green and shows the memory utilization.
New Visual Notebook
You can create a new visual notebook in two ways:
From the homepage: Click on Start from blank in the Get started portion.
From the visual notebooks page: Select Create new, then enter a name for your visual notebook.
Visual Notebook Editor
Creating or selecting a visual notebook takes you to the Visual Notebooks editor.
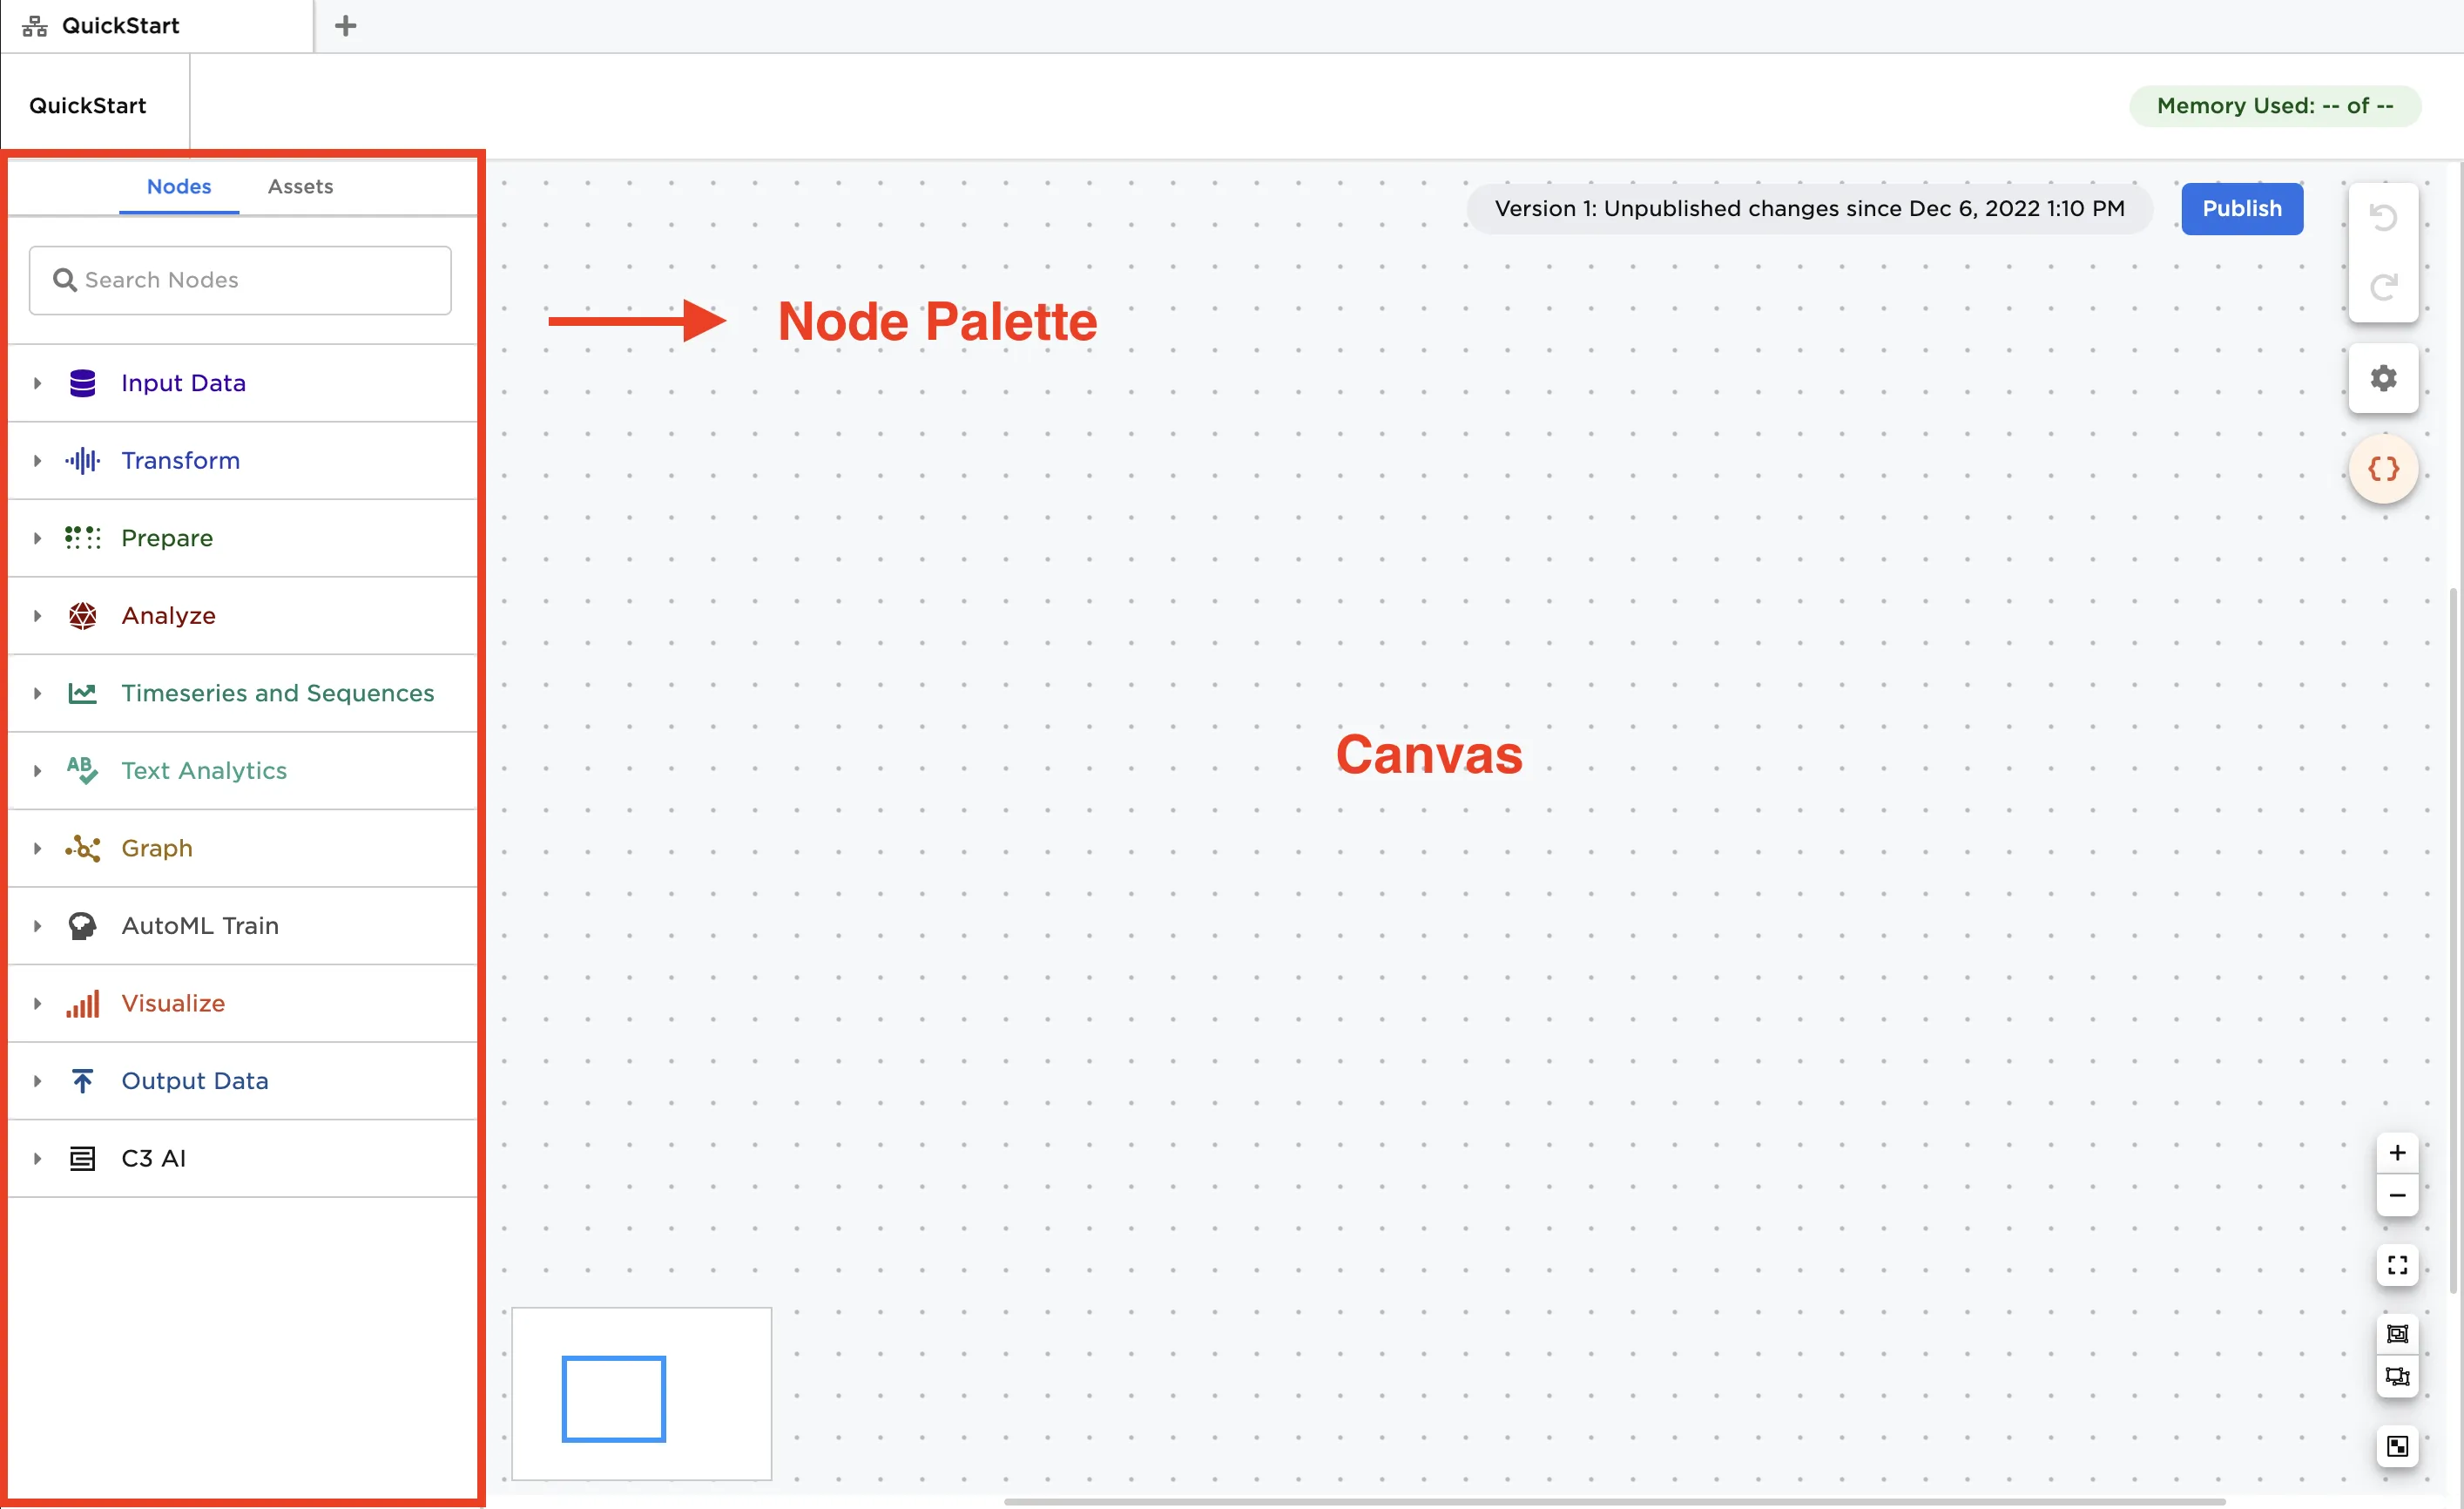
The Visual Notebooks editor contains the node palette and the canvas.
The node palette provides access to 150+ "nodes". Nodes are the building blocks of a Visual Notebooks visual notebook and can be thought of as visual representations of code.
Users combine the nodes in the canvas to create a pipeline or workflow to operate on data and generate insights.
Next Step: Load and Profile Data
Continue on to load data and solve the predictive maintenance example!