Gradient Boosted Tree Classification
Categorize data using a Gradient Boosted Machine (GBM) classification model in Visual Notebooks.
Configuration
| Field | Description |
|---|---|
| Name default=none | Name of the node |
| A user-specified node name displayed in the workspace, both on the node and in the dataframe as a tab. | |
| Select Column with Labels Required | The column the GBM classifier should predict |
| Select a column from the dropdown menu. This column contains the labels that the model should be able to predict after the training. |
Select Features
| Field | Description |
|---|---|
Select Features default=Select all columns as features, excluding the selected label column | Features to train the model with |
| Use all columns as features, or select specific columns using the dropdown menu. Columns selected as features are used to train the model. | |
Select optional timeseries column default=Off | Timeseries column |
| If there is a timeseries column in your data, check the box in this field and select the timeseries column from the dropdown menu. Timeseries information is used when splitting the data into separate train, validation, and test datasets. |
Test and Validation Settings
When training models, data is split into multiple components. The bulk of the data is used for training and validation, while a small portion is set aside for testing. The fields in this section determine what percentage of the data is used for training, how the data is used during the training process, and the strategy used to split the data.
| Field | Description |
|---|---|
Select test and validation method default=Train-validation-split | Test and train method |
| Select Train-validation-split to split the dataset into separate train, validation, and test datasets. Select Cross-validation to split the data into a specified number of subsets. During training, one subgroup is used for testing and validation, while the other subgroups are used for training. The process is then repeated so each subgroup is used as the testing and validation group once. | |
Select percentage split default=Train: 70%, Validation: 15%, Test: 15% | Data split percentage |
| Move the slider to split the data into test, validation, and train datasets. If Cross-validation is selected in the Select test and validation method field, move the slider to split the data into a train dataset that will be divided into subgroups, and a separate testing dataset. The default split when using the cross-validation method is 80% train and 20% test. | |
Select number of cross-validation folds default=6 | Number of cross-validation subgroups |
| Enter a number between 2 and 20. The data allocated for training is divided into the specified number of subgroups. | |
Select sampling method default=Stratified | Data splitting strategy |
| Select Stratified to ensure that each dataset and subgroup contains the same percentage of each label as the entire dataset. Select Random to randomly split the data into the percentages specified above. Note that selecting Random may result in test data that doesn't accurately represent the entire dataset. |
Imbalanced Data Strategy
Classification models expect data to be somewhat balanced. If one label in your dataset is severely underrepresented, models might ignore that label during training and always predict a more prevalent label. Since the minority label represents such a small portion of the data, models can use this strategy without generating a significant amount of false predictions. To prevent this behavior, Visual Notebooks balances the data by oversampling the minority label so all labels are evenly represented.
| Field | Description |
|---|---|
Rebalance strategy default=No imbalance class normalization | Rebalance options |
| Select Auto rebalance to automatically balance the data so all labels are evenly represented. Leave No imbalance class normalization selected to leave the input data unchanged. |
Prediction
The output of this node is the model's predictions on the training data. This section determines how the predictions are portrayed in the resulting dataframe.
| Field | Description |
|---|---|
| modelId default=model name | Selected model's name |
| This auto-populated field displays the selected model's name. | |
Prediction Column Name default=prediction | The column name for the model's predictions |
| Enter a name for the column that contains the selected model's predictions. Column names can contain alphanumeric characters and underscores, but cannot contain spaces. | |
Add column with probabilistic output scores default=On | Model prediction probabilities |
| Leave this switch on to create a column with the model's confidence in each prediction. Toggle this switch off to create a dataframe without this column. | |
Dataset Selection default=Train Dataset | Data used to display a model's predictions |
| Select all data, train dataset, validation dataset, or test dataset. Visual Notebooks displays a selected model's predictions on the dataset selected with this field. |
Node Inputs/Outputs
| Input | A Visual Notebooks dataframe |
|---|---|
| Output | A dataframe with predictions on the training data |
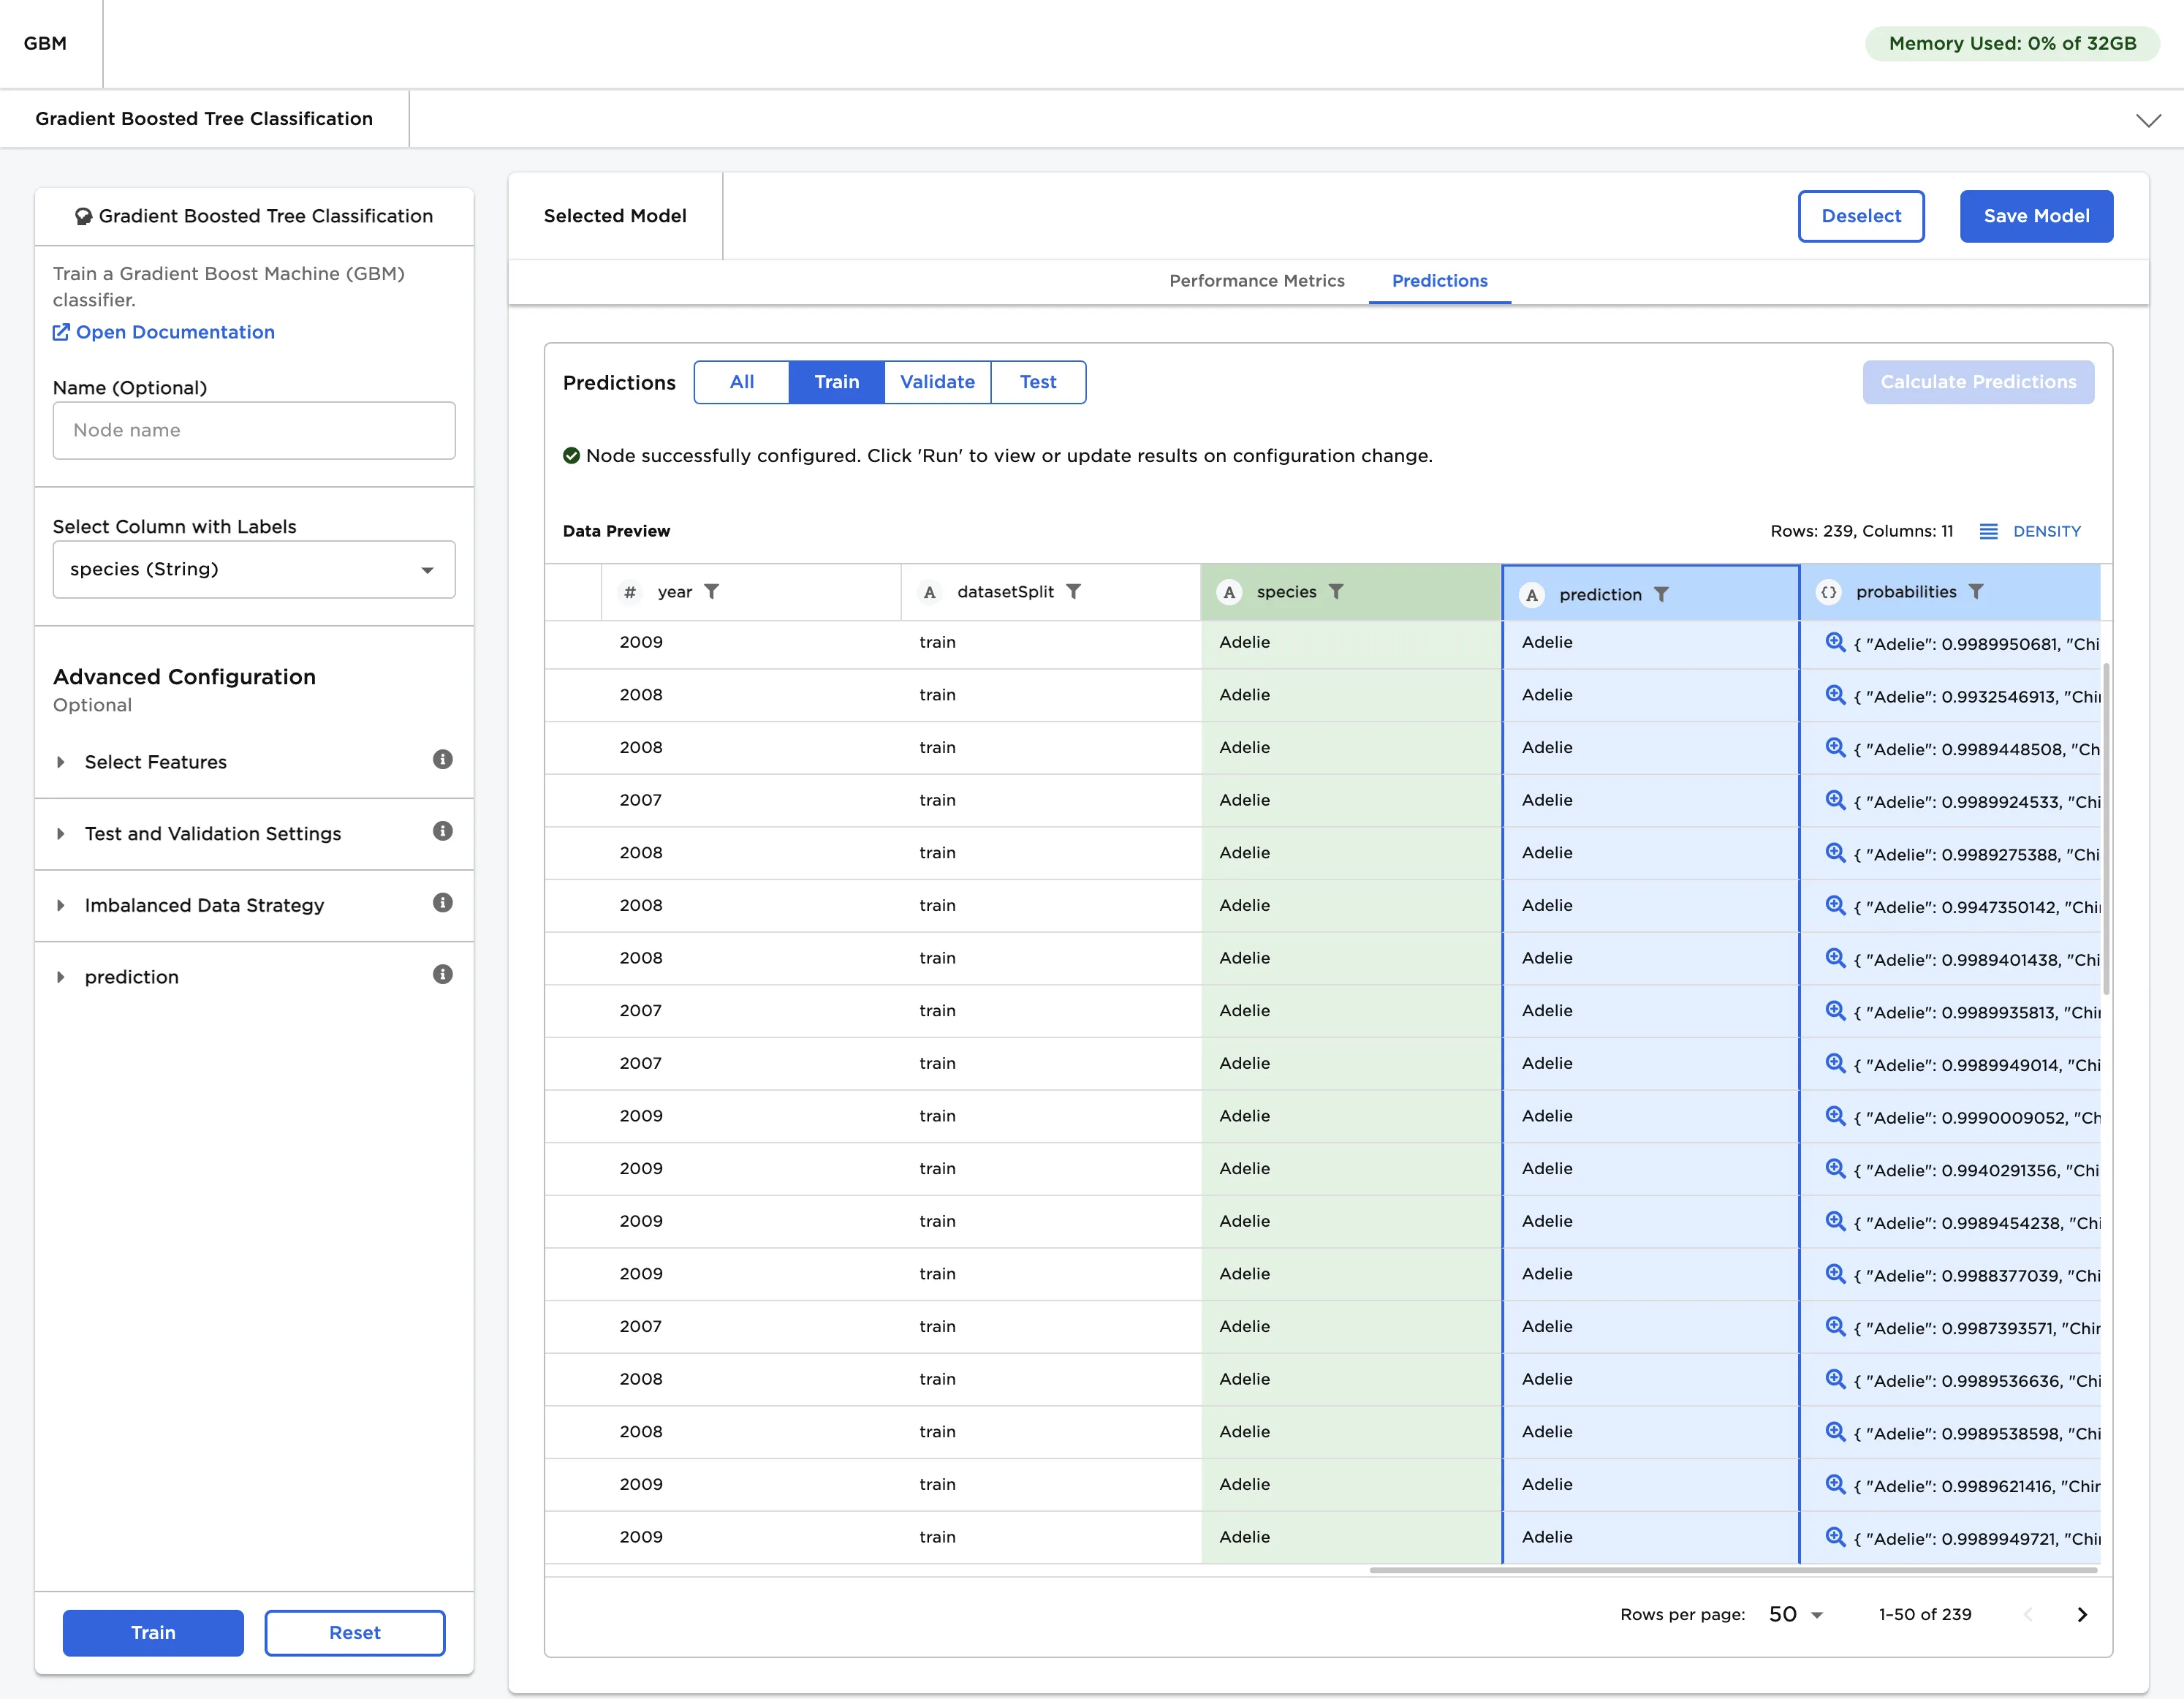
Figure 1: Example output
Examples
The dataframe shown in Figure 2 is used in this example. It contains identifying characteristics of three species of penguin. This data is used to train a model that can identify the species of penguin based on the given data.
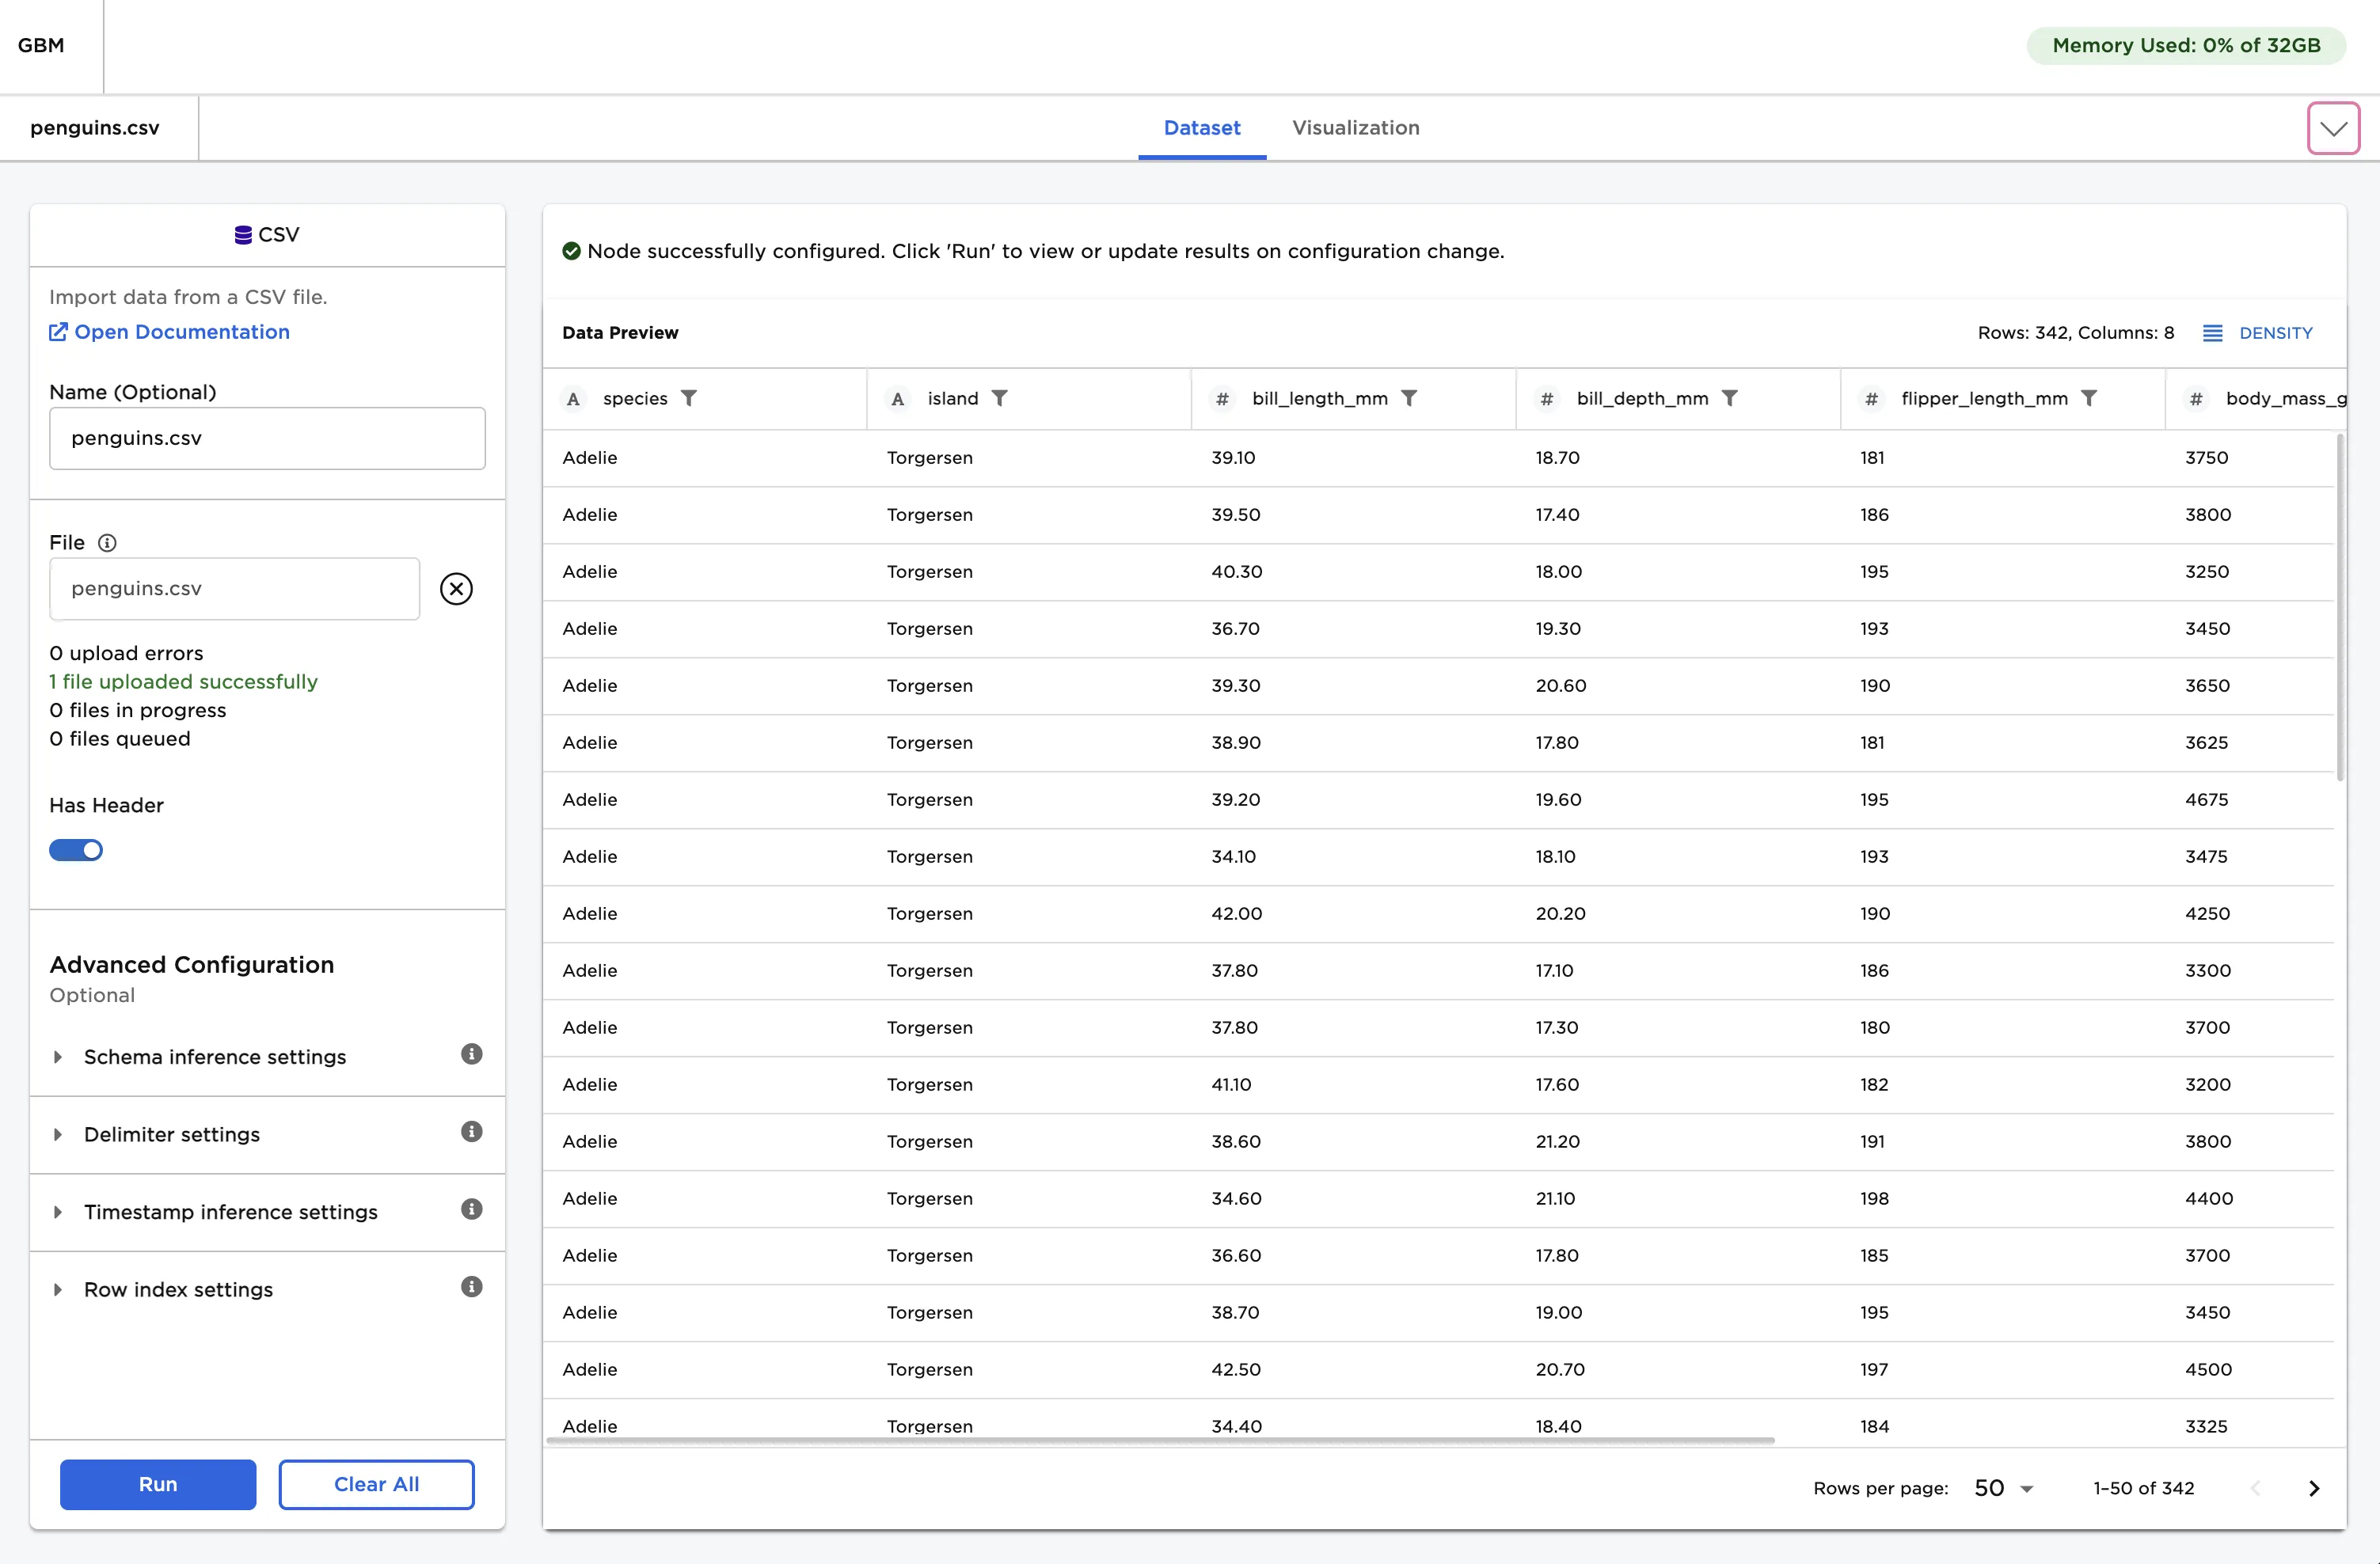
Figure 2: Example input data
- Connect an Gradient Boosted Tree Classification node to an existing node.
- Select species (String) for the Select Column with Labels field. The model should be able to predict the values in this column after training.
- Select Train to train a model with the default settings.
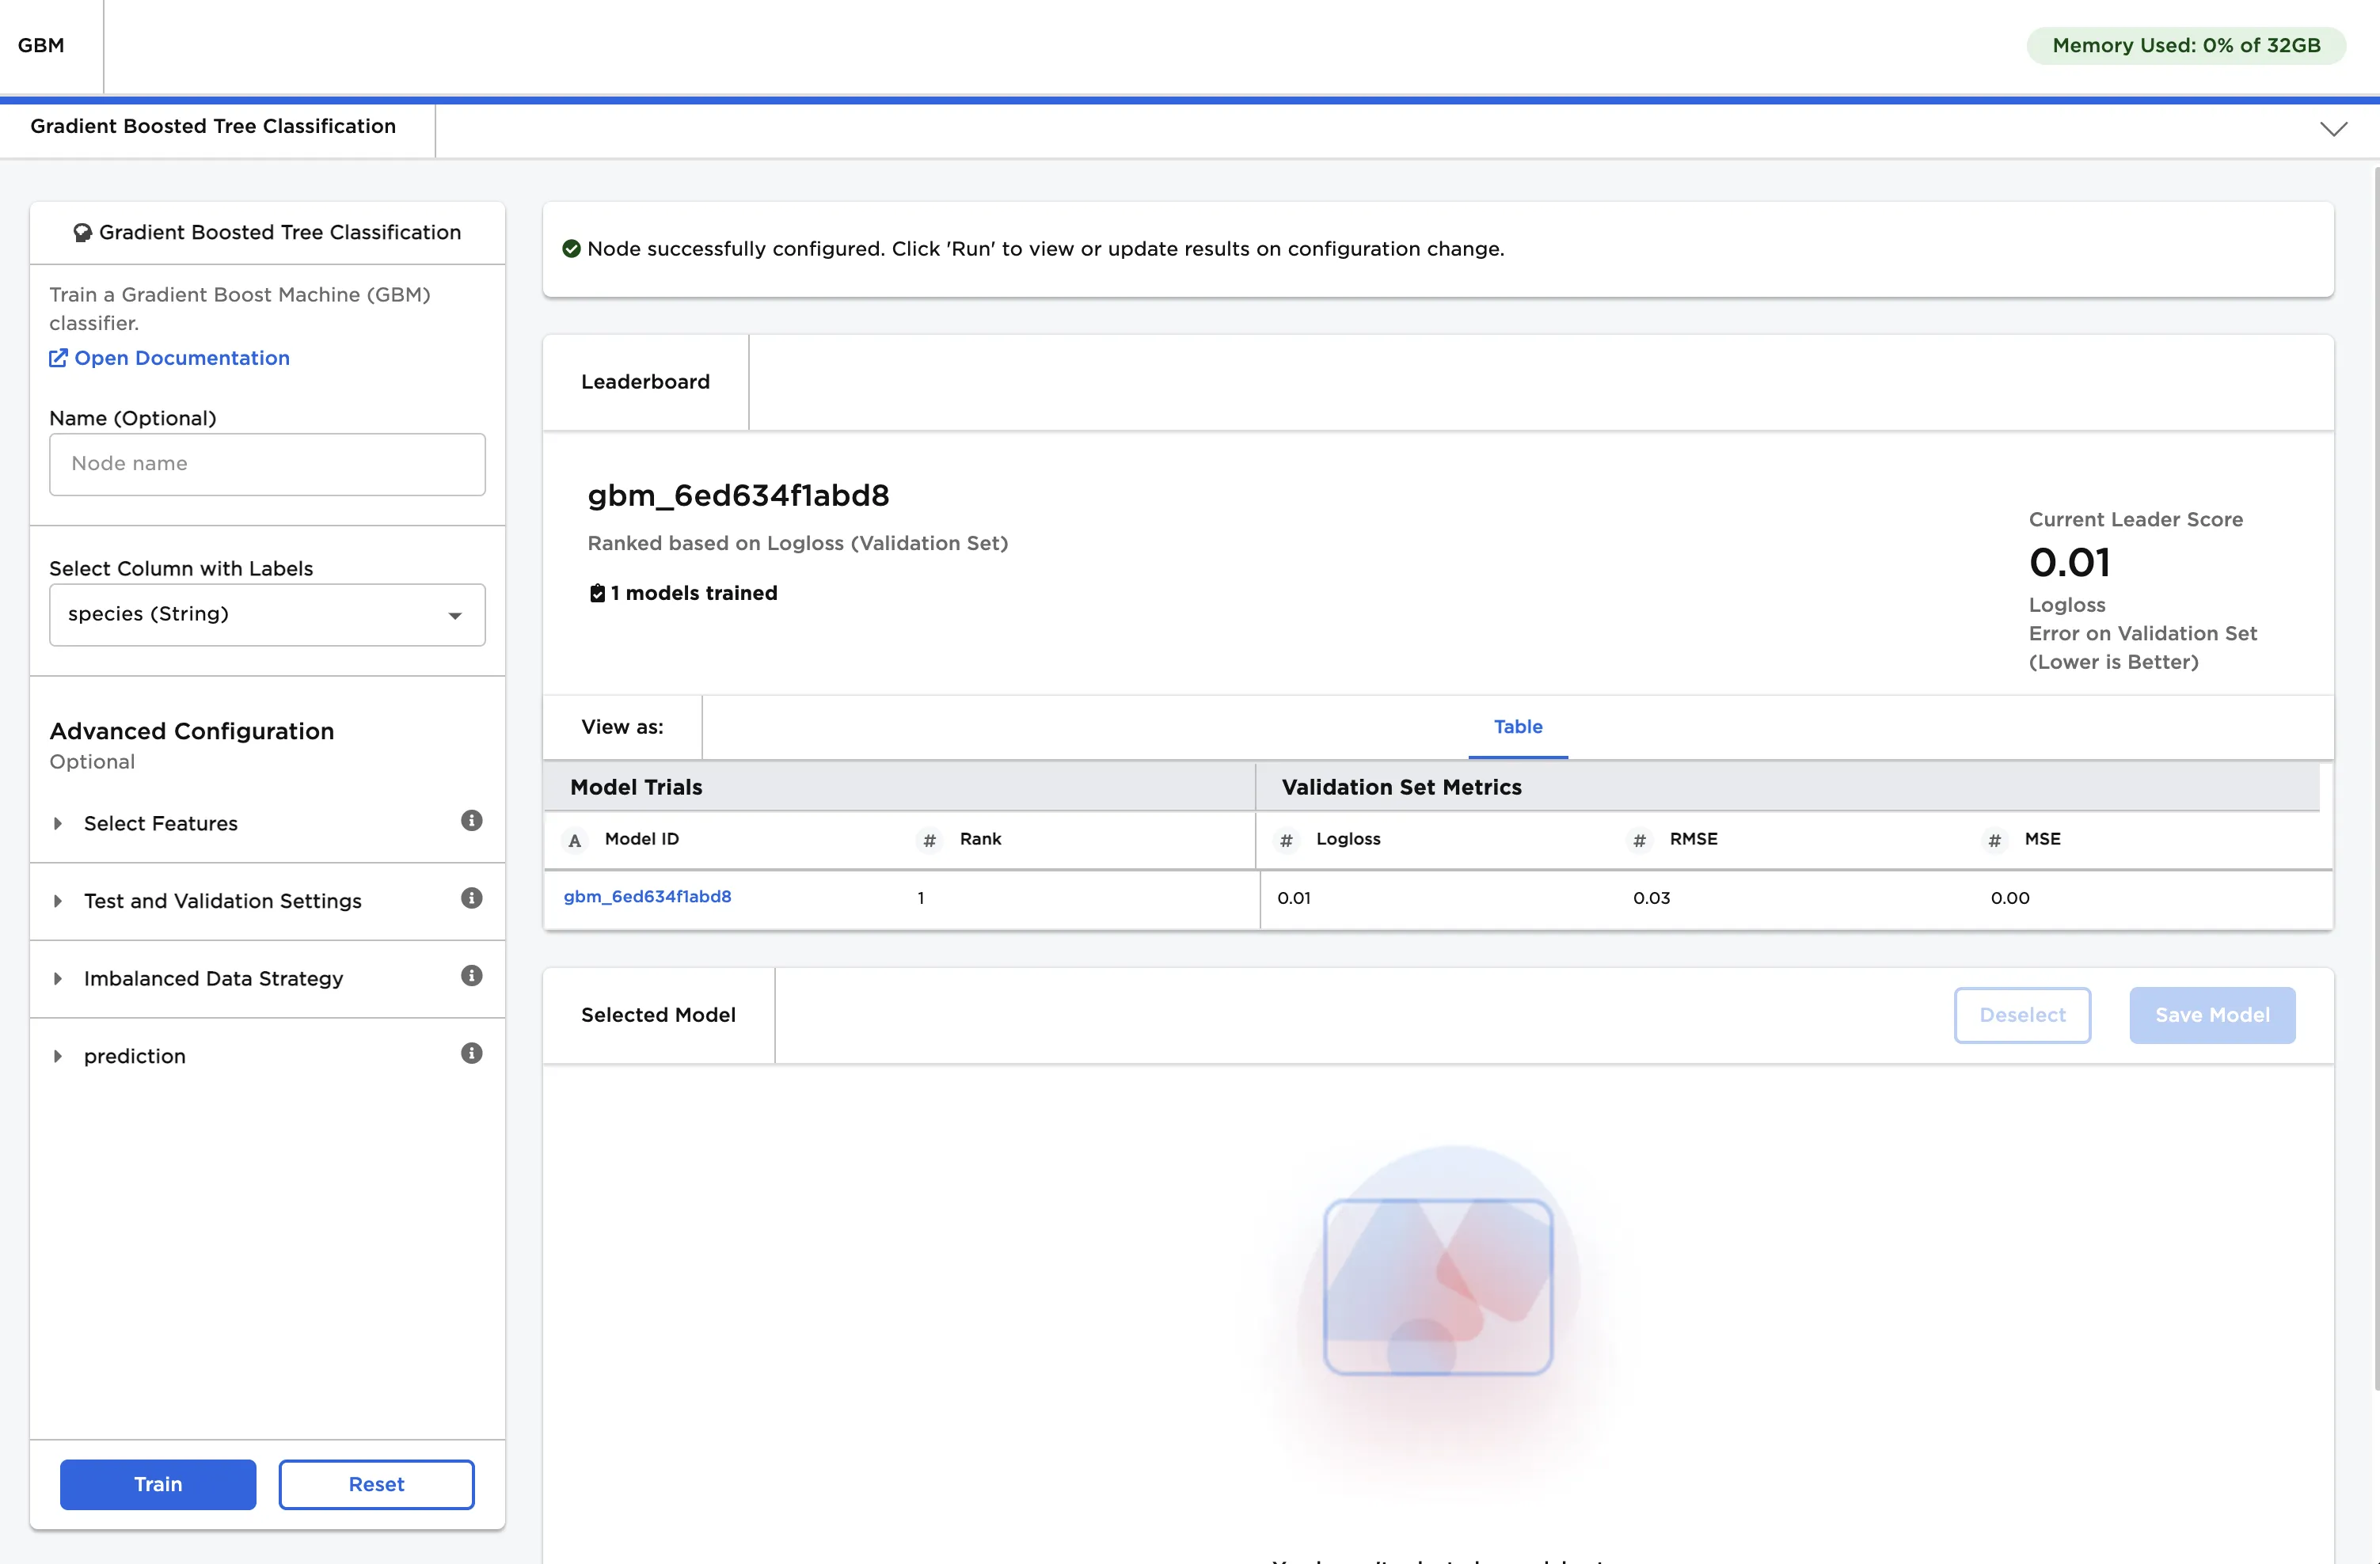
Figure 3: Trained model
- Select the trained model, then scroll down to view information about the model and a bar chart with the importance of each feature.
- Select Calculate Additional Details to view additional test metrics and a confusion matrix. The button appears dimmed after it has been selected. For more information about test metrics, see the Visual Notebooks User Guide.
The model shown in Figure 4 determined that bill length is the most important characteristic when categorizing penguins by species.
The confusion matrix shows that the model correctly identifies all Chinstrap and Gentoo penguins in the data, but only correctly identifies 91.7% of the Adelie penguins. It mistakenly categorizes 4.2% of Adelie penguins as Chinstrap penguins, and misclassifies another 4.2% of Adelie penguins as Gentoo penguins. A confusion matrix with a diagonal row of "100%" values from the top left to the bottom right indicates a perfect model.
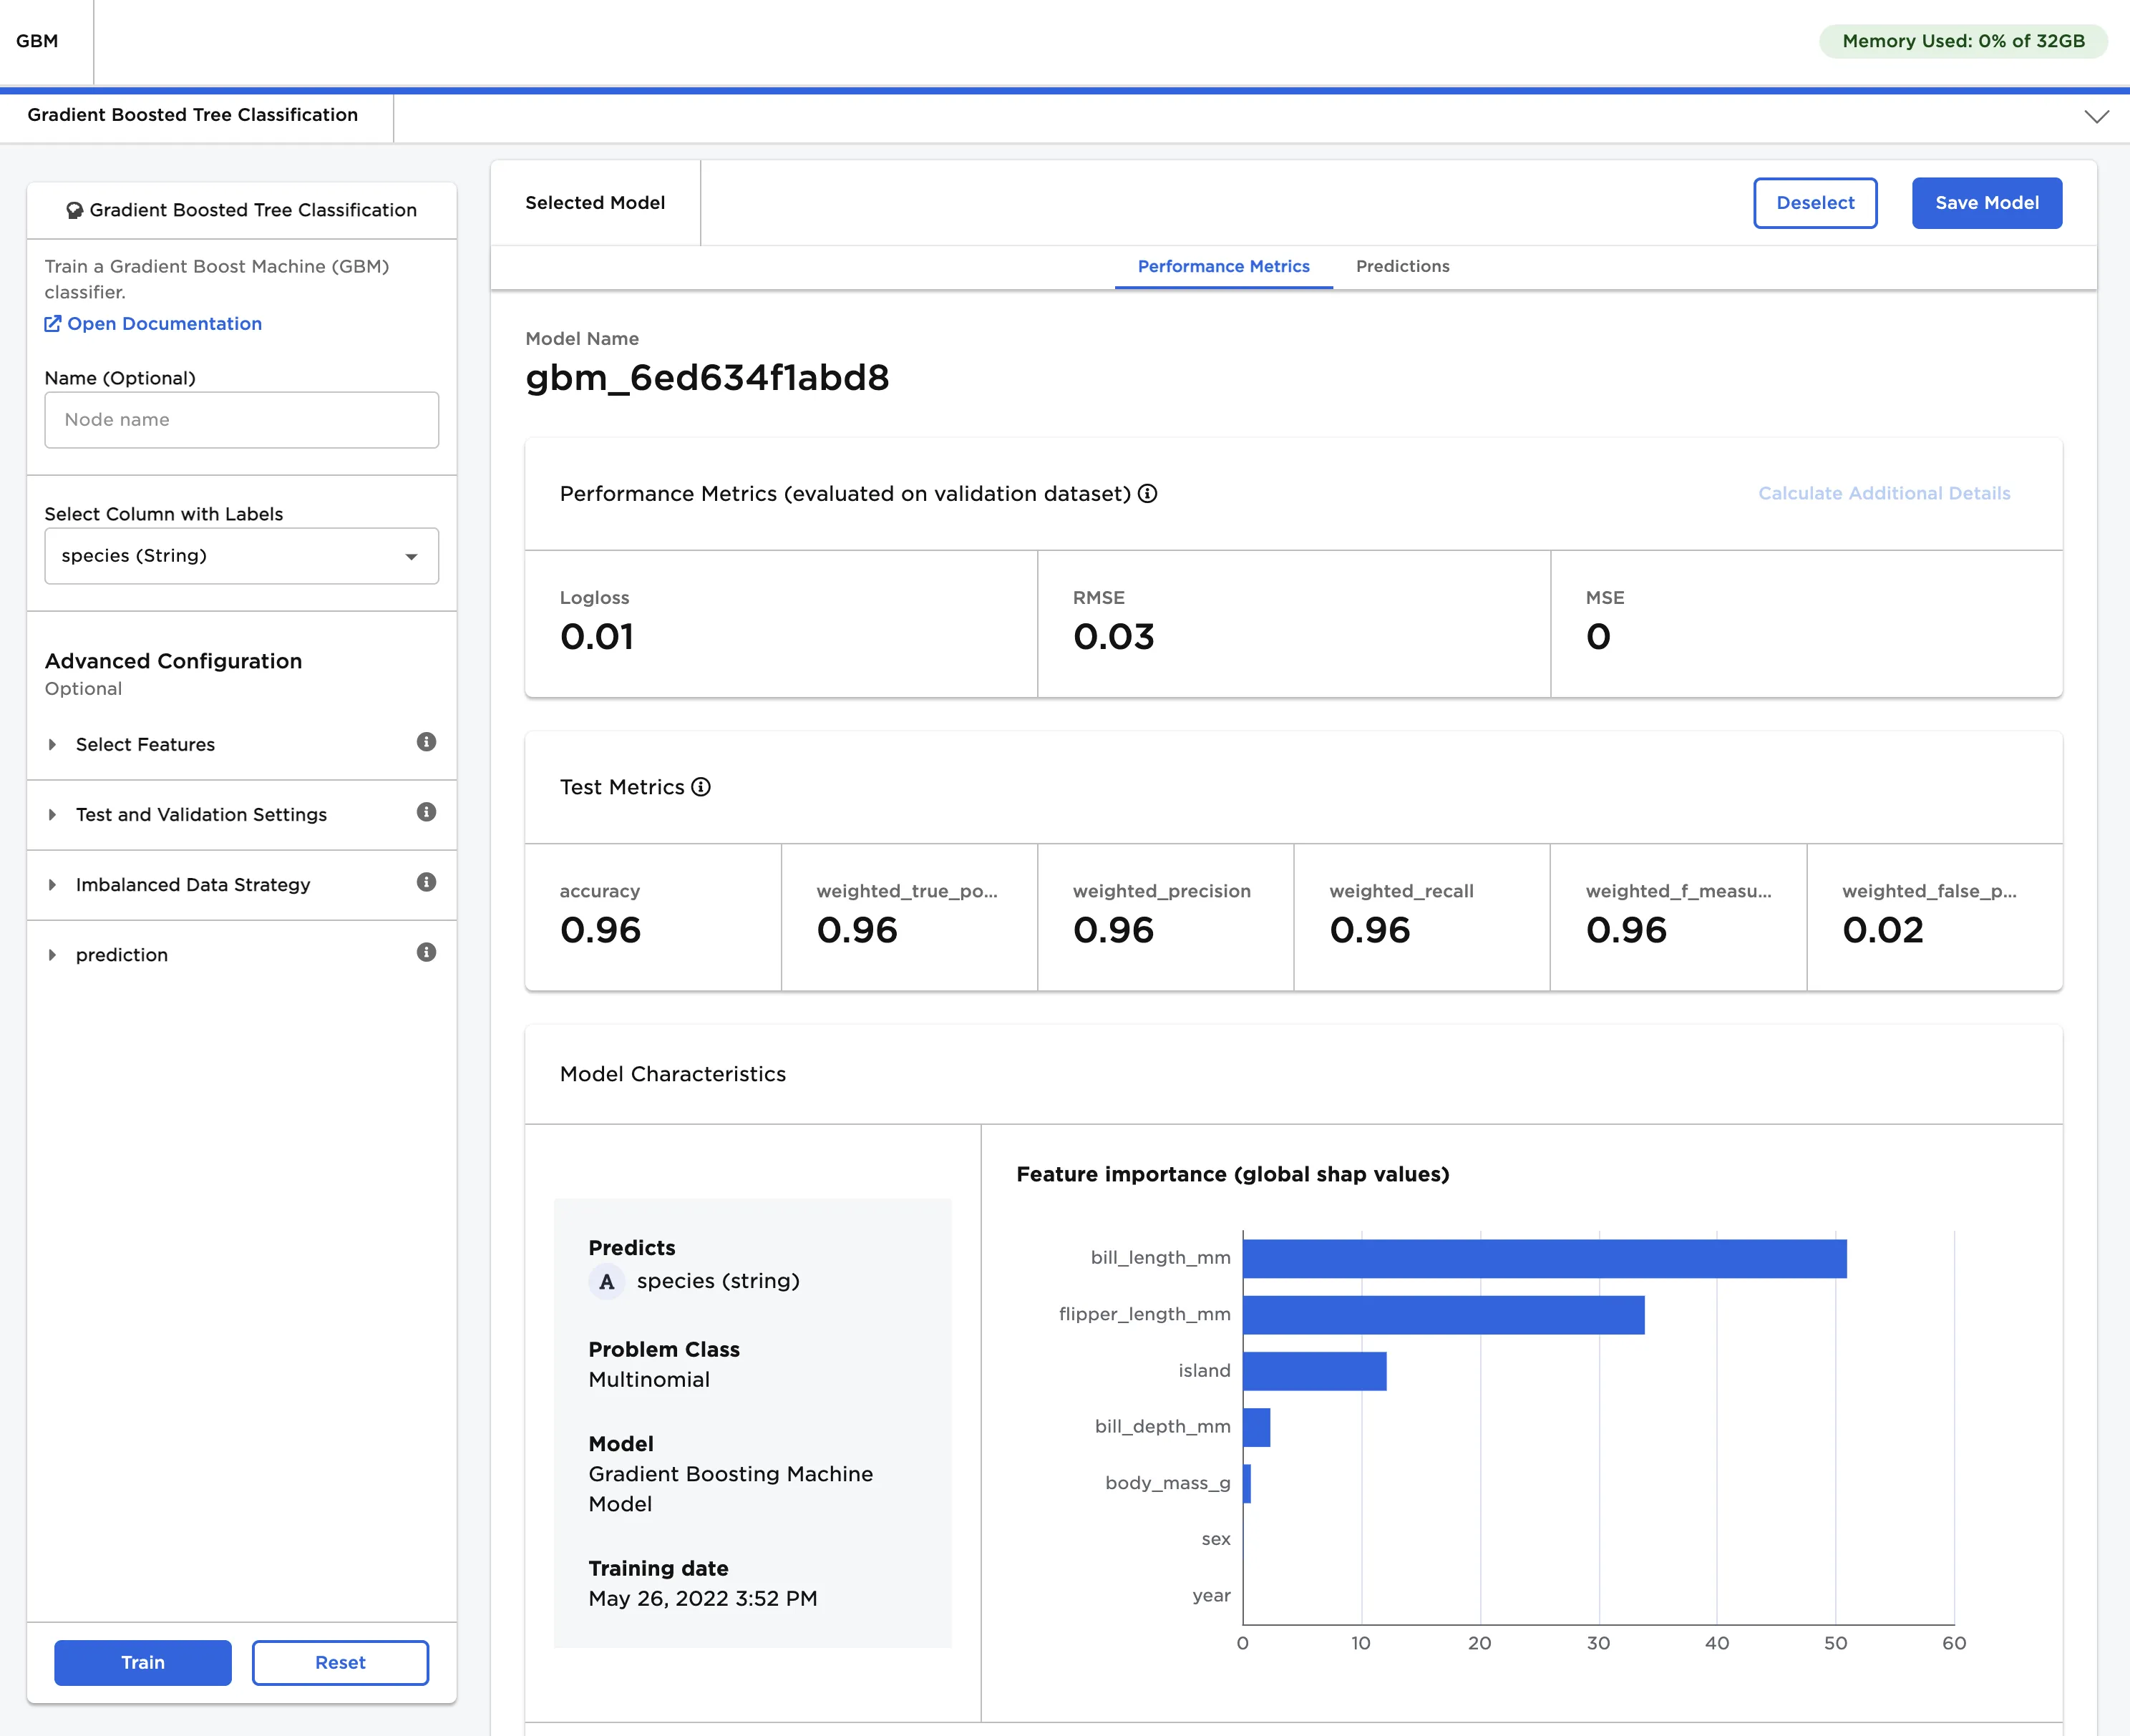
Figure 4: Model details
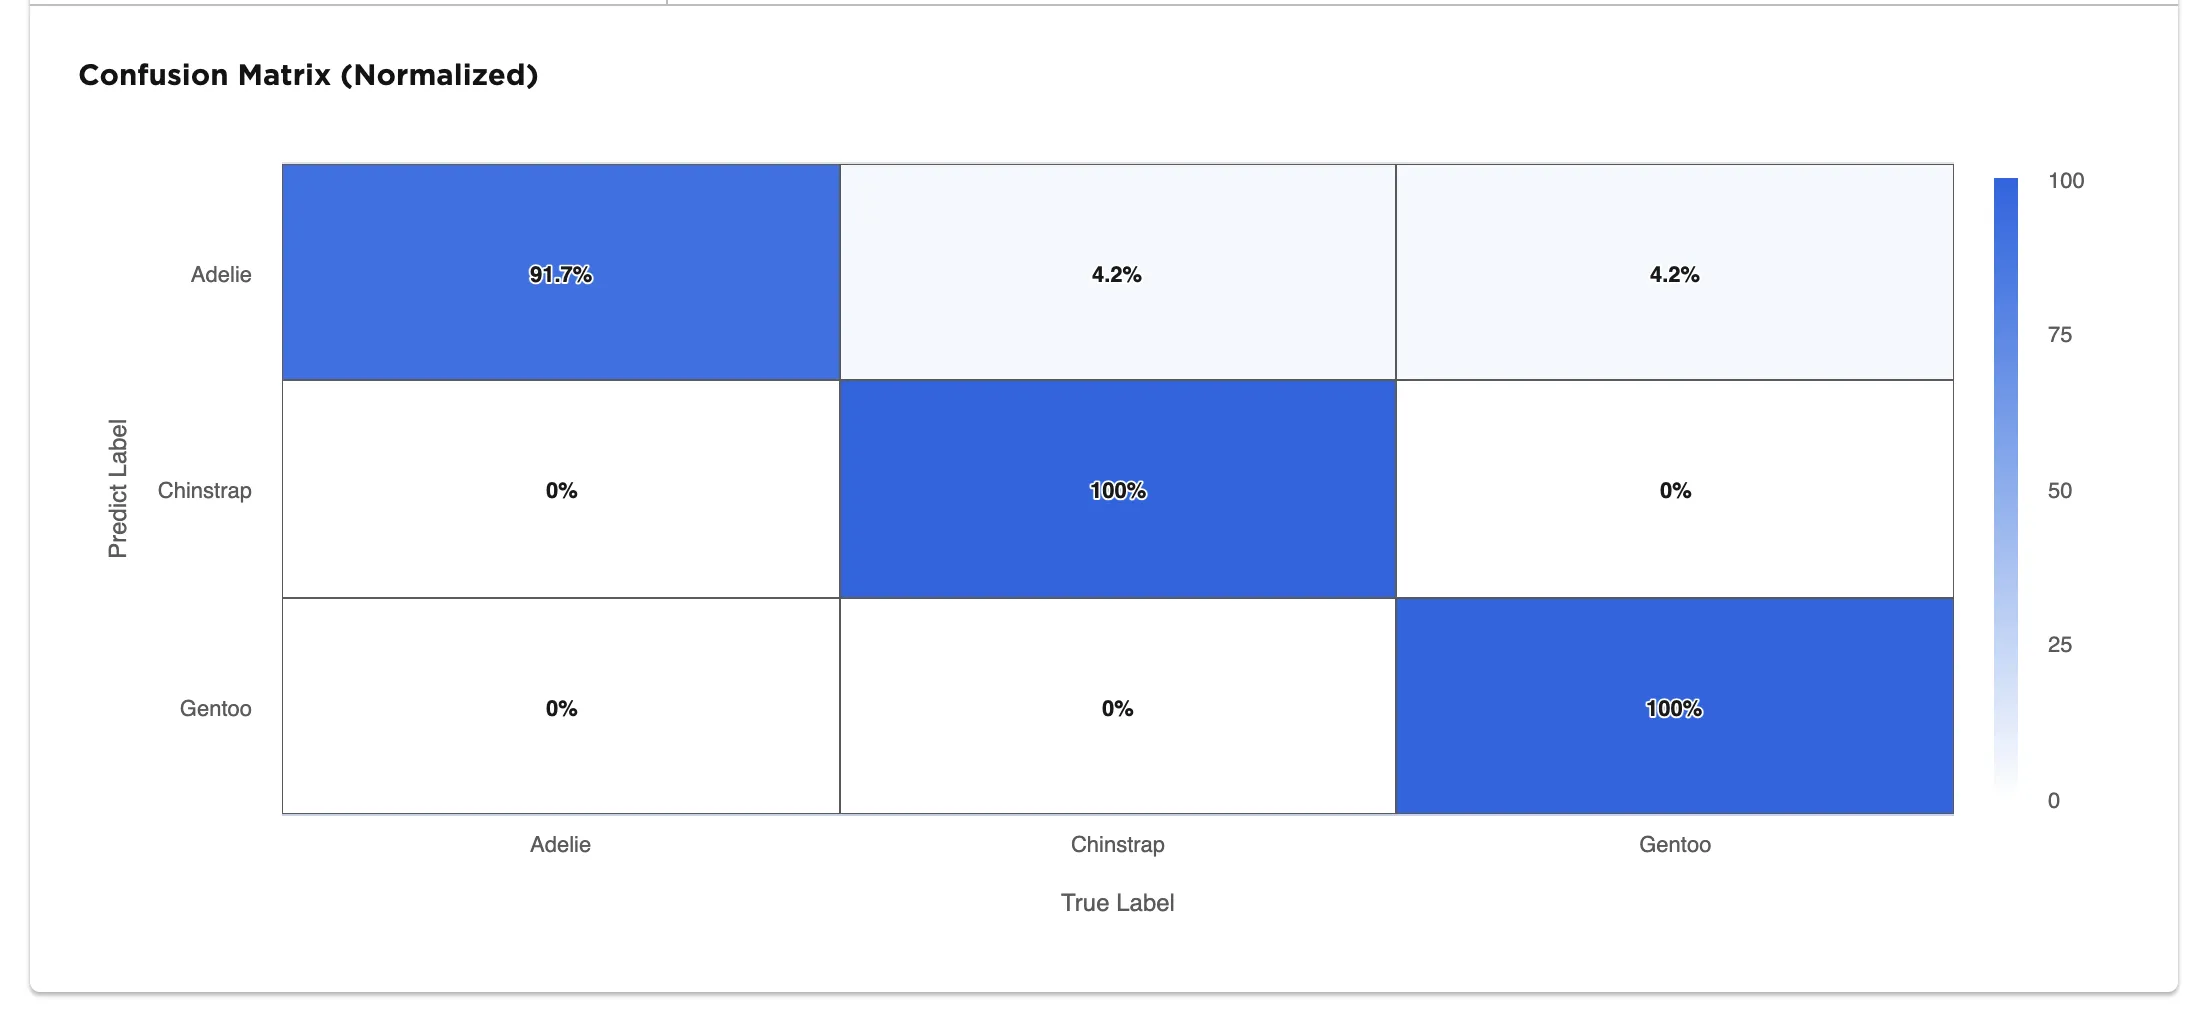
Figure 5: Confusion matrix
- Navigate to the Predictions tab.
- Select Calculate Predictions to view the model's predictions on the training data. The button appears dimmed after it has been selected.
Note that if your model correctly predicts all values, it might be overfit. In other words, the model may be too closely aligned to the training data that it is incapable of making accurate predictions on unseen data. Try using a different AutoML node.
Figure 6: The model's predictions