Geospatial
Use the Geospatial node in Visual Notebooks to create a location map for latitude and longitude coordinates in your dataset.
Data Configuration
| Field | Description |
|---|---|
| Latitude default=none | Latitude column Select a latitude column from the dataset. |
| Longitude default=none | Longitude column Select a longitude column from the dataset. |
| Marker Color Based On default=none | Column for marker color The marker color is a gradient by values in a column. Select a column for the application of the gradient. |
| Label Content default=none | Marker label content Select columns to include in marker labels. |
| Group by default=none | Select grouping An optional grouping of the data. |
| Sources default=none | Source selection Select columns to include or remove from the chart. The field is populated with the labels from the Group by column when a group by column is selected. |
Limit default=100 | Limit selection An option to limit the data included in the location map by the first data that appears in the dataset. |
Settings
| Field | Description |
|---|---|
| Chart Title default=none | Field to name the chart An optional user-specified chart title. |
| X-Axis Title default=none | Title for the x-axis Select a title for the x-axis. This option appears if a Group By selection is made in Data Configuration. |
| Y-Axis Title default=none | Title for the y-axis Select a title for the y-axis. This option appears if a Group By selection is made in Data Configuration. |
| Secondary Y-Axis Title default=none | Secondary title for the y-axis Select a secondary title (subtitle) for the y-axis. This option appears if a Group By selection is made in Data Configuration. |
Show Markers default=off | Option to show/hide markers Toggle on to show the markers, or leave off (default) to hide the markers. |
Node Inputs/Outputs
| Input | A Visual Notebooks dataframe |
|---|---|
| Output | A geospatial map |
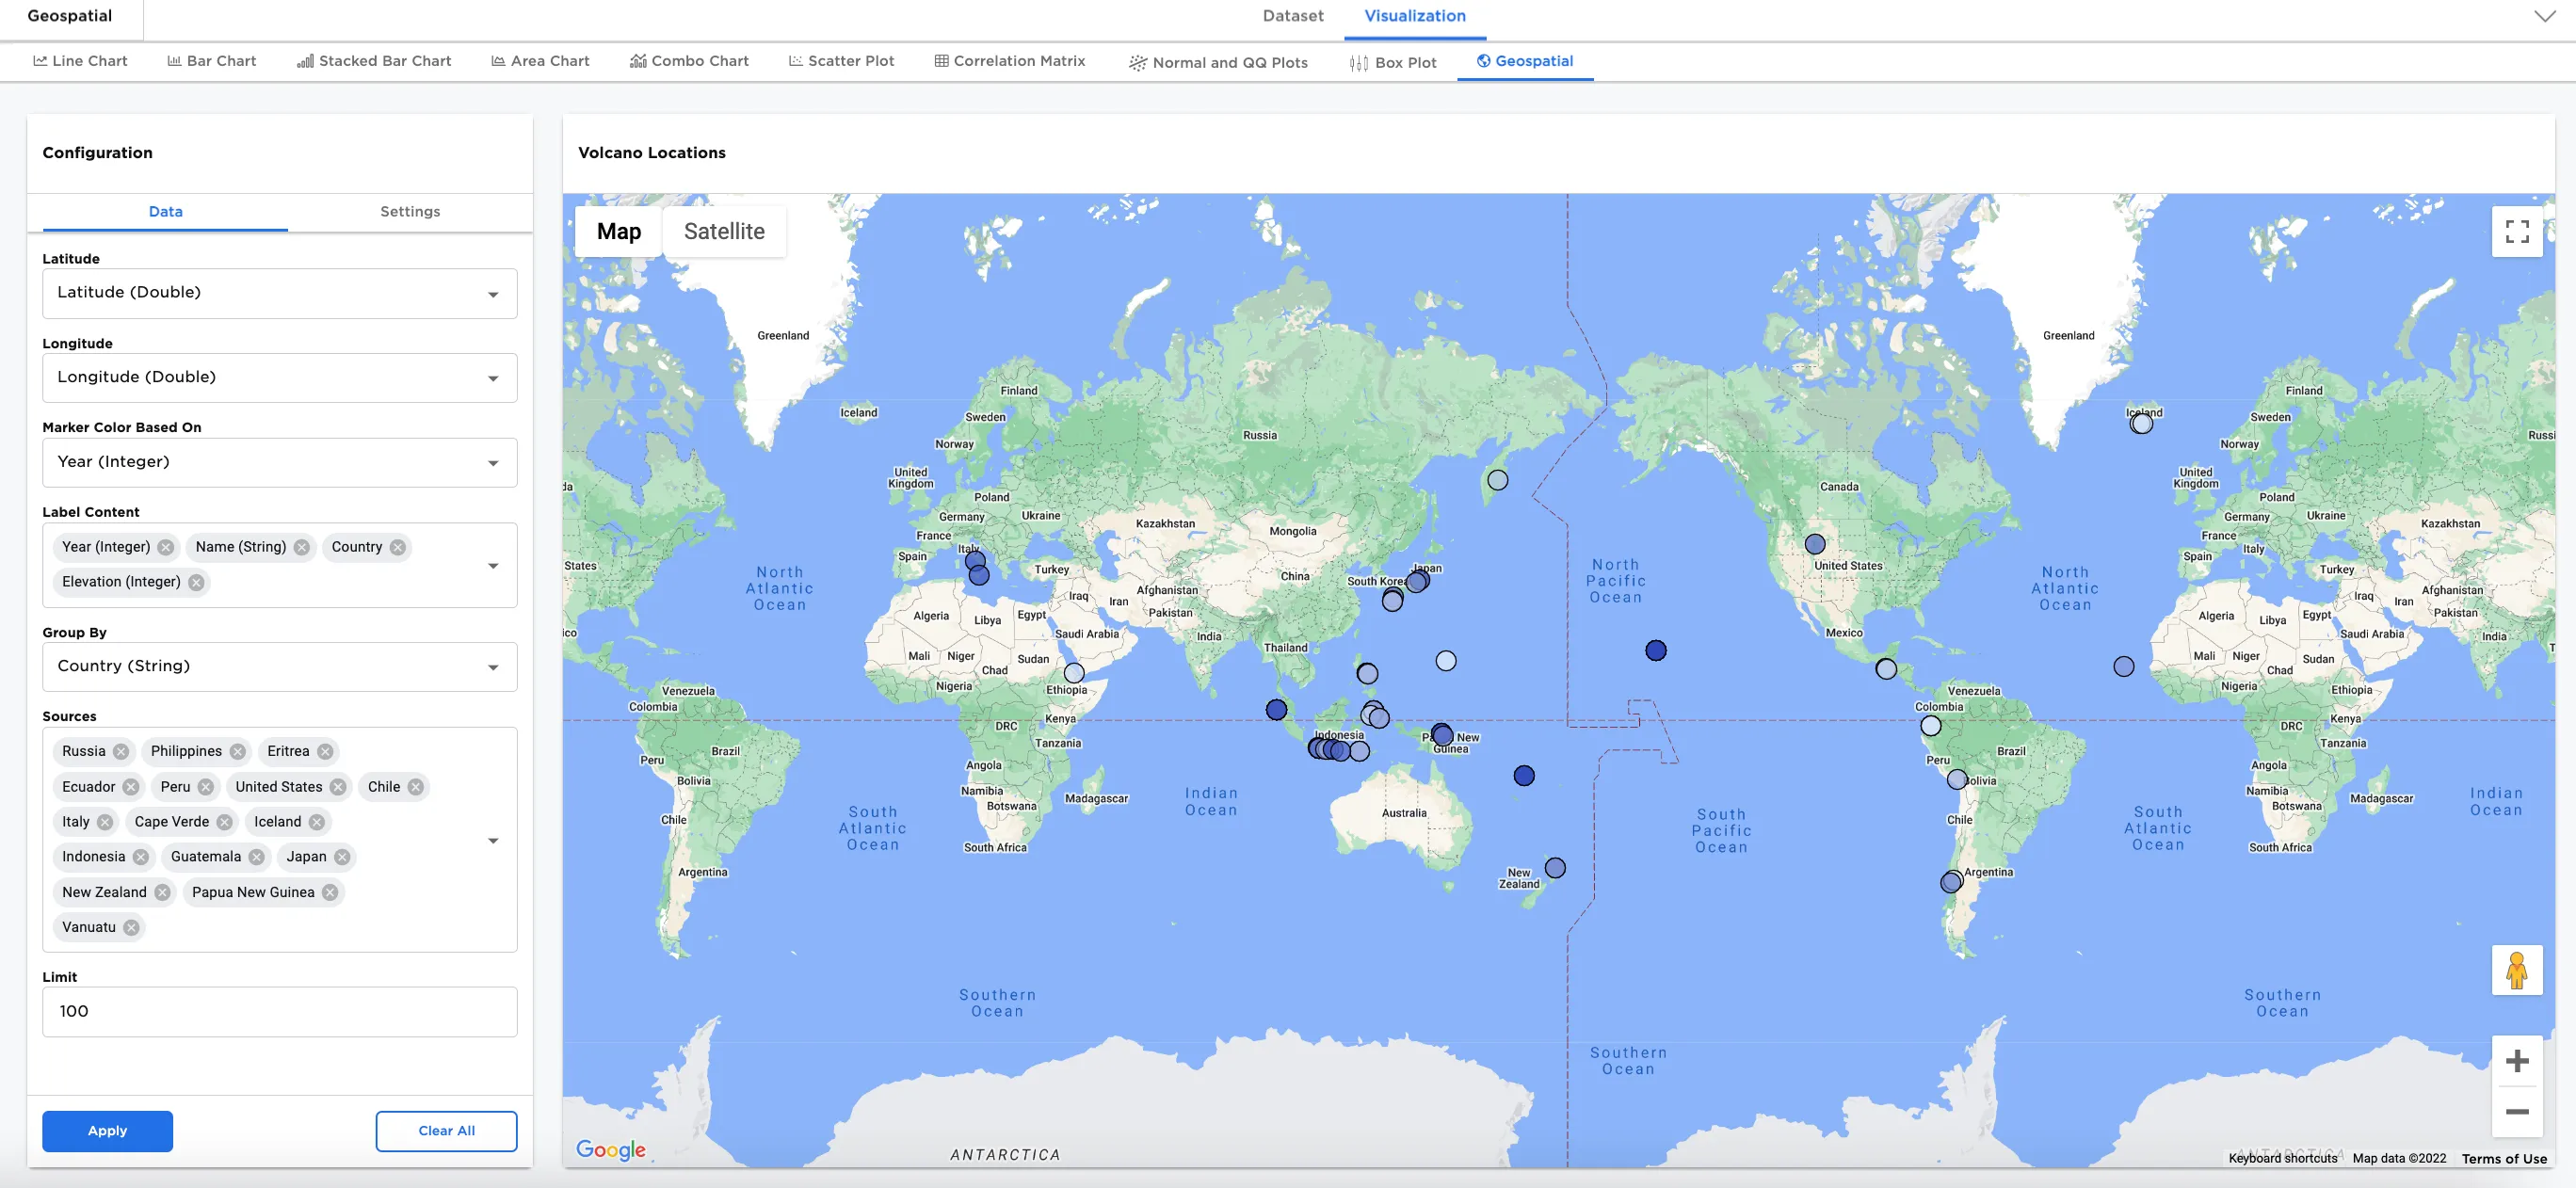
Figure 1: Example geospatial map output
Examples
To explore the Geospatial node visualization, we use a dataset that contains information about volcanos. Note that this node requires latitude and longitude information. Columns in this dataset include name, location, country, latitude, longitude, elevation, year, month, day, type, and status. There are also columns with the number of deaths, injuries, missing people, amount of damage, and houses destroyed.
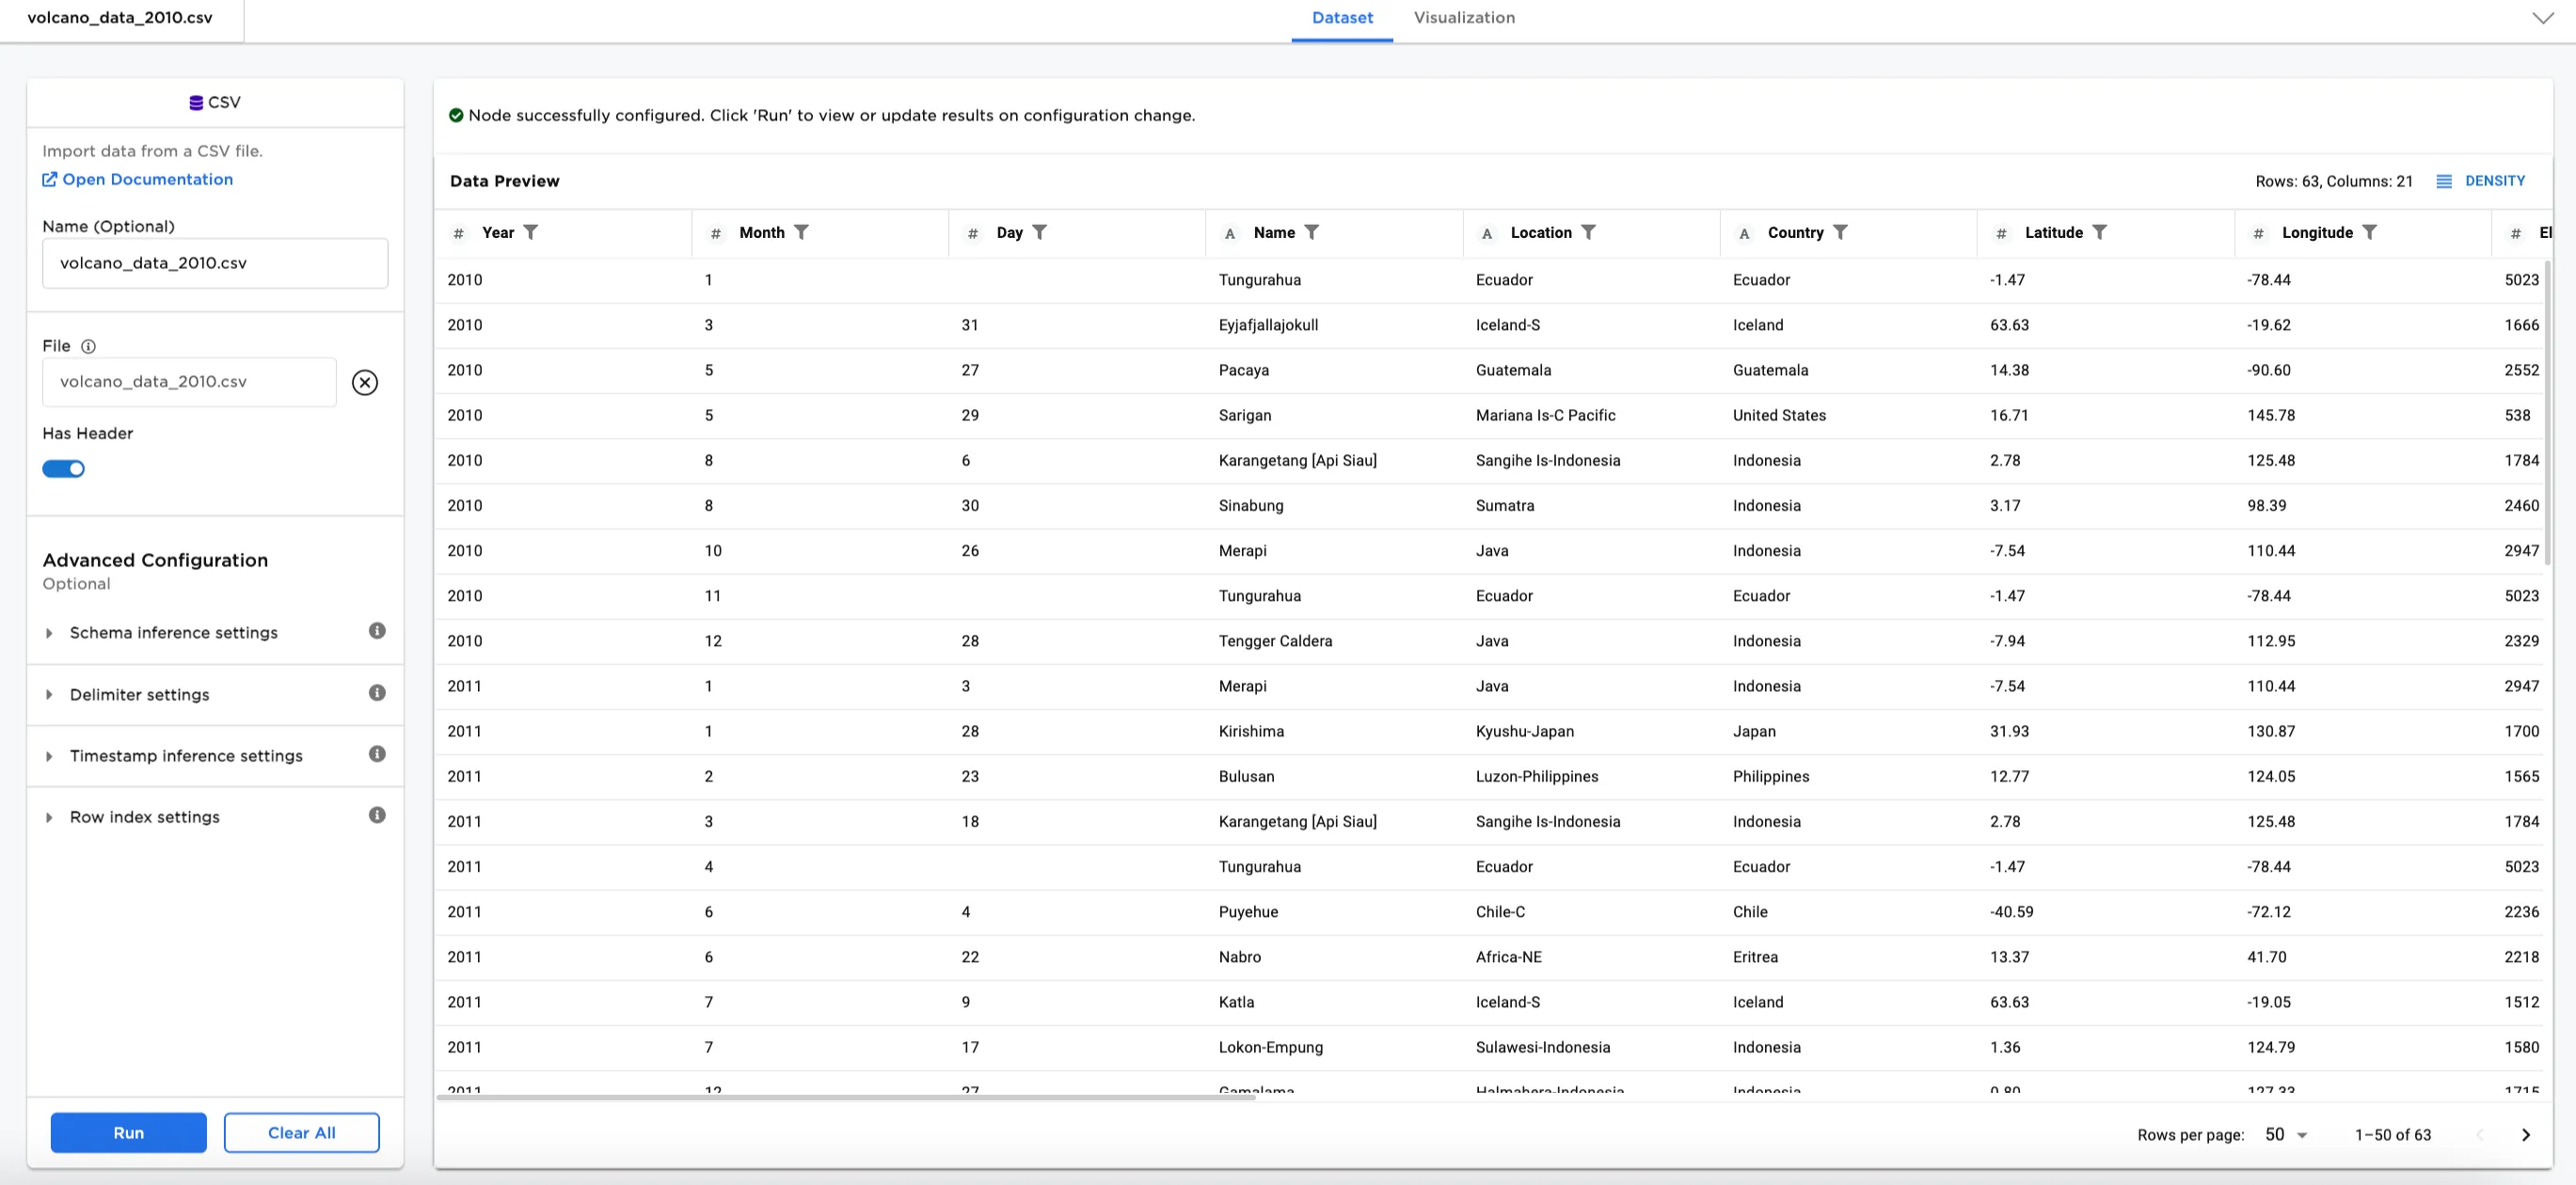
Figure 2: Example input dataset
- Connect a Geospatial node to an existing node. In this case, it is connected to the Volcanos CSV file.
- Select the
Latitude (Double)andLongitude (Double)columns for the Latitude and Longitude fields. - Optionally, select the Settings tab and enter a chart title. Figure 3 shows
Volcano Locations. - Select Apply.
Notice that Figure 3 shows the chart title in the top margin, and shows markers for every latitude and longitude location.
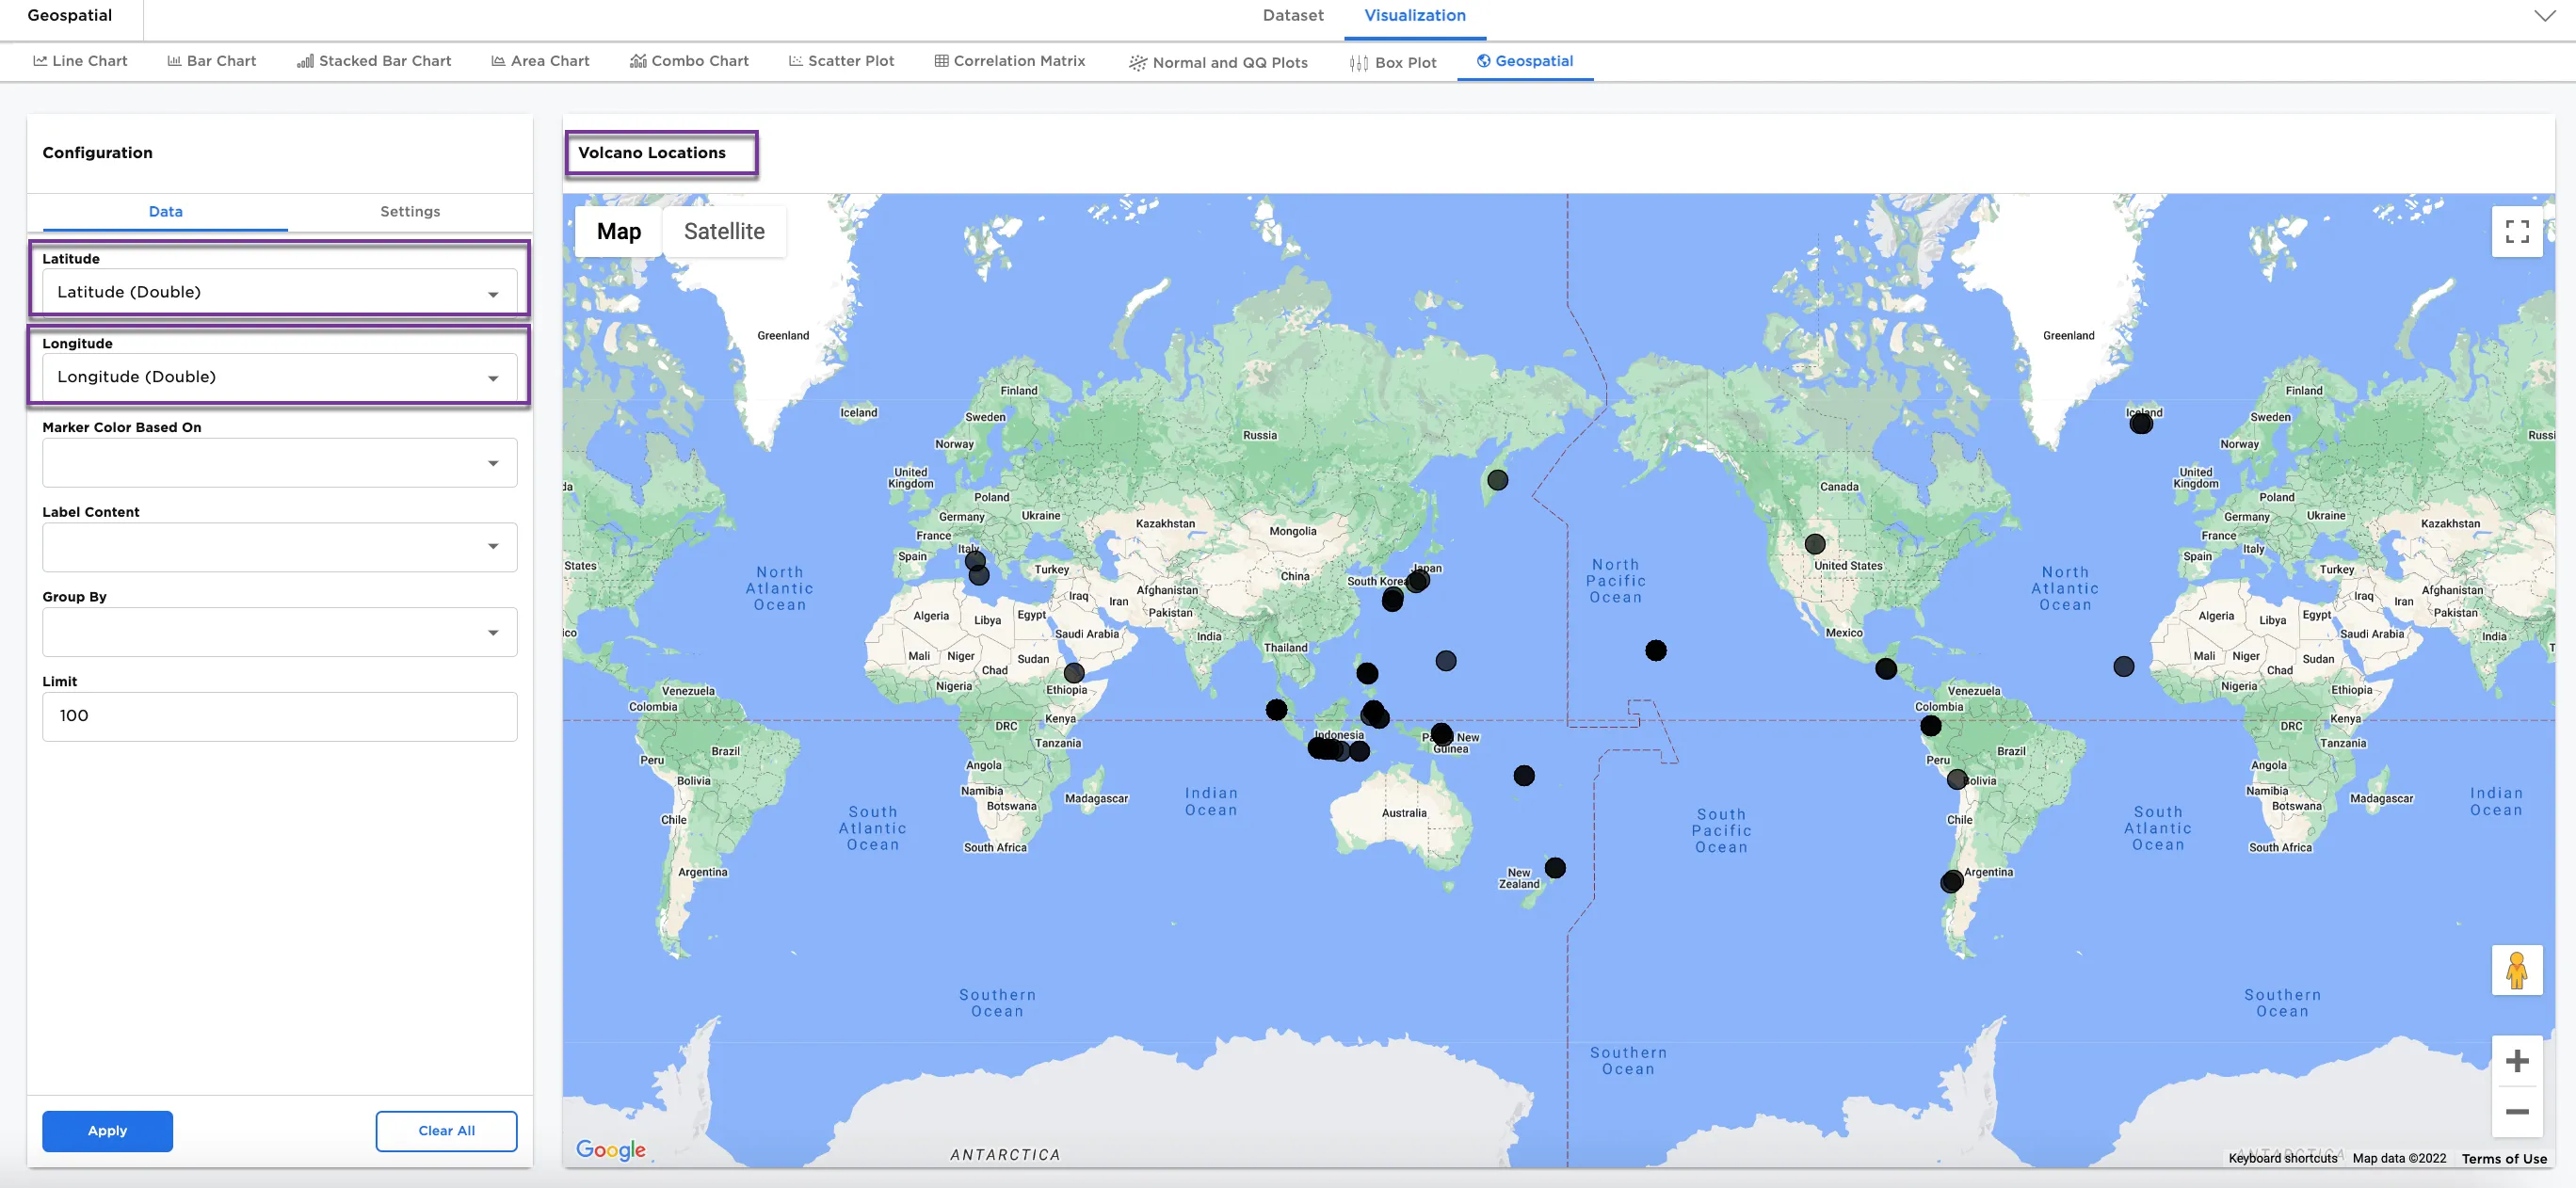
Figure 3: Example basic geospatial map
Optionally, we can show other details.
- Select a column for the marker color. This associates the marker color with a value, which shows the markers in gradient associated with those values.
- Select Apply.
Figure 4a has Elevation (Integer) selected and Figure 4b has Year (Integer) selected for comparison. Notice the difference in the marker colors.

Figure 4a: Example markers by elevation
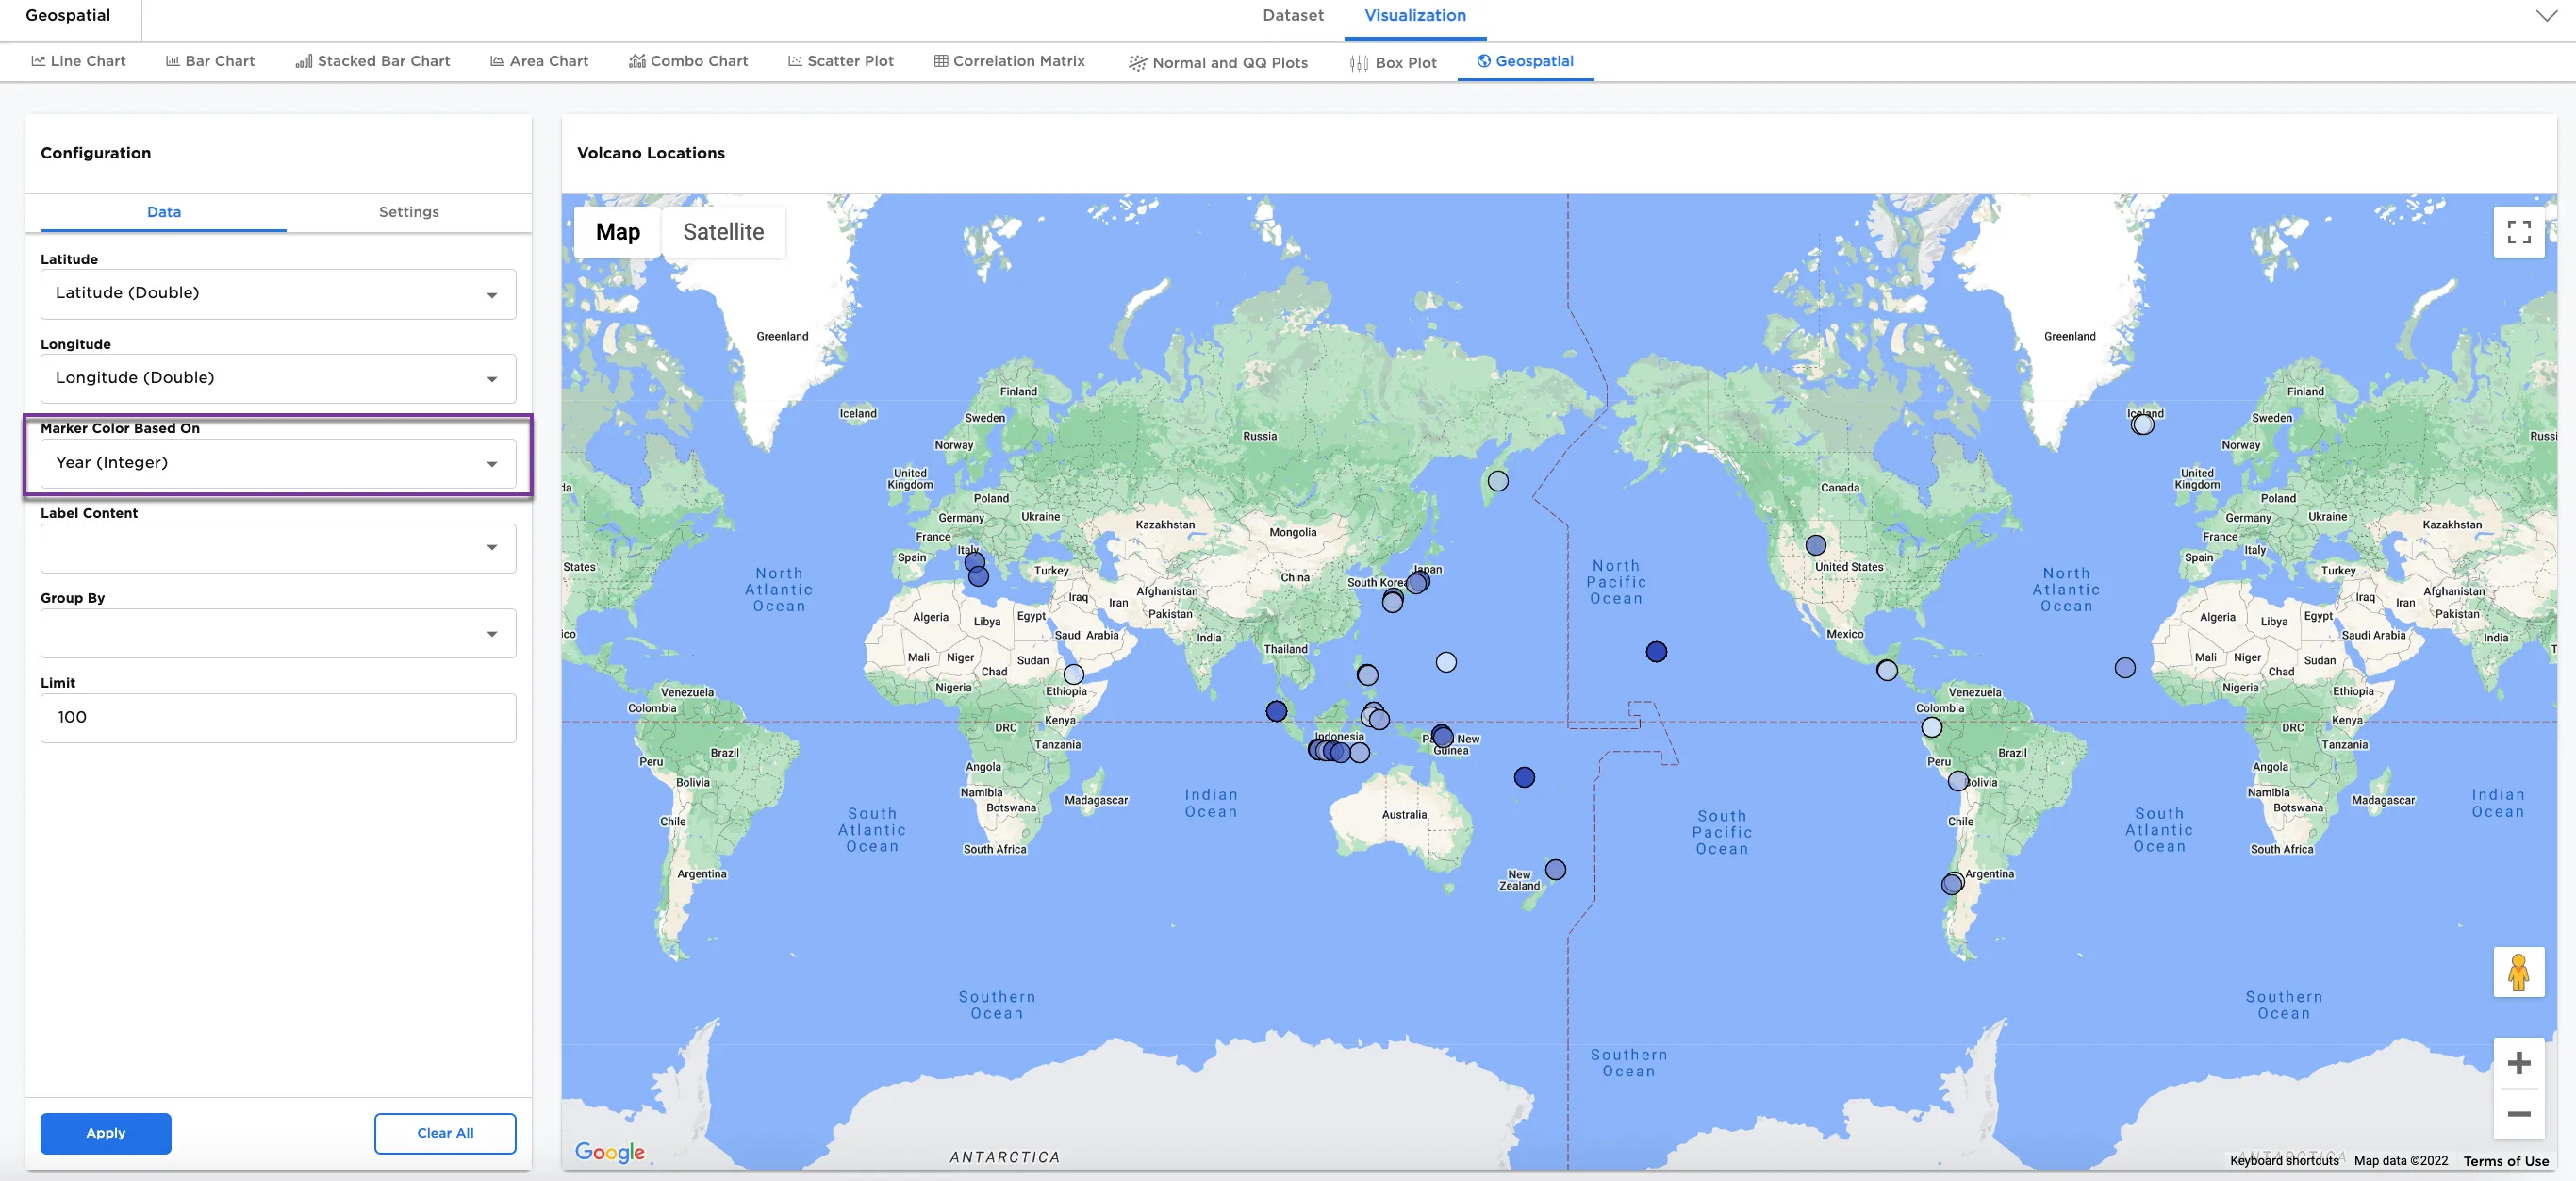
Figure 4b: Example markers by year
Another option to try is to add label content.
- In the Label Content field, select these columns:
- Year (Integer)
- Name (String)
- Country (String)
- Elevation (Integer)
- Type (String)
- Status (String)
Notice that in Figure 5, when selecting a marker, a label shows the selected columns.
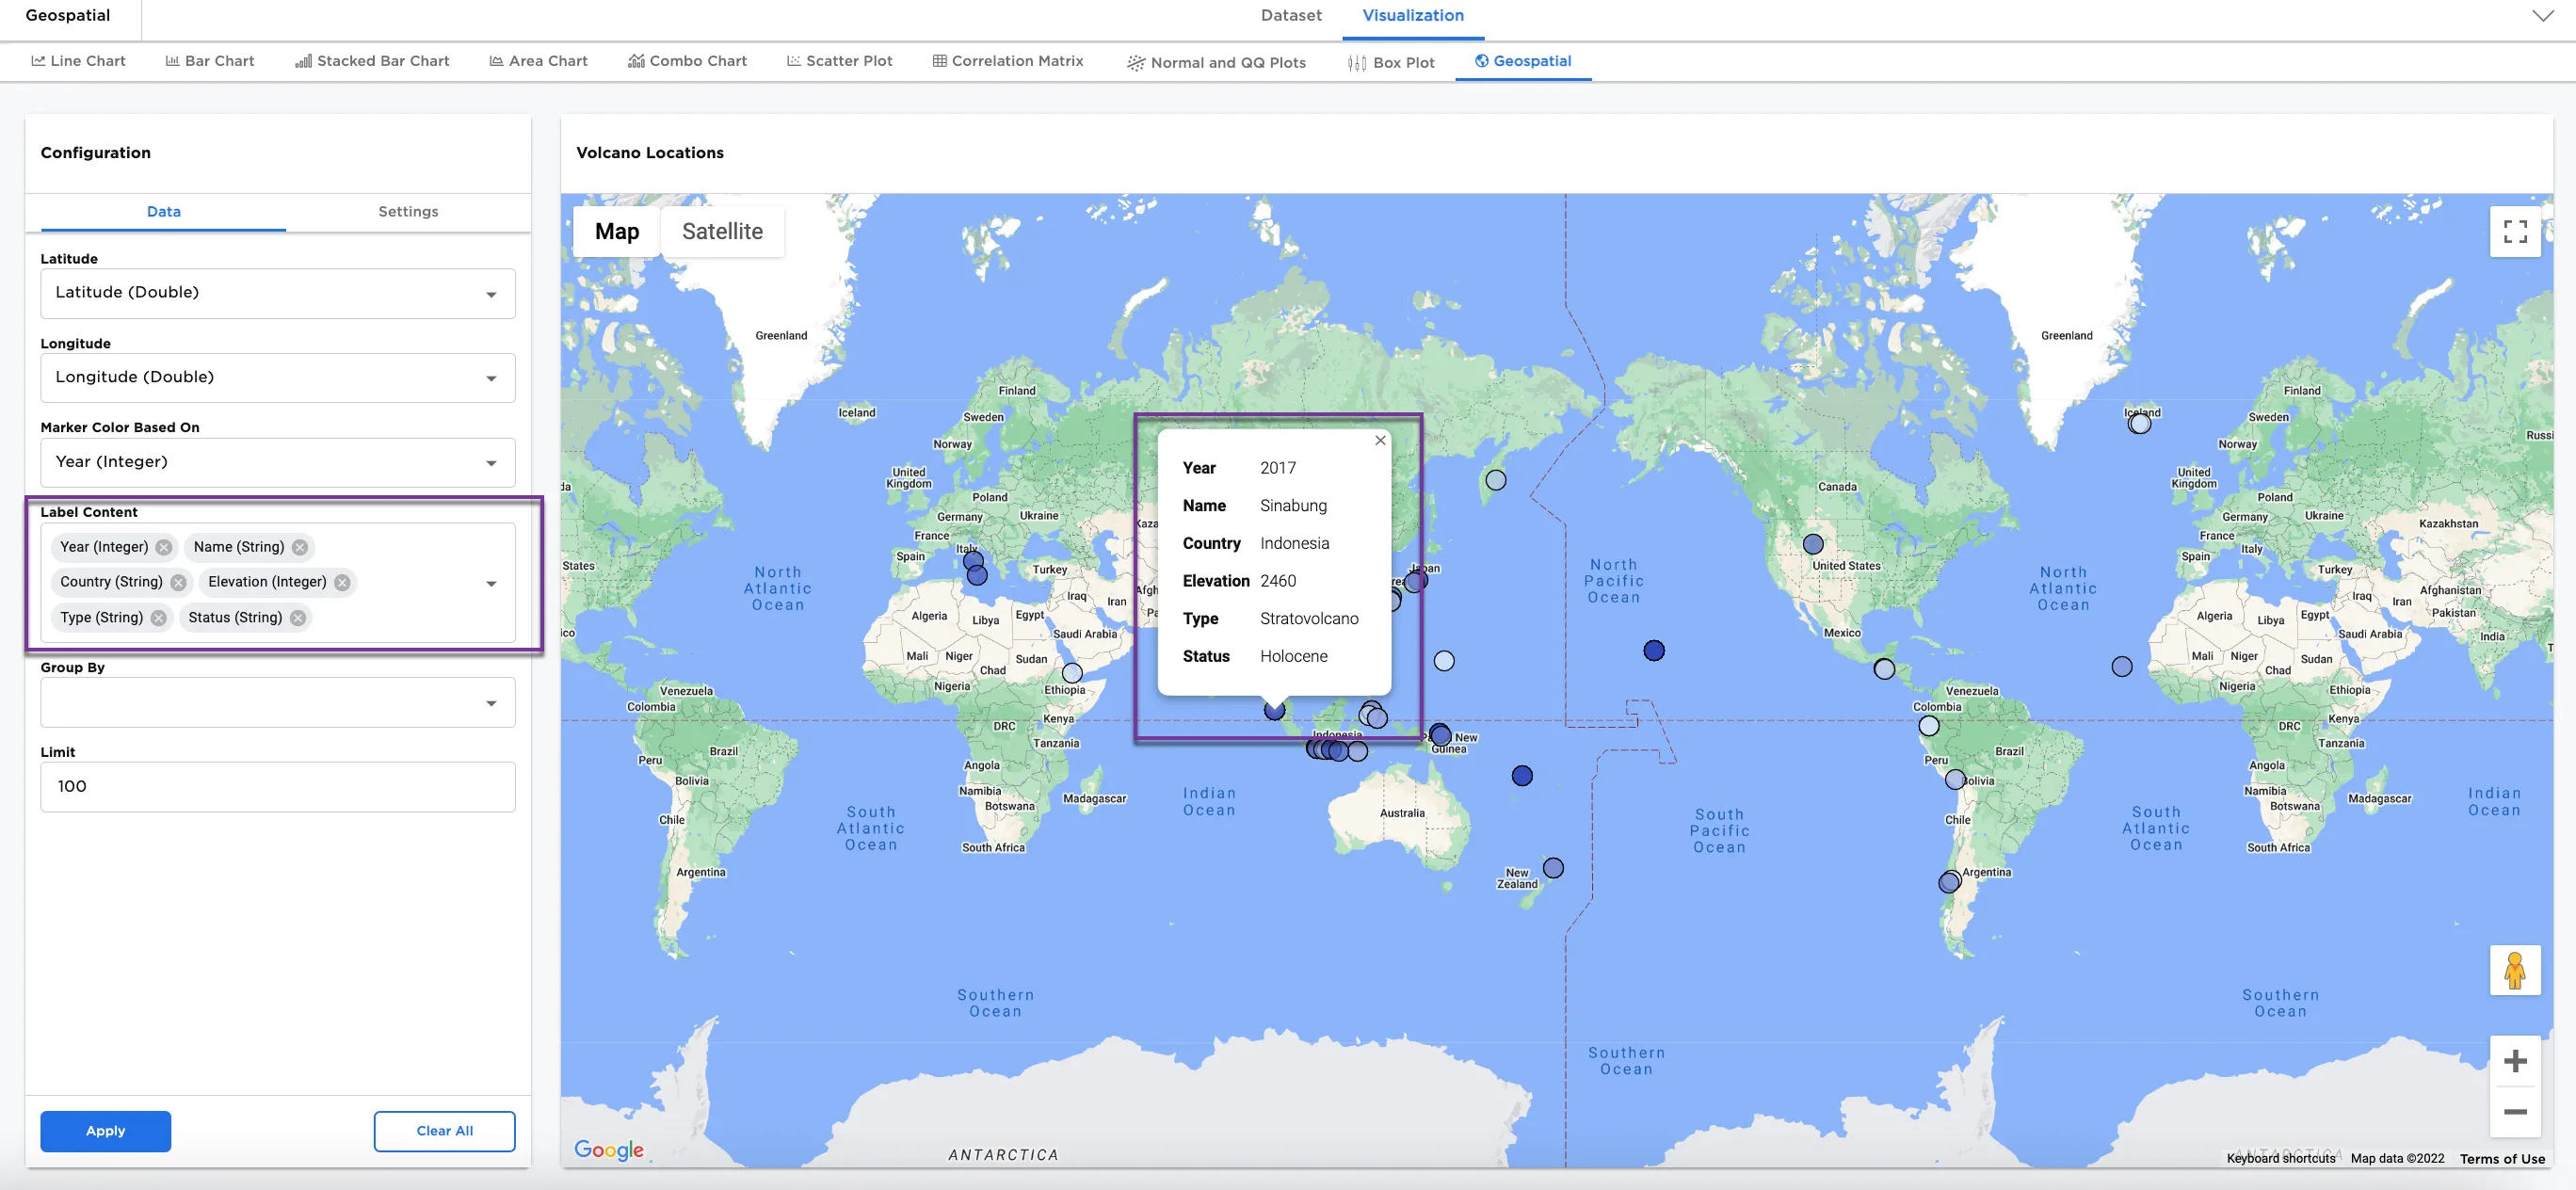
Figure 5: Example of labels for markers
The next option to try is Group by.
- Select a column to group by in the Group by field. In Figure 6, we have selected
TOTAL_DAMAGE_MILLIONS_DOLLARS (String). - When selecting a group by column, you are prompted to also select sources. In this case, all sources have been selected:
Low,Medium, andHigh. Selecting or not selecting sources offers a way to filter the data in the group. - Select Apply.
Notice that Figure 6 has zoomed in on a part of the map where the group by columns and source filters apply.
Note: The Group by field can also be used to filter sources. In terms of the selections made in Figure 6, if Low is removed from the source, only Medium and High appear in the diagram. For another example, instead of grouping by TOTAL_DAMAGE_MILLIONS_DOLLARS (String), if grouping by Country (String), specific countries can be selected for the group instead of selecting all.
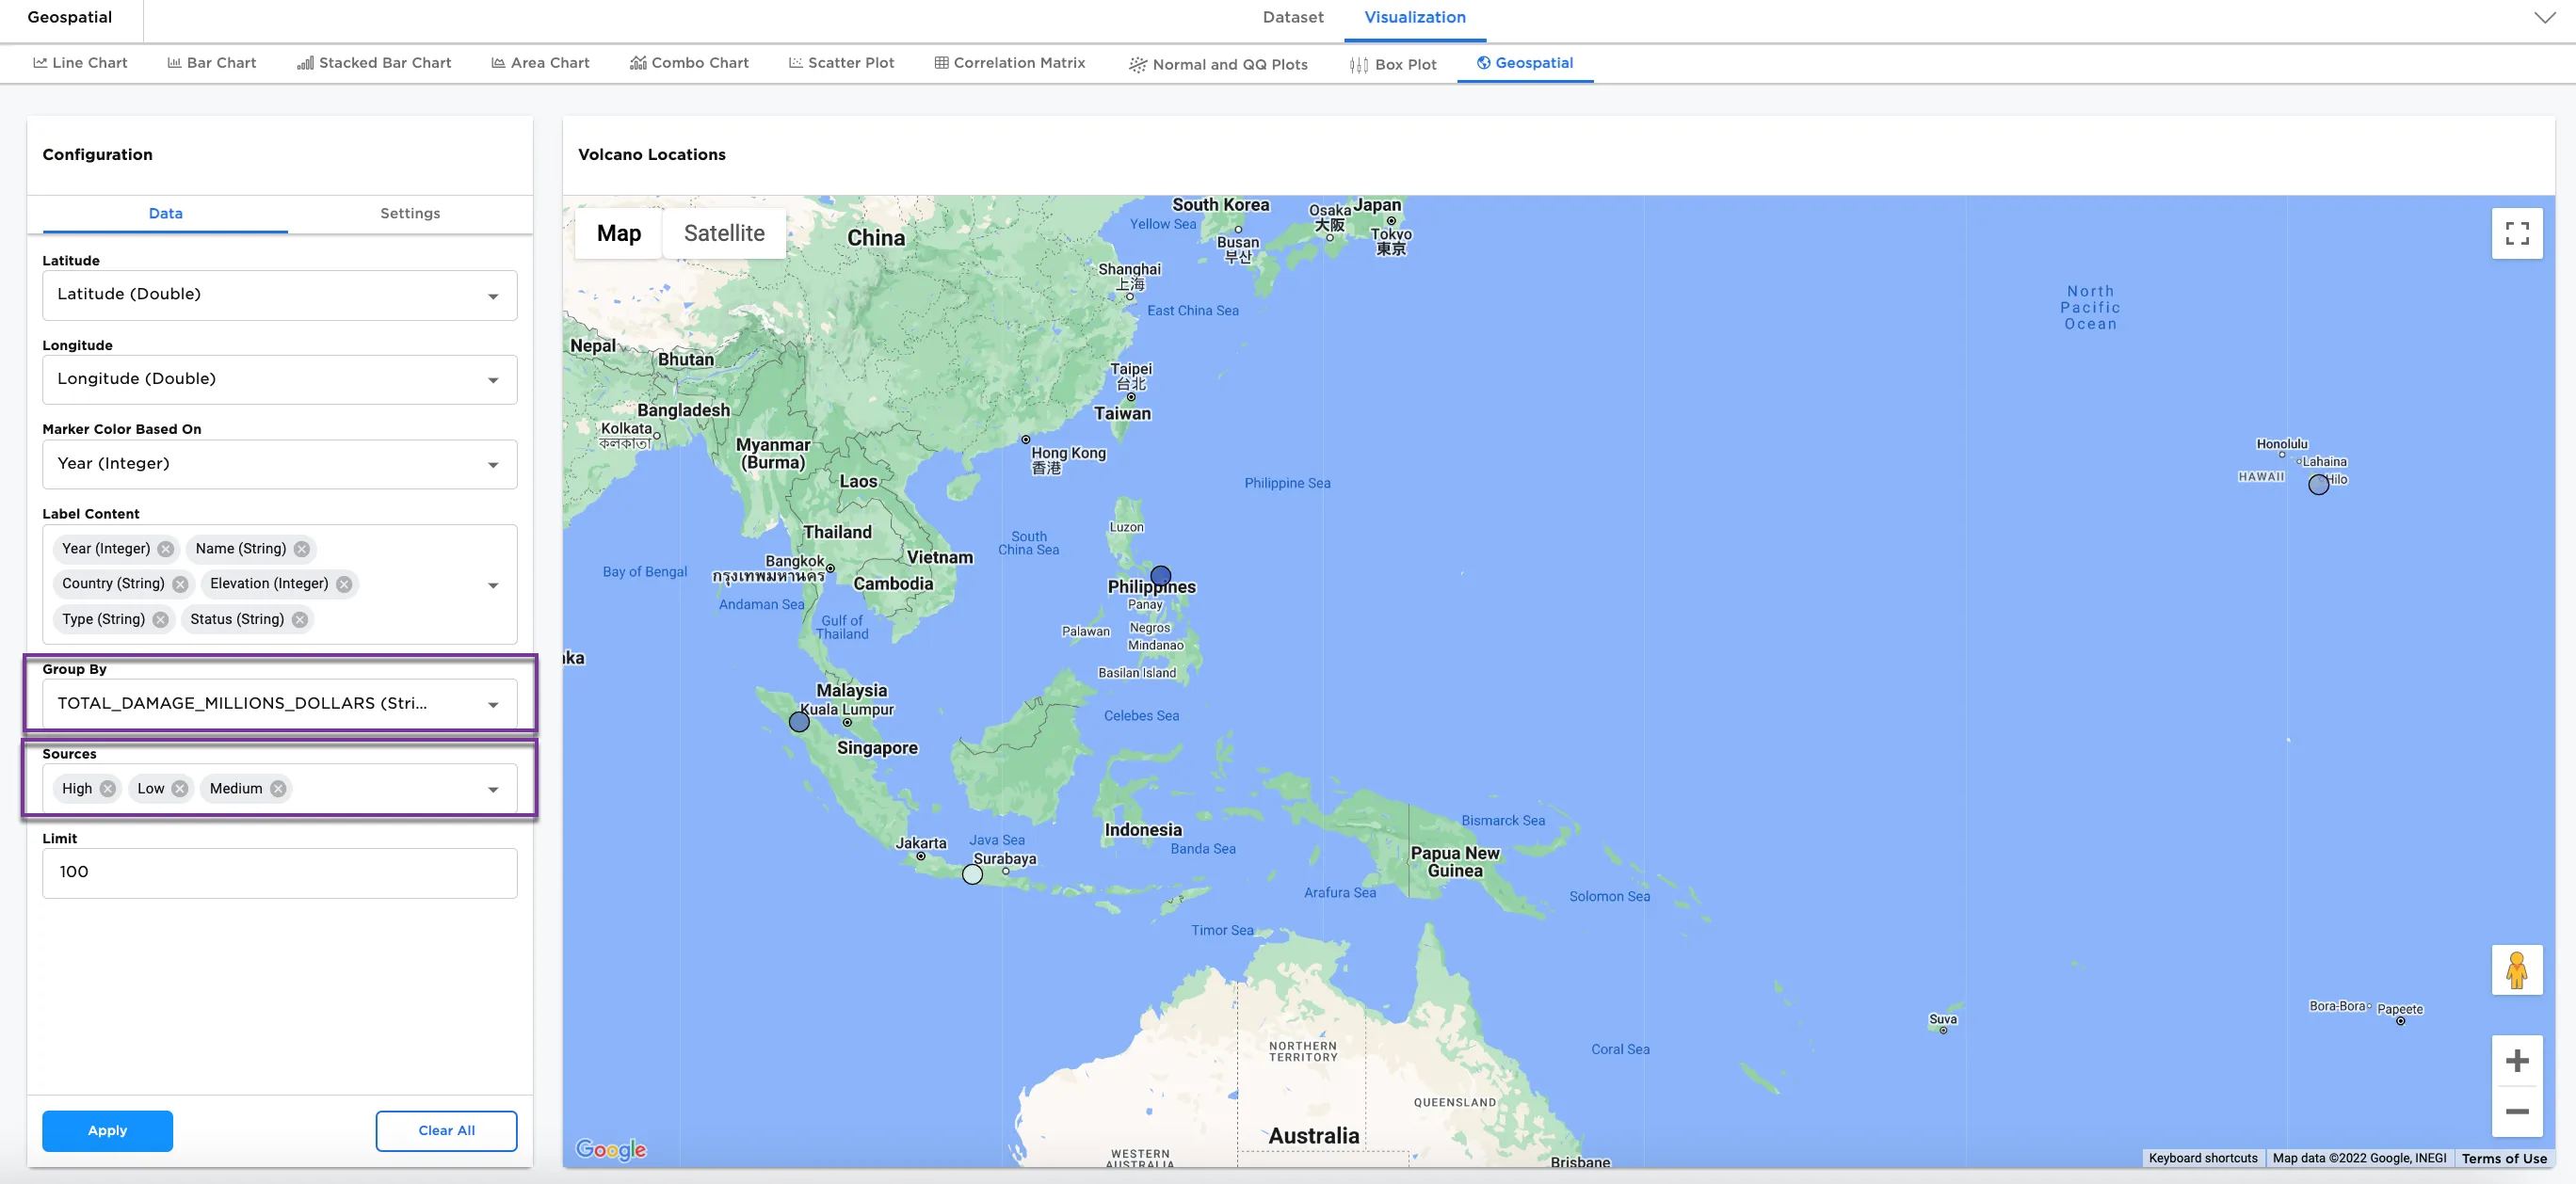
Figure 6: Example of group by and sources
The last option we explore is the Limit configuration field.
- Remove the Group By and Sources field entries by selecting the "X" in the Group By field.
- Change the Limit field from
100to15. - Select Apply.
Notice that only the first fifteen rows from the Volcano CSV dataset appears on the geospatial map.
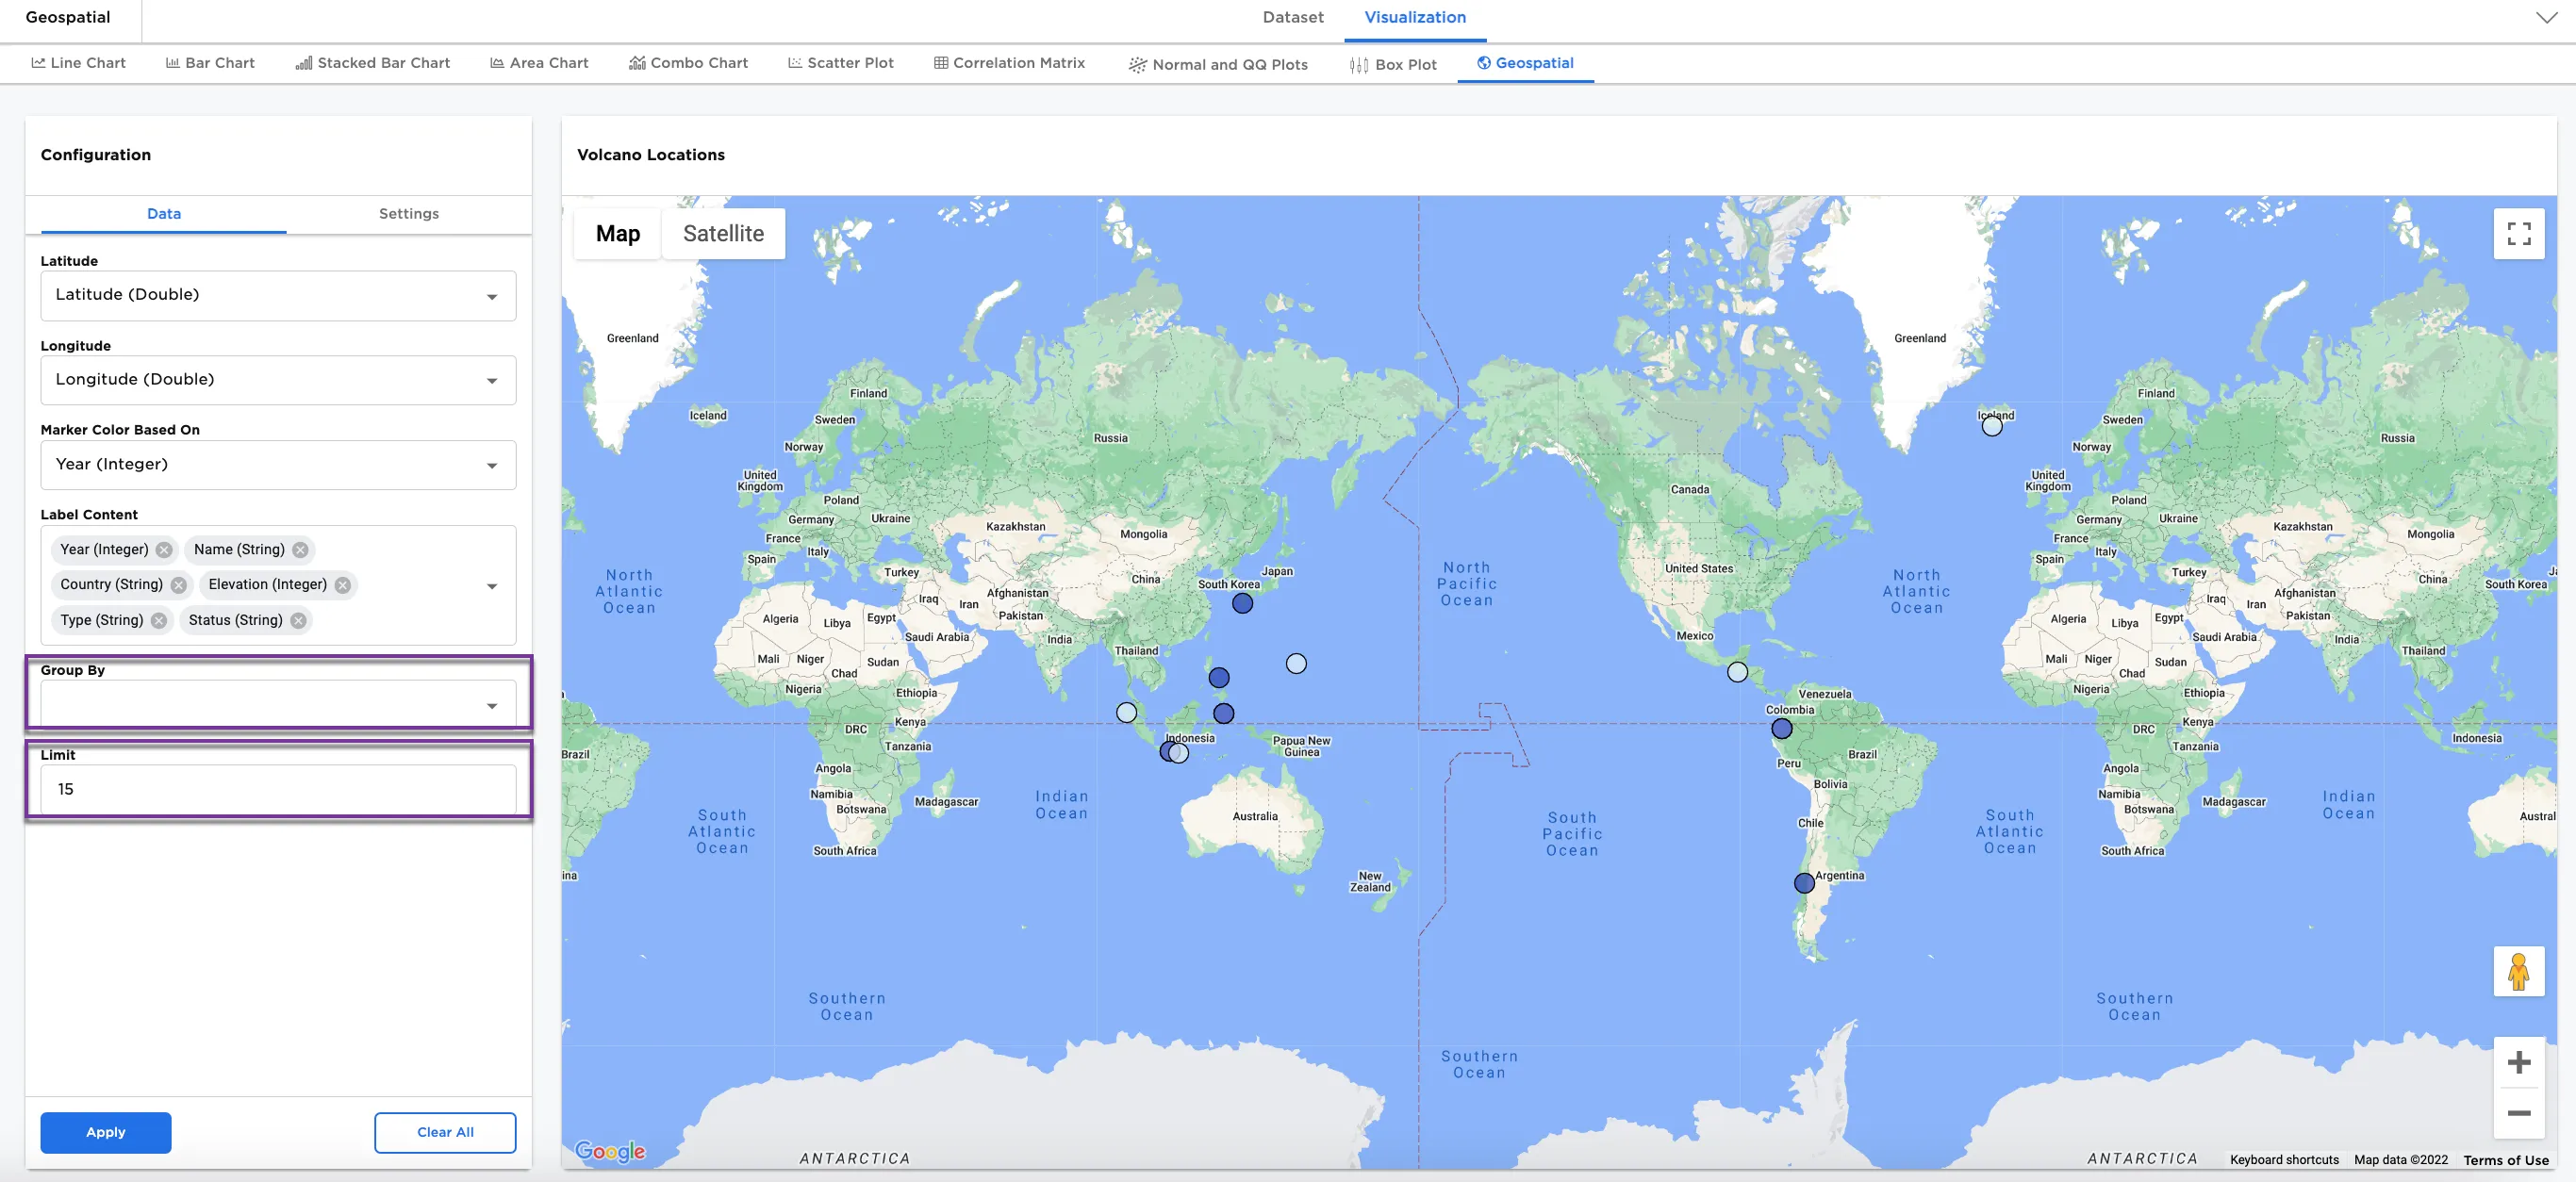
Figure 7: Example of limit