Python Visualization
Create Python visualizations in Visual Notebooks.
Configuration
| Field | Description |
|---|---|
Name default=Python Visualization | A user-specified node name displayed in the workspace |
Node Inputs/Outputs
| Input | A dataframe in Visual Notebooks |
|---|---|
| Output | A Python visualization |
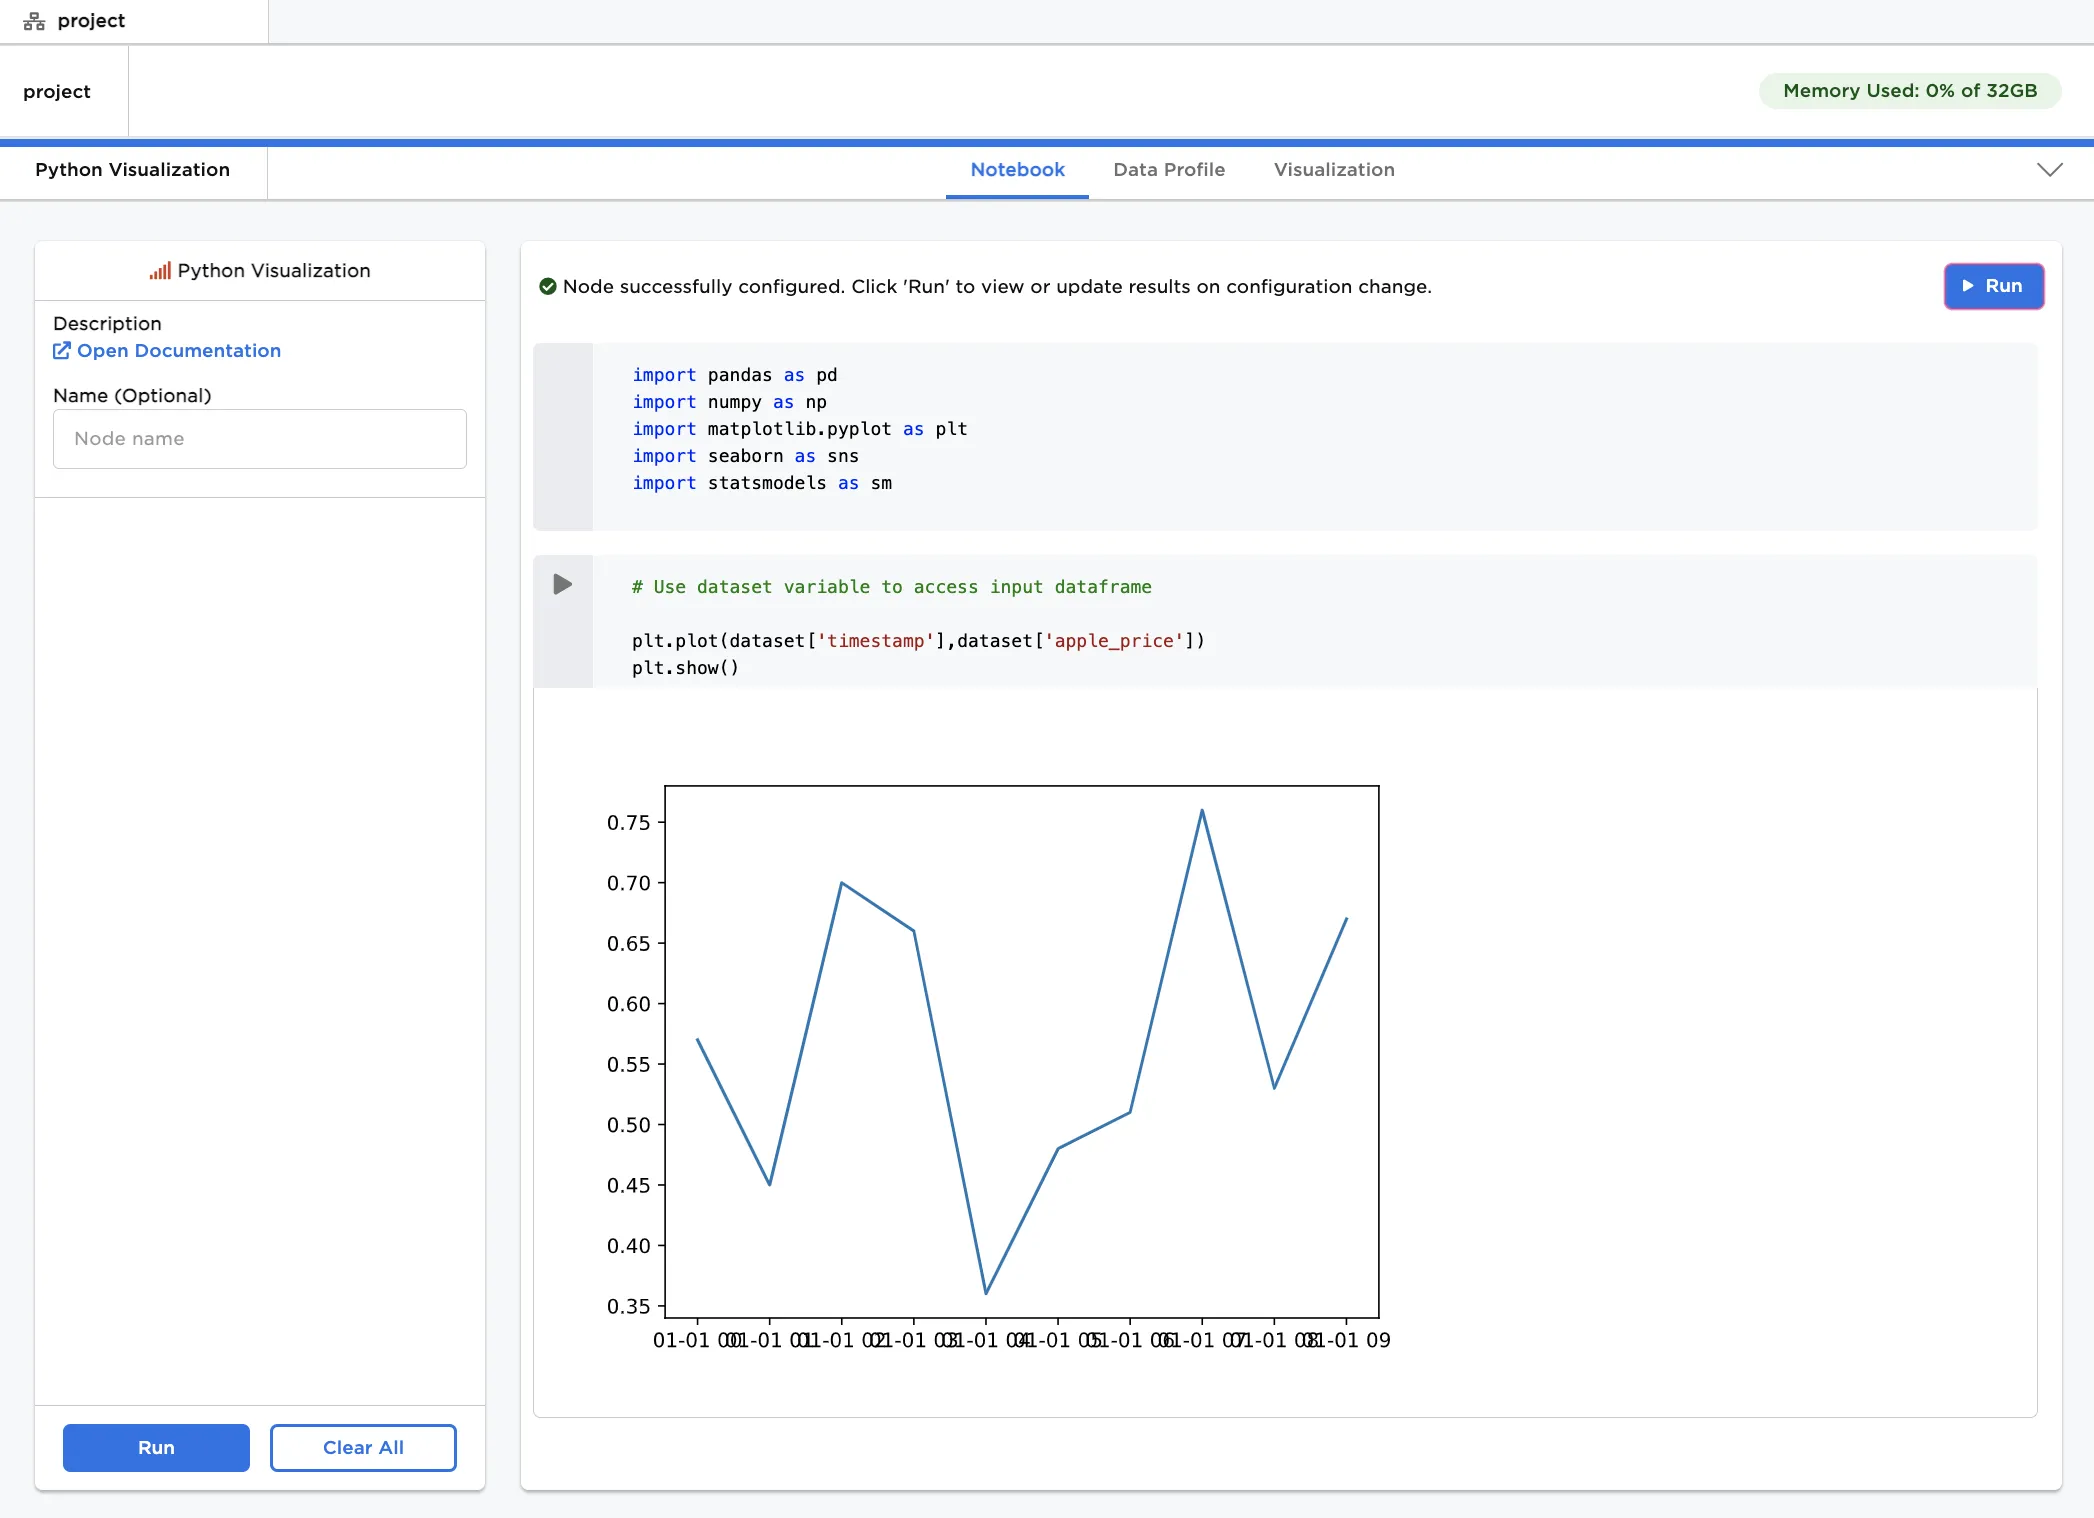
Figure 1: Example output
Examples
- Connect a Python Visualization node to an existing node.
- The data shown below is used in this example. It contains fictitious apple prices at various times.
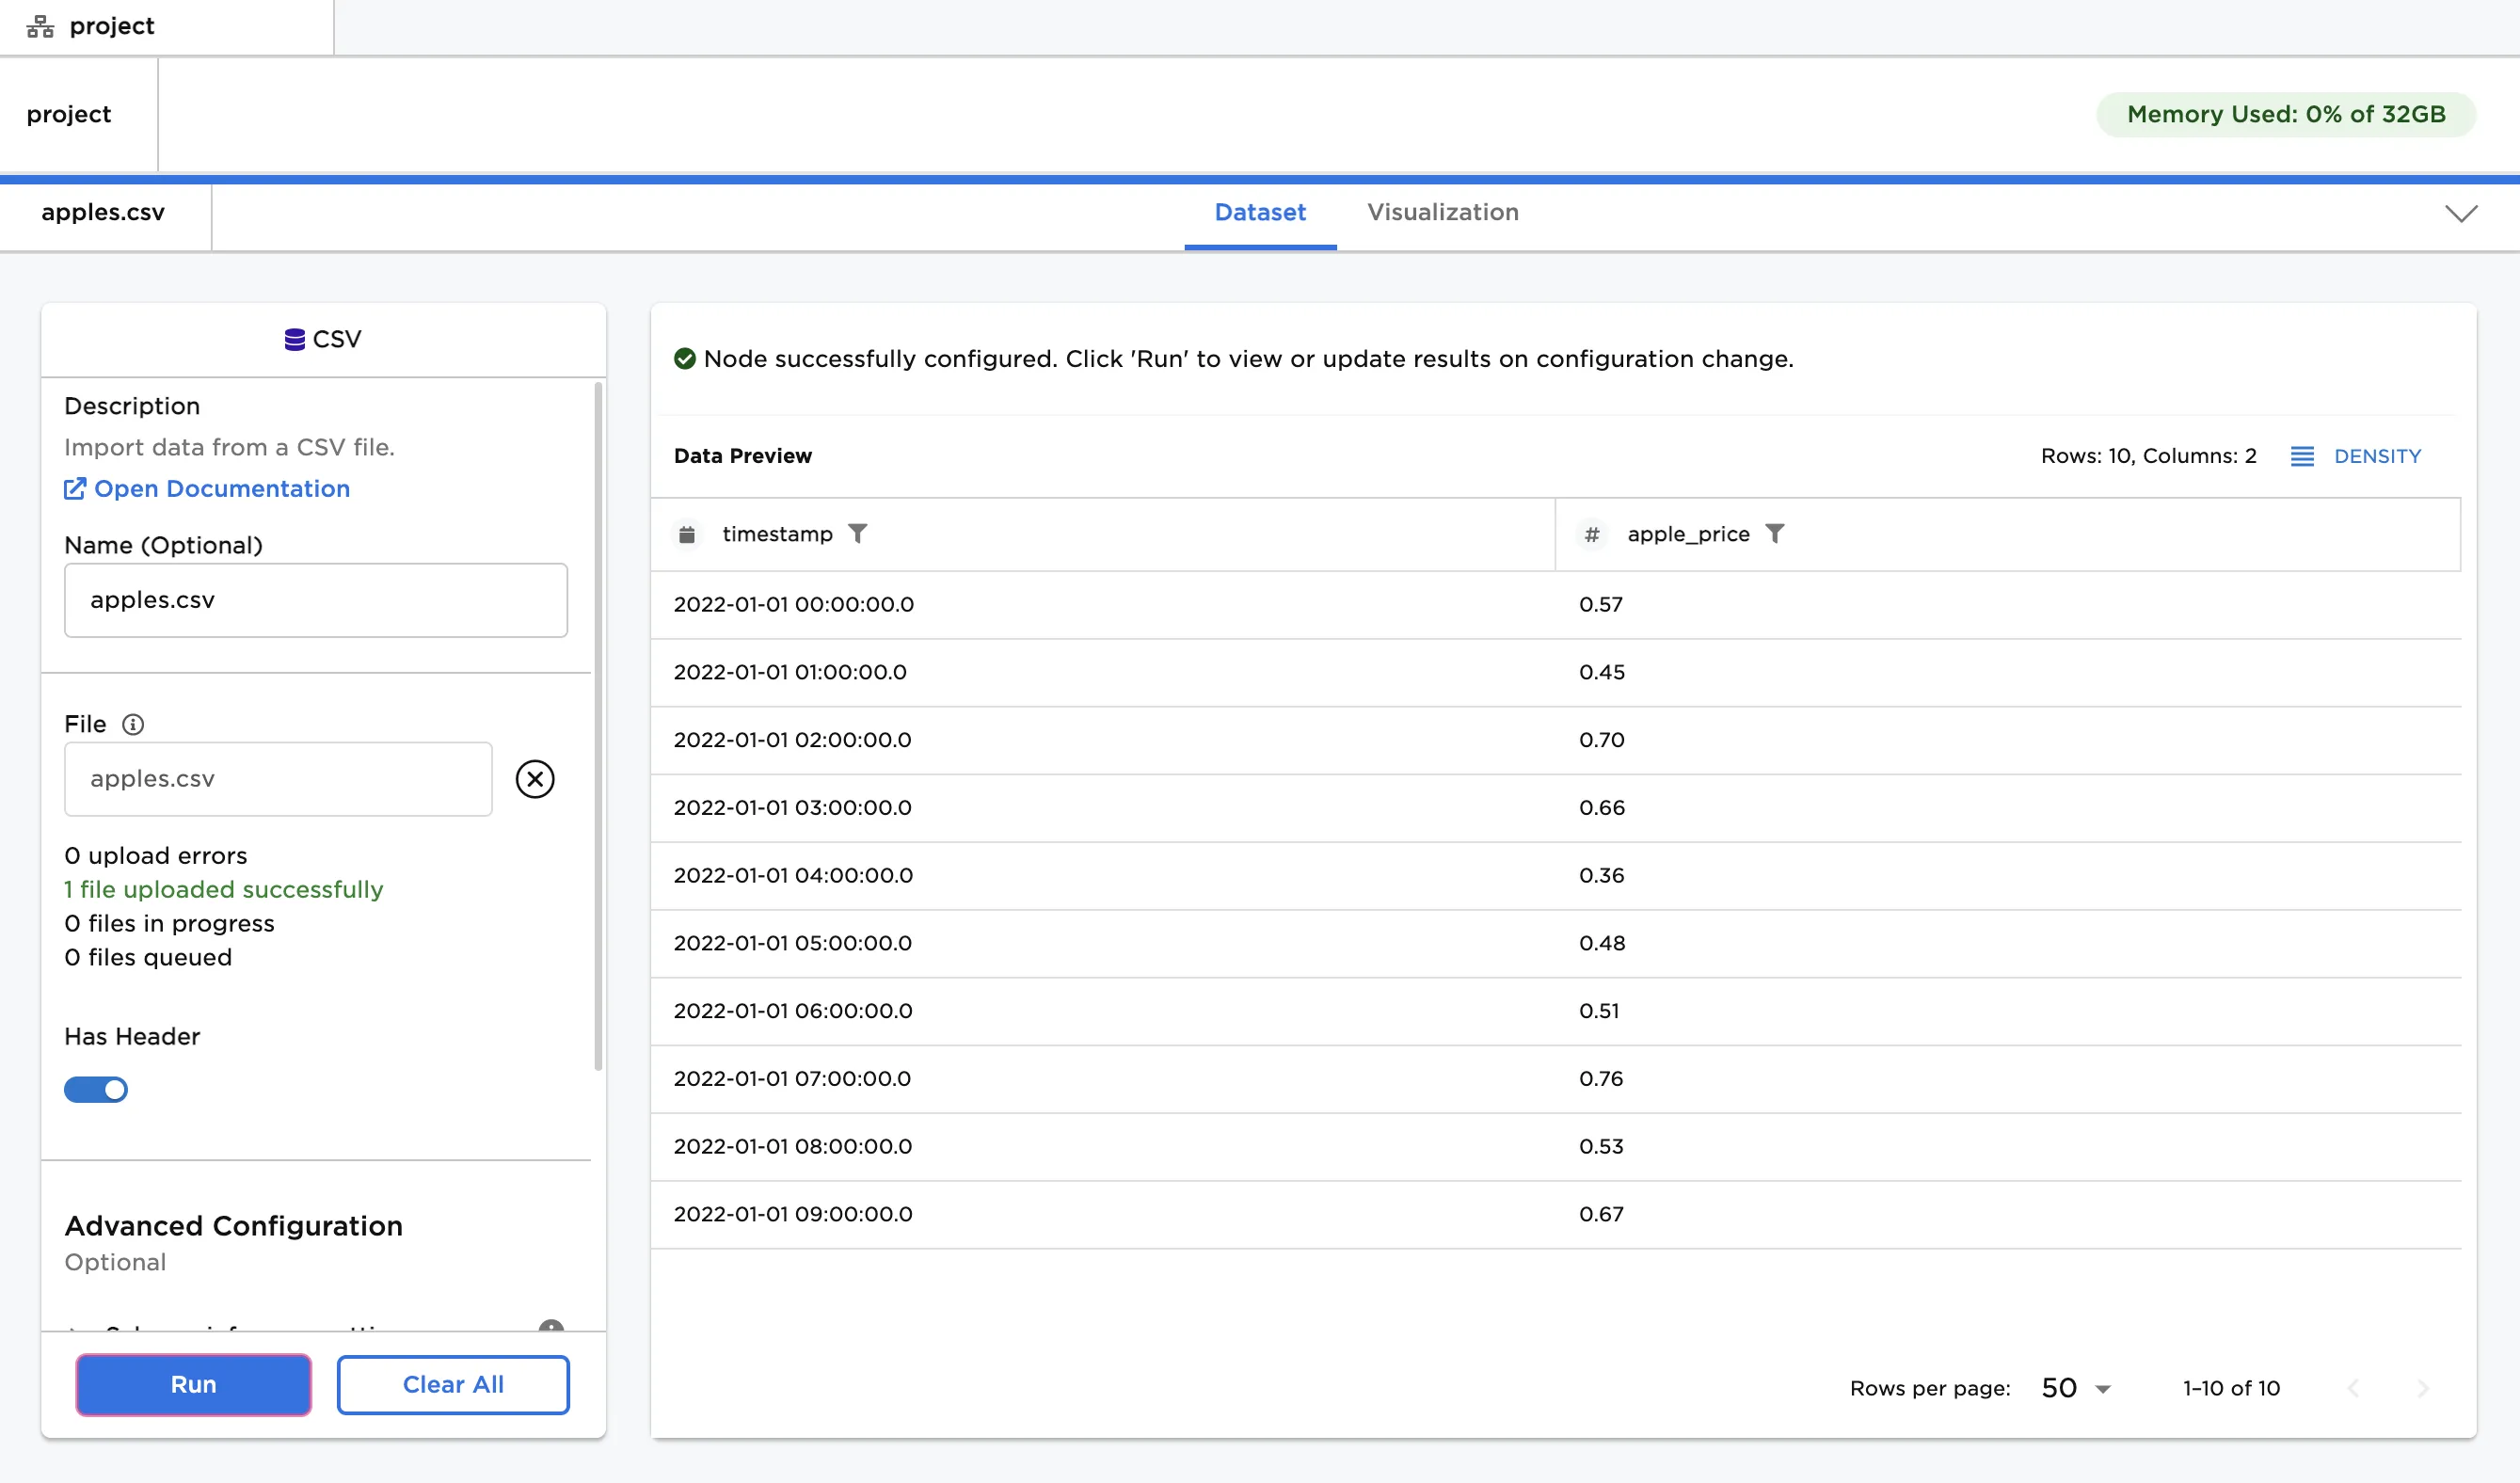
Figure 2: Example input
- Enter Python code that uses the Matplotlib library.
- The dataframe in Visual Notebooks is turned into a pandas dataframe called
dataset. Refer to columns in the Visual Notebooks dataframe withdataset['columnname'].
- The dataframe in Visual Notebooks is turned into a pandas dataframe called
- Select "Run" to create a Python visualization.
Figure 3: Example Python visualization with Matplotlib
- Enter Python code that uses the pandas, NumPy, seaborn, or statsmodels libraries.
- Select "Run" to create a Python visualization.
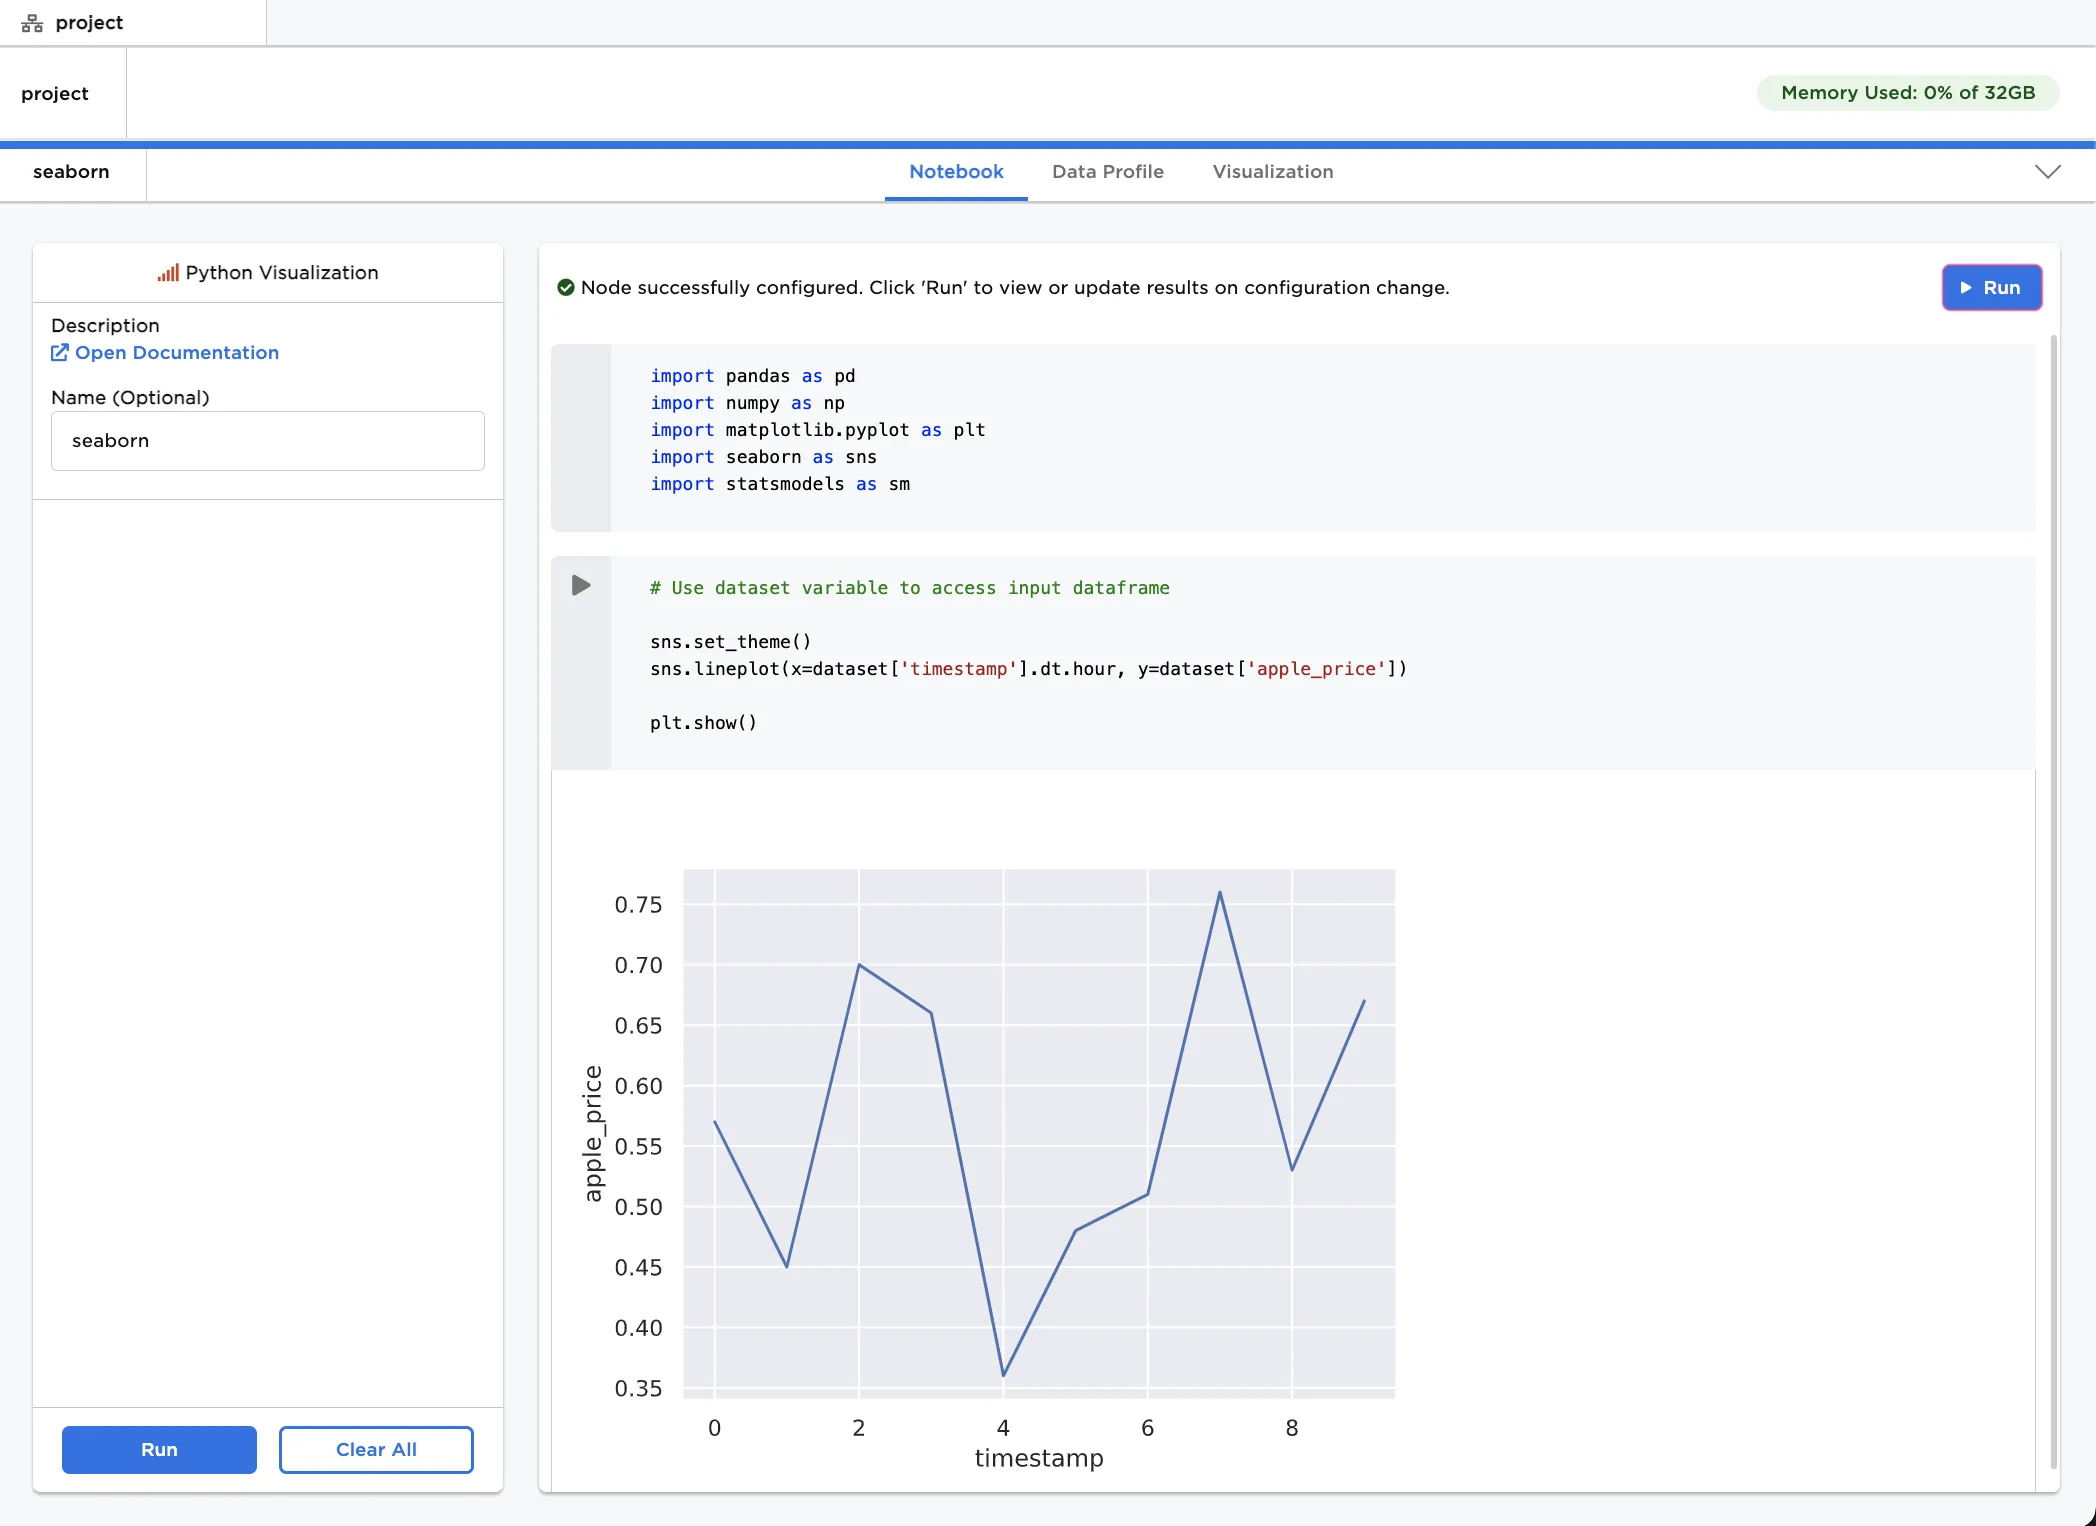
Figure 4: Example Python visualization with multiple libraries