GLM Classification
Categorize data using a GLM (generalized linear model) classifier. GLM models can learn simple linear concepts easily. This is a good model to test-run alongside the Random Forest Classification to see if non-linearity yields gains on the problem at hand.
Configuration
| Field | Description |
|---|---|
| Name default=none | A user-specified node name displayed in the workspace |
| Select Column with Labels *Required | The column the GLM classifier should predict Select a column from the dropdown menu. This column contains the labels that the model should be able to predict after the training. |
Advanced Configuration
Optionally alter the advanced configuration fields to control the output of the node.
Select Features
| Field | Description |
|---|---|
Select Features default=Select all columns as features, excluding the selected label column | Features to train the model with Use all columns as features, or select specific columns using the dropdown menu. Columns selected as features are used to train the model. |
Select optional timeseries column default=Off | Timeseries column If there is a timeseries column in your data, check the box in this field and select the timeseries column from the dropdown menu. Timeseries information is used when splitting the data into separate train, validation, and test datasets. |
Test and Validation Settings
When training models, data is split into multiple components. The bulk of the data is used for training and validation, while a small portion is set aside for testing. The fields in this section determine what percentage of the data is used for training, how the data is used during the training process, and the strategy used to split the data.
| Field | Description |
|---|---|
Select test and validation method default=Train-validation-split | Test and train method Select Train-validation-split to split the dataset into separate train, validation, and test datasets. Select Cross-validation to split the data into a specified number of subsets. During training, one subgroup is used for testing and validation, while the other subgroups are used for training. The process is then repeated so each subgroup is used as the testing and validation group once. |
Select percentage split default=Train: 70%, Validation: 15%, Test: 15% | Data split percentage Move the slider to split the data into test, validation, and train datasets. If Cross-validation is selected in the Select test and validation method field, move the slider to split the data into a train dataset that will be divided into subgroups, and a separate testing dataset. The default split when using the cross-validation method is 80% train and 20% test. |
Select number of cross-validation folds default=6 | Number of cross-validation subgroups Enter a number between 2 and 20. The data allocated for training is divided into the specified number of subgroups. |
Select sampling method default=Stratified | Data splitting strategy Select Stratified to ensure that each dataset and subgroup contains the same percentage of each label as the entire dataset. Select Random to randomly split the data into the percentages specified above. Note that selecting Random may result in test data that doesn't accurately represent the entire dataset. |
Repeatability Seed
Random numbers are used throughout the training process for splitting the original dataset, splitting individual trees, and optimizing hyperparameters. Ex Machina uses one number, called a seed, to generate all additional numbers needed thereafter. The field in this section allows you to enter a custom seed. If you enter a custom seed, you can enter that same custom seed at a later date to reproduce the results of training.
| Field | Description |
|---|---|
Seed default=Random | The number used throughout the AutoML process Select Random to use a random number, or select Custom to enter a specific integer. |
Prediction
The output of this node is each model's predictions on the training data. This section determines how the predictions are portrayed in the resulting dataframe.
| Field | Description |
|---|---|
Prediction Column Name default=prediction | The column name for the model's predictions Enter a name for the column that contains the selected model's predictions. Column names can contain alphanumeric characters and underscores, but cannot contain spaces. |
Add column with probabilistic output scores default=On | Model prediction probabilities Leave this switch on to create a column with the model's confidence in each prediction. Toggle this switch off to create a dataframe without this column. |
Dataset Selection default=Train Dataset | Data used to display a model's predictions Select All Data, Train Dataset, Validation Dataset, or Test Dataset. Visual Notebooks displays a selected model's predictions on the dataset selected with this field. If you select Cross-validation for the Select test and validation method field, the Validation Dataset option is unavailable. |
Node Inputs/Outputs
| Input | A Visual Notebooks dataframe |
|---|---|
| Output | A trained GLM classifier model and a dataframe with predictions on the training data |
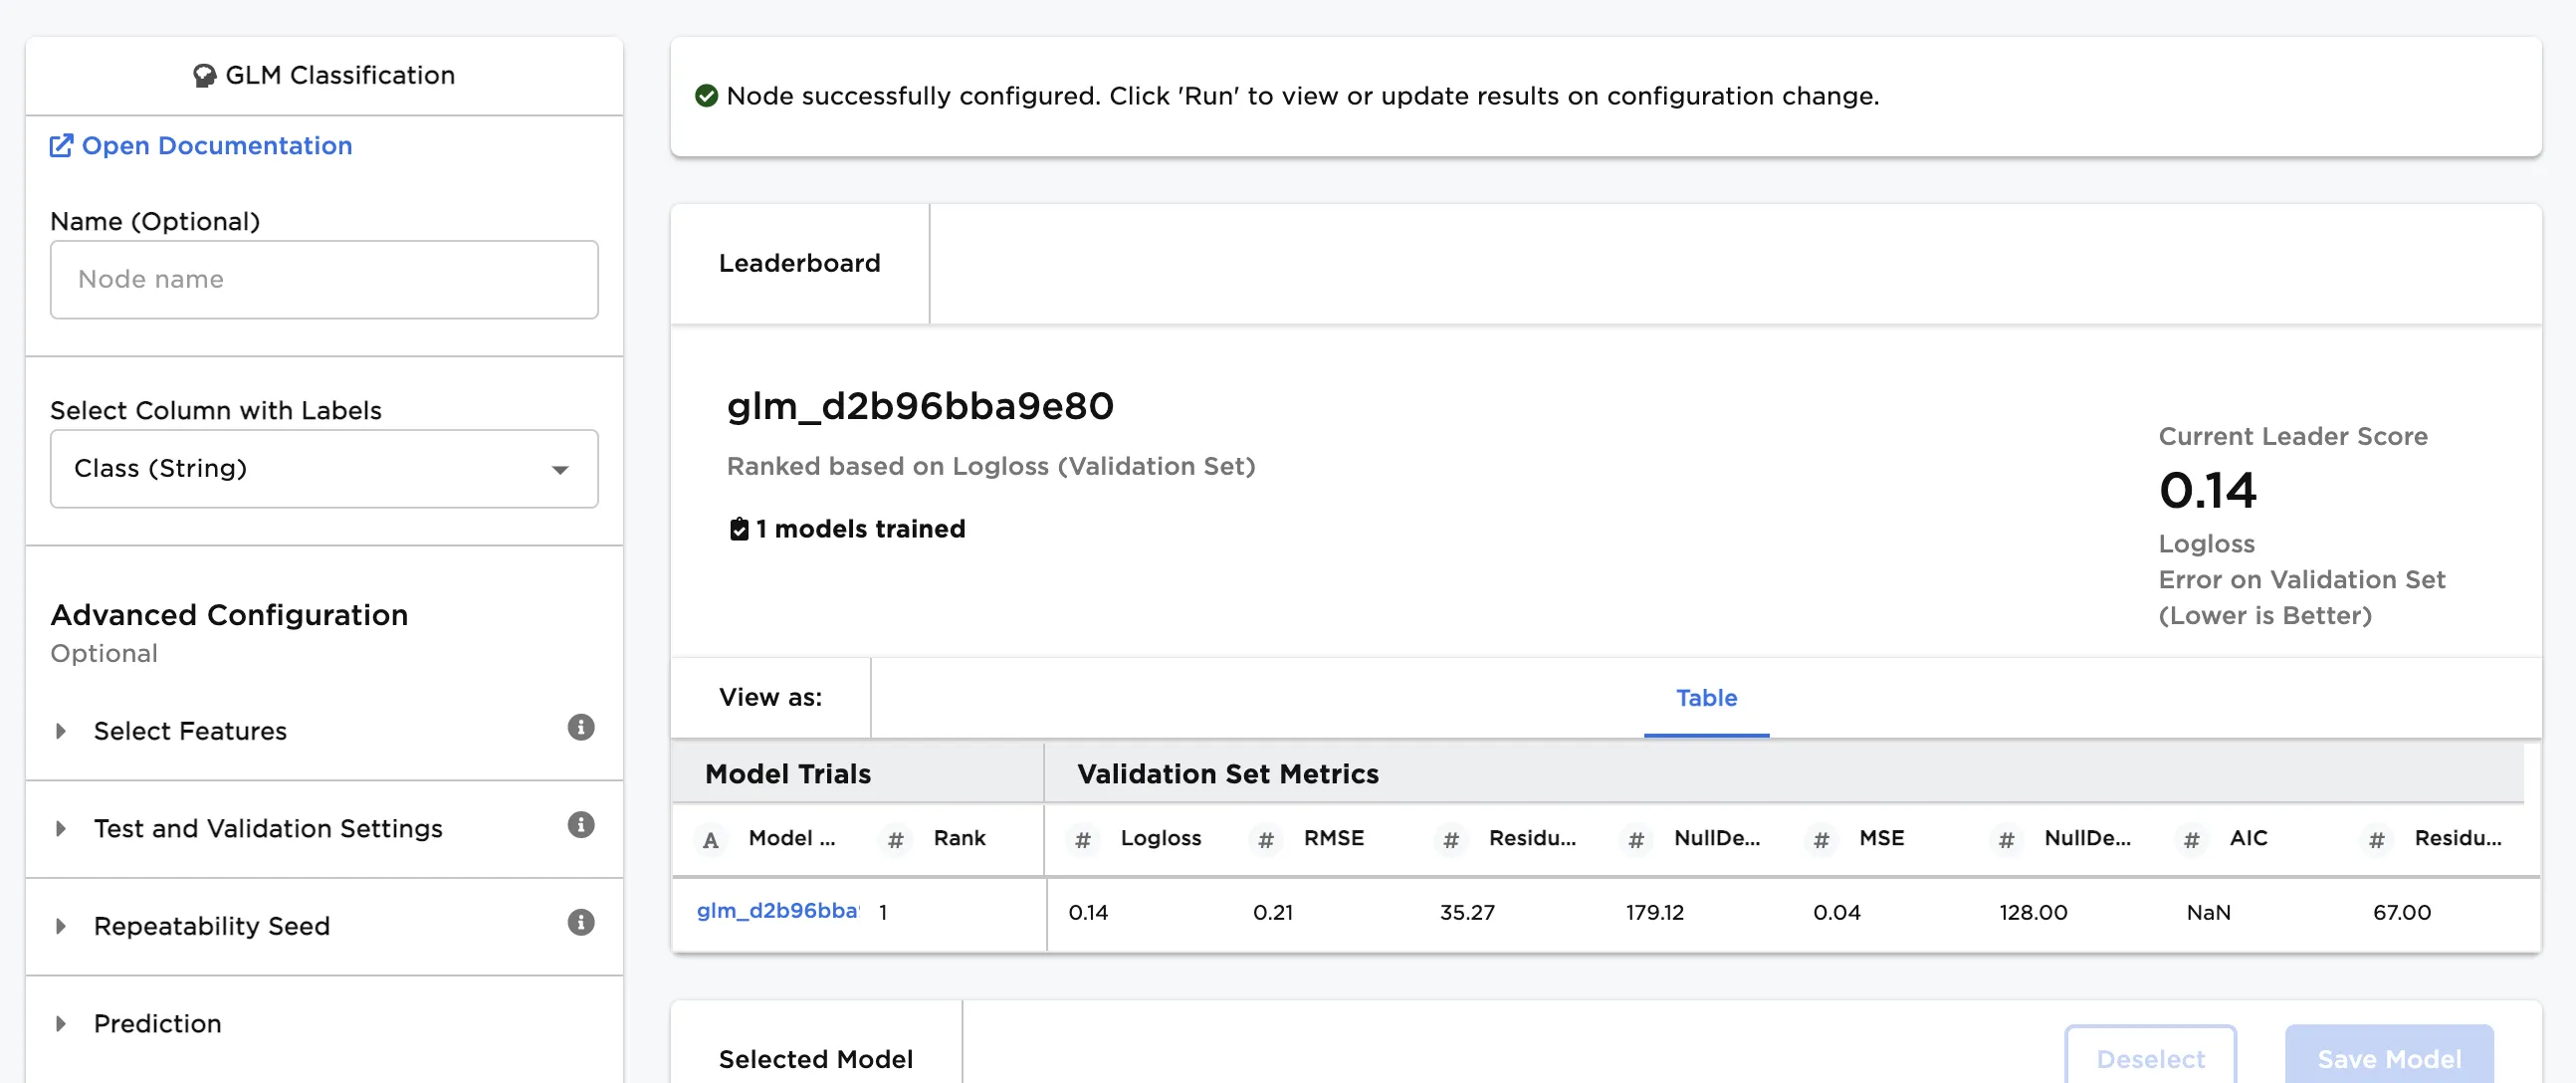
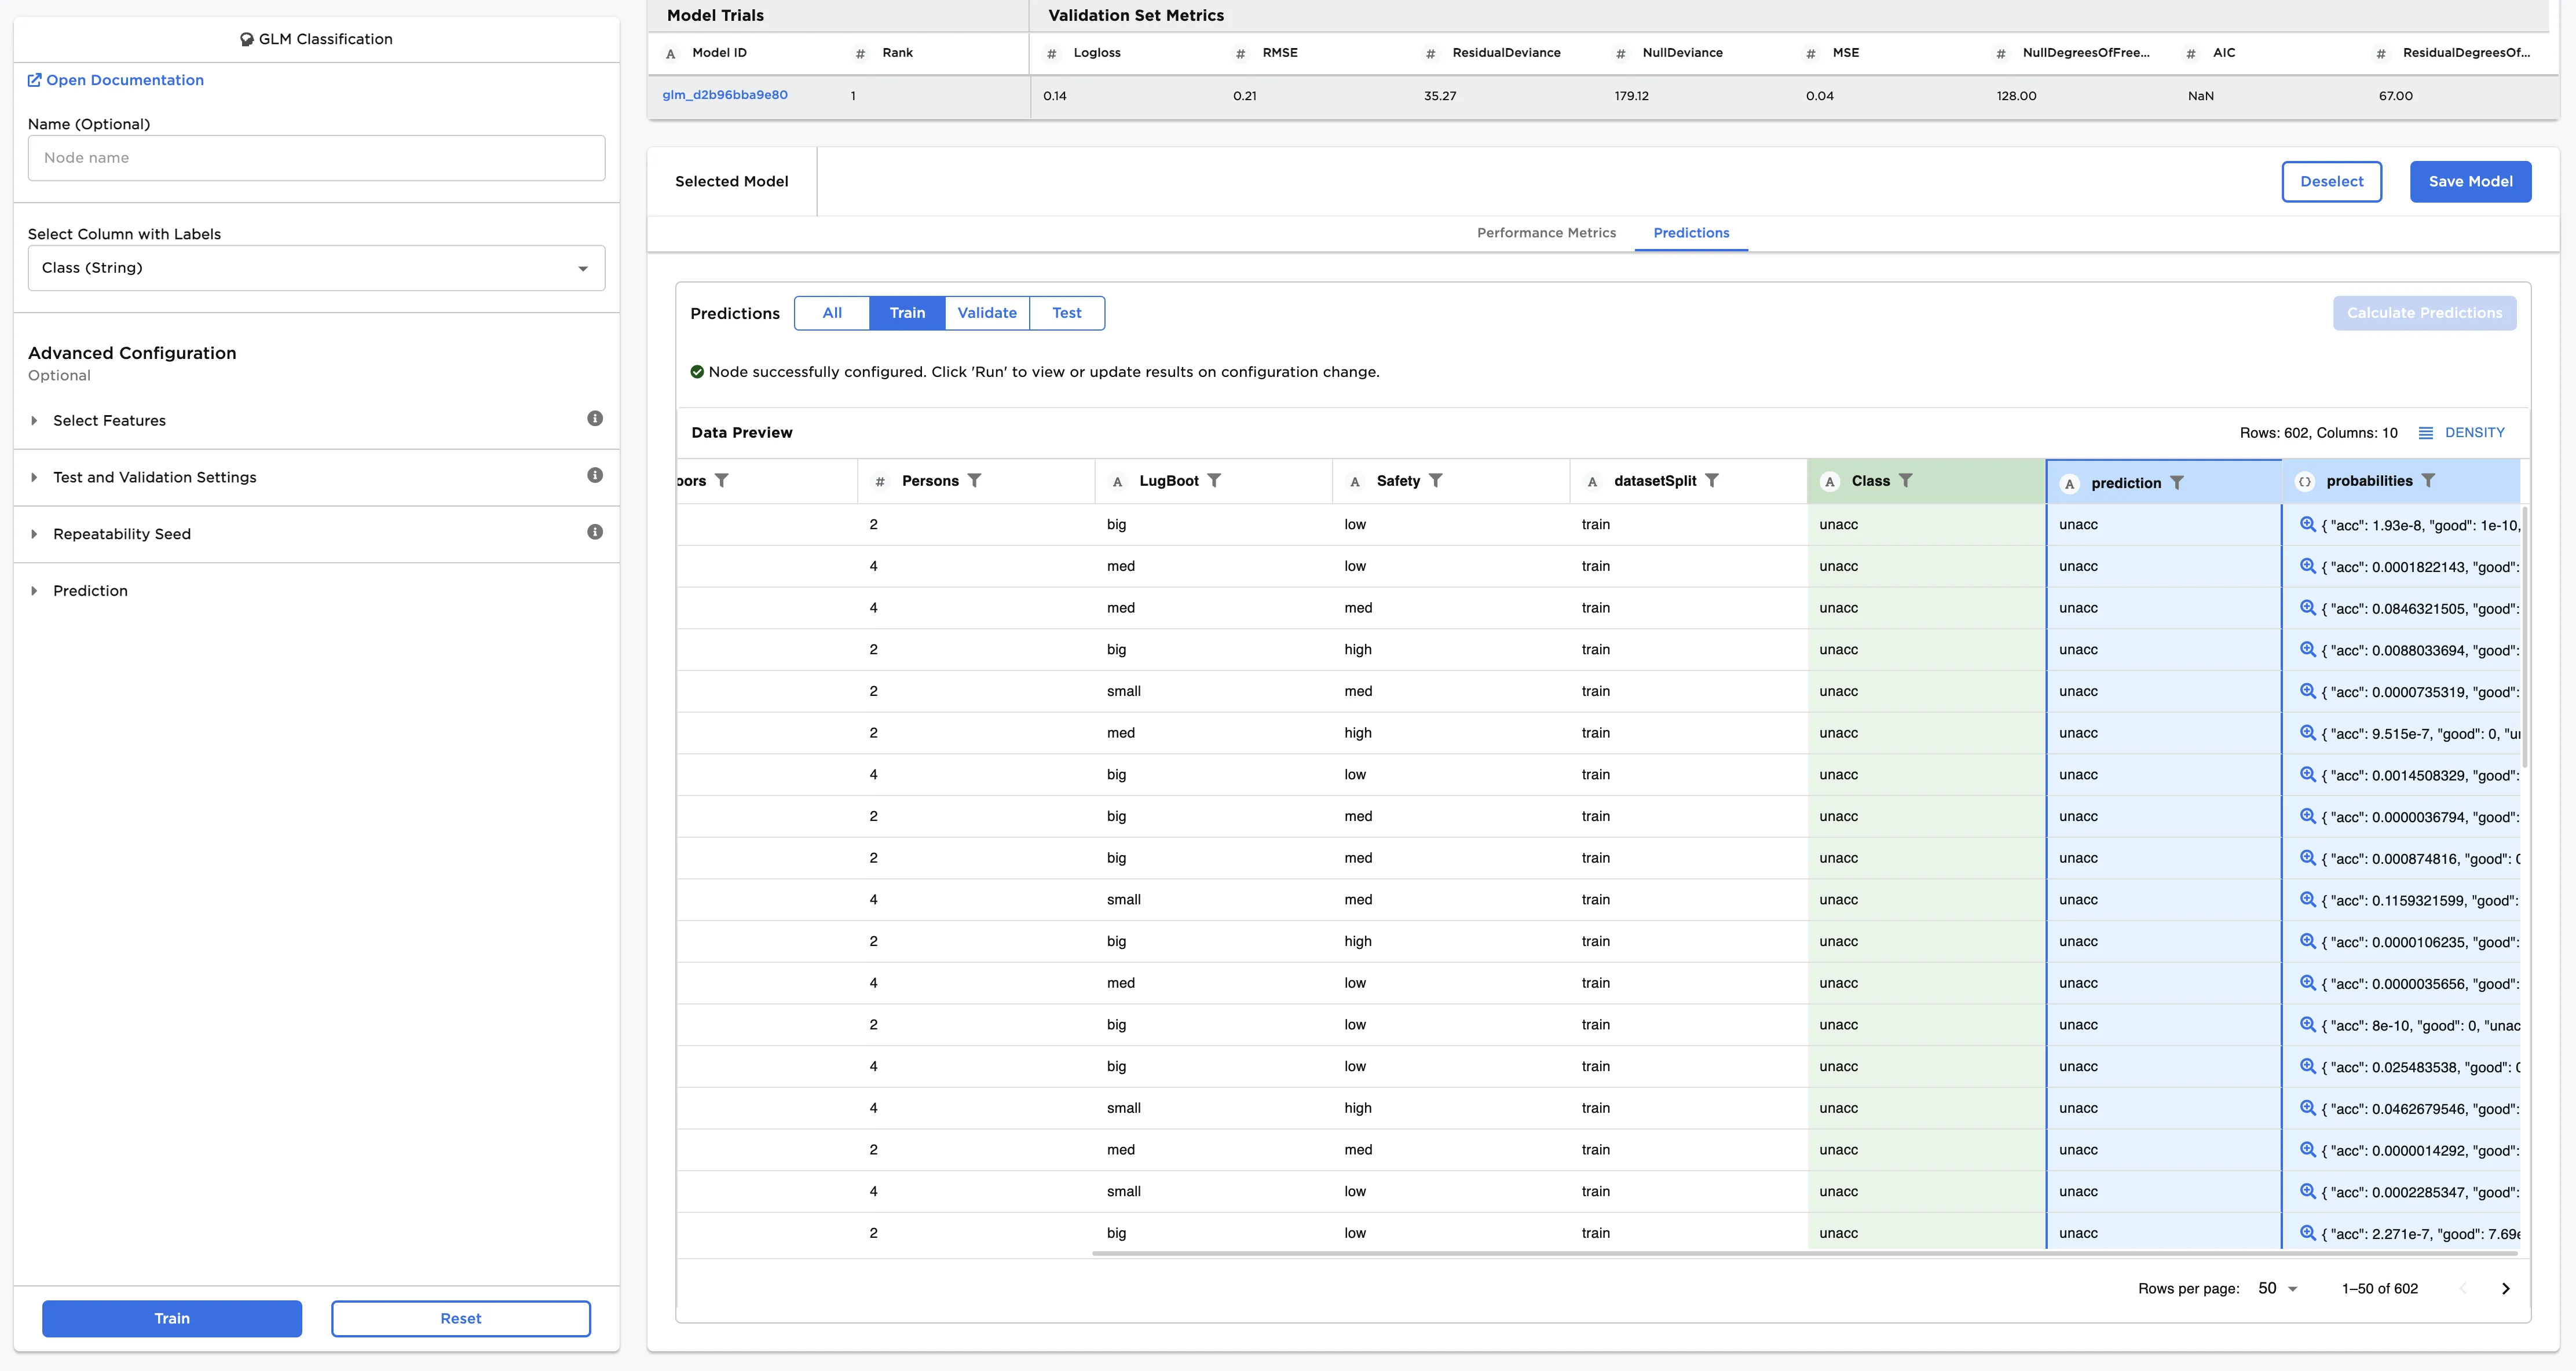
Figure 1: Example output
Examples
The dataframe shown in Figure 2 contains identifying characteristics of four classes of used car quality. This data is used to train a model that can identify the class of the car (unacceptable, acceptable, good, or very good) based on the given data. This is a classification problem because the data can be grouped into different categories based on a specified label column. To learn more about classification, see the C3 AI Glossary.
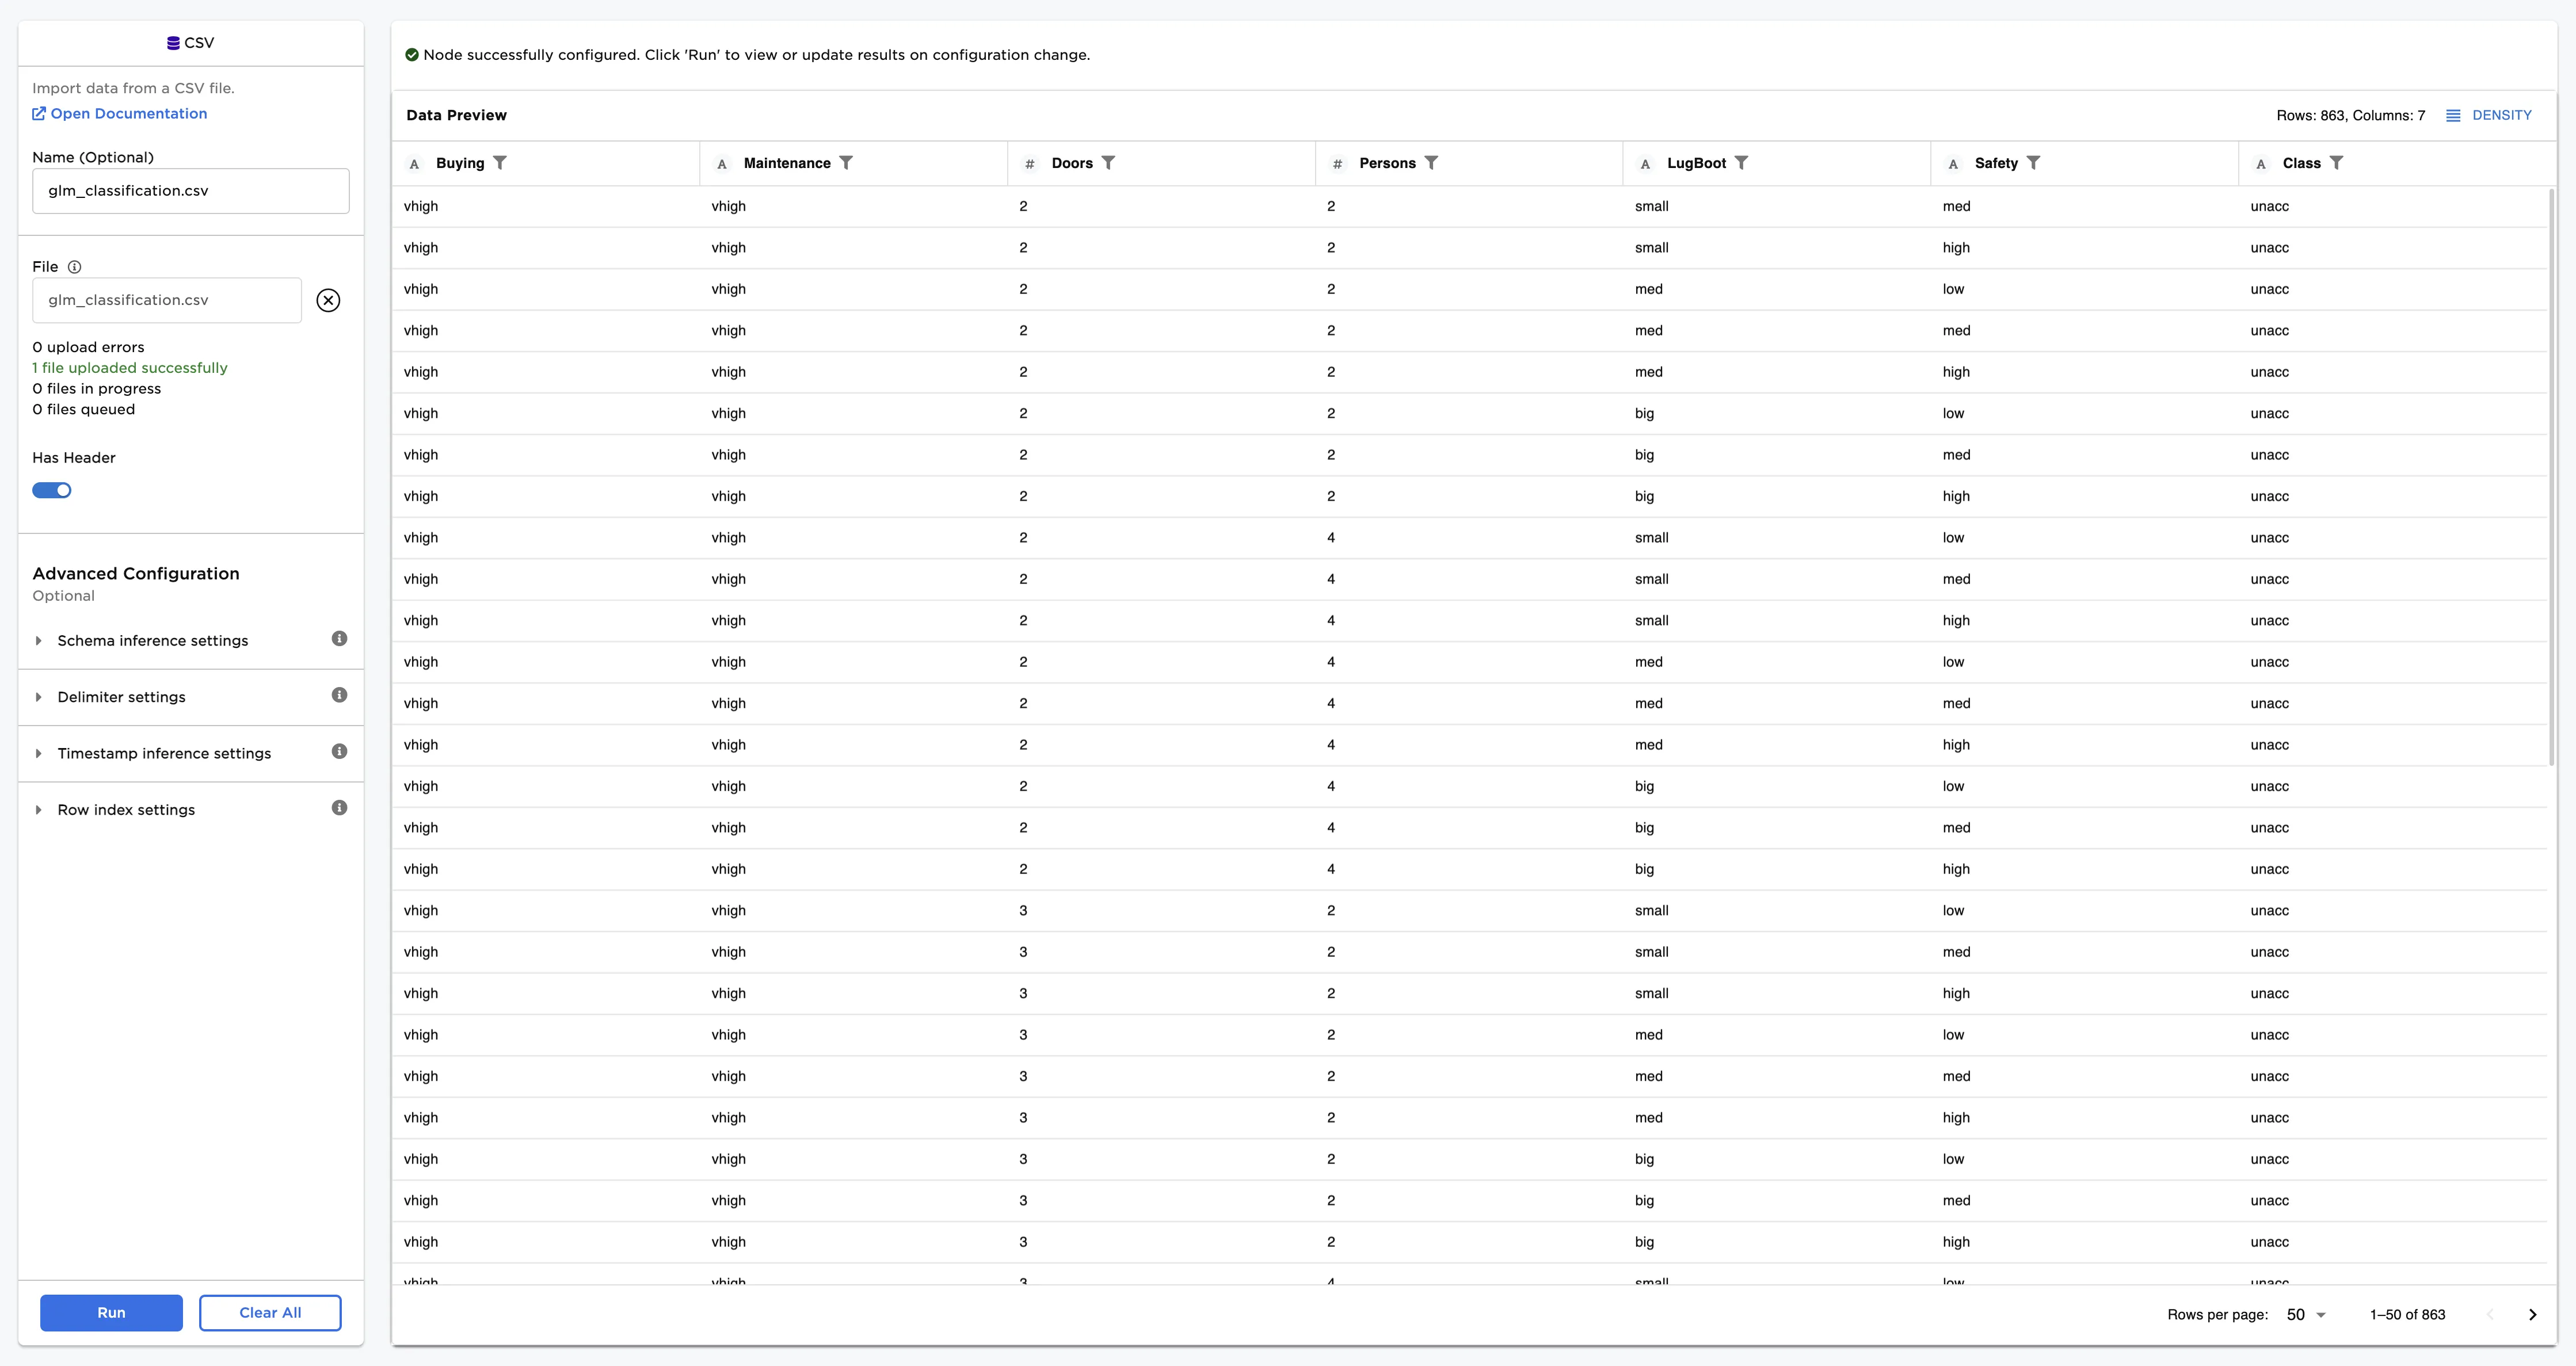
Figure 2: Example input data
Follow the steps below to train a model that can predict used car quality given the input data.
- Connect a GLM Classification node to an existing node.
- Select Class (String) for the Select Column with Labels field. The model predicts the values in this column after training.
- Select Train to train a model with the default settings.
Figure 3: Model leaderboard
Follow the steps below to learn more about the model on the leaderboard.
- Select a model, then scroll down to view information about the model and a bar chart with importance of each feature.
- Select Calculate Additional Details to view additional test metrics
The model selected in Figure 4 determined that a low safety rating is the most important characteristic when categorizing used car quality.
The confusion matrix shows the predicted labels vs. the true labels. The selected model correctly identifies 97% of unacceptable vehicles in the data. However, when met with an acceptable car, the selected model does seem to have a some trouble identifying it correctly as seen in the leftmost column of the confusion matrix. A confusion matrix with a diagonal row of "100%" values from the top left to the bottom right indicates that the model correctly classifies every training input correctly.
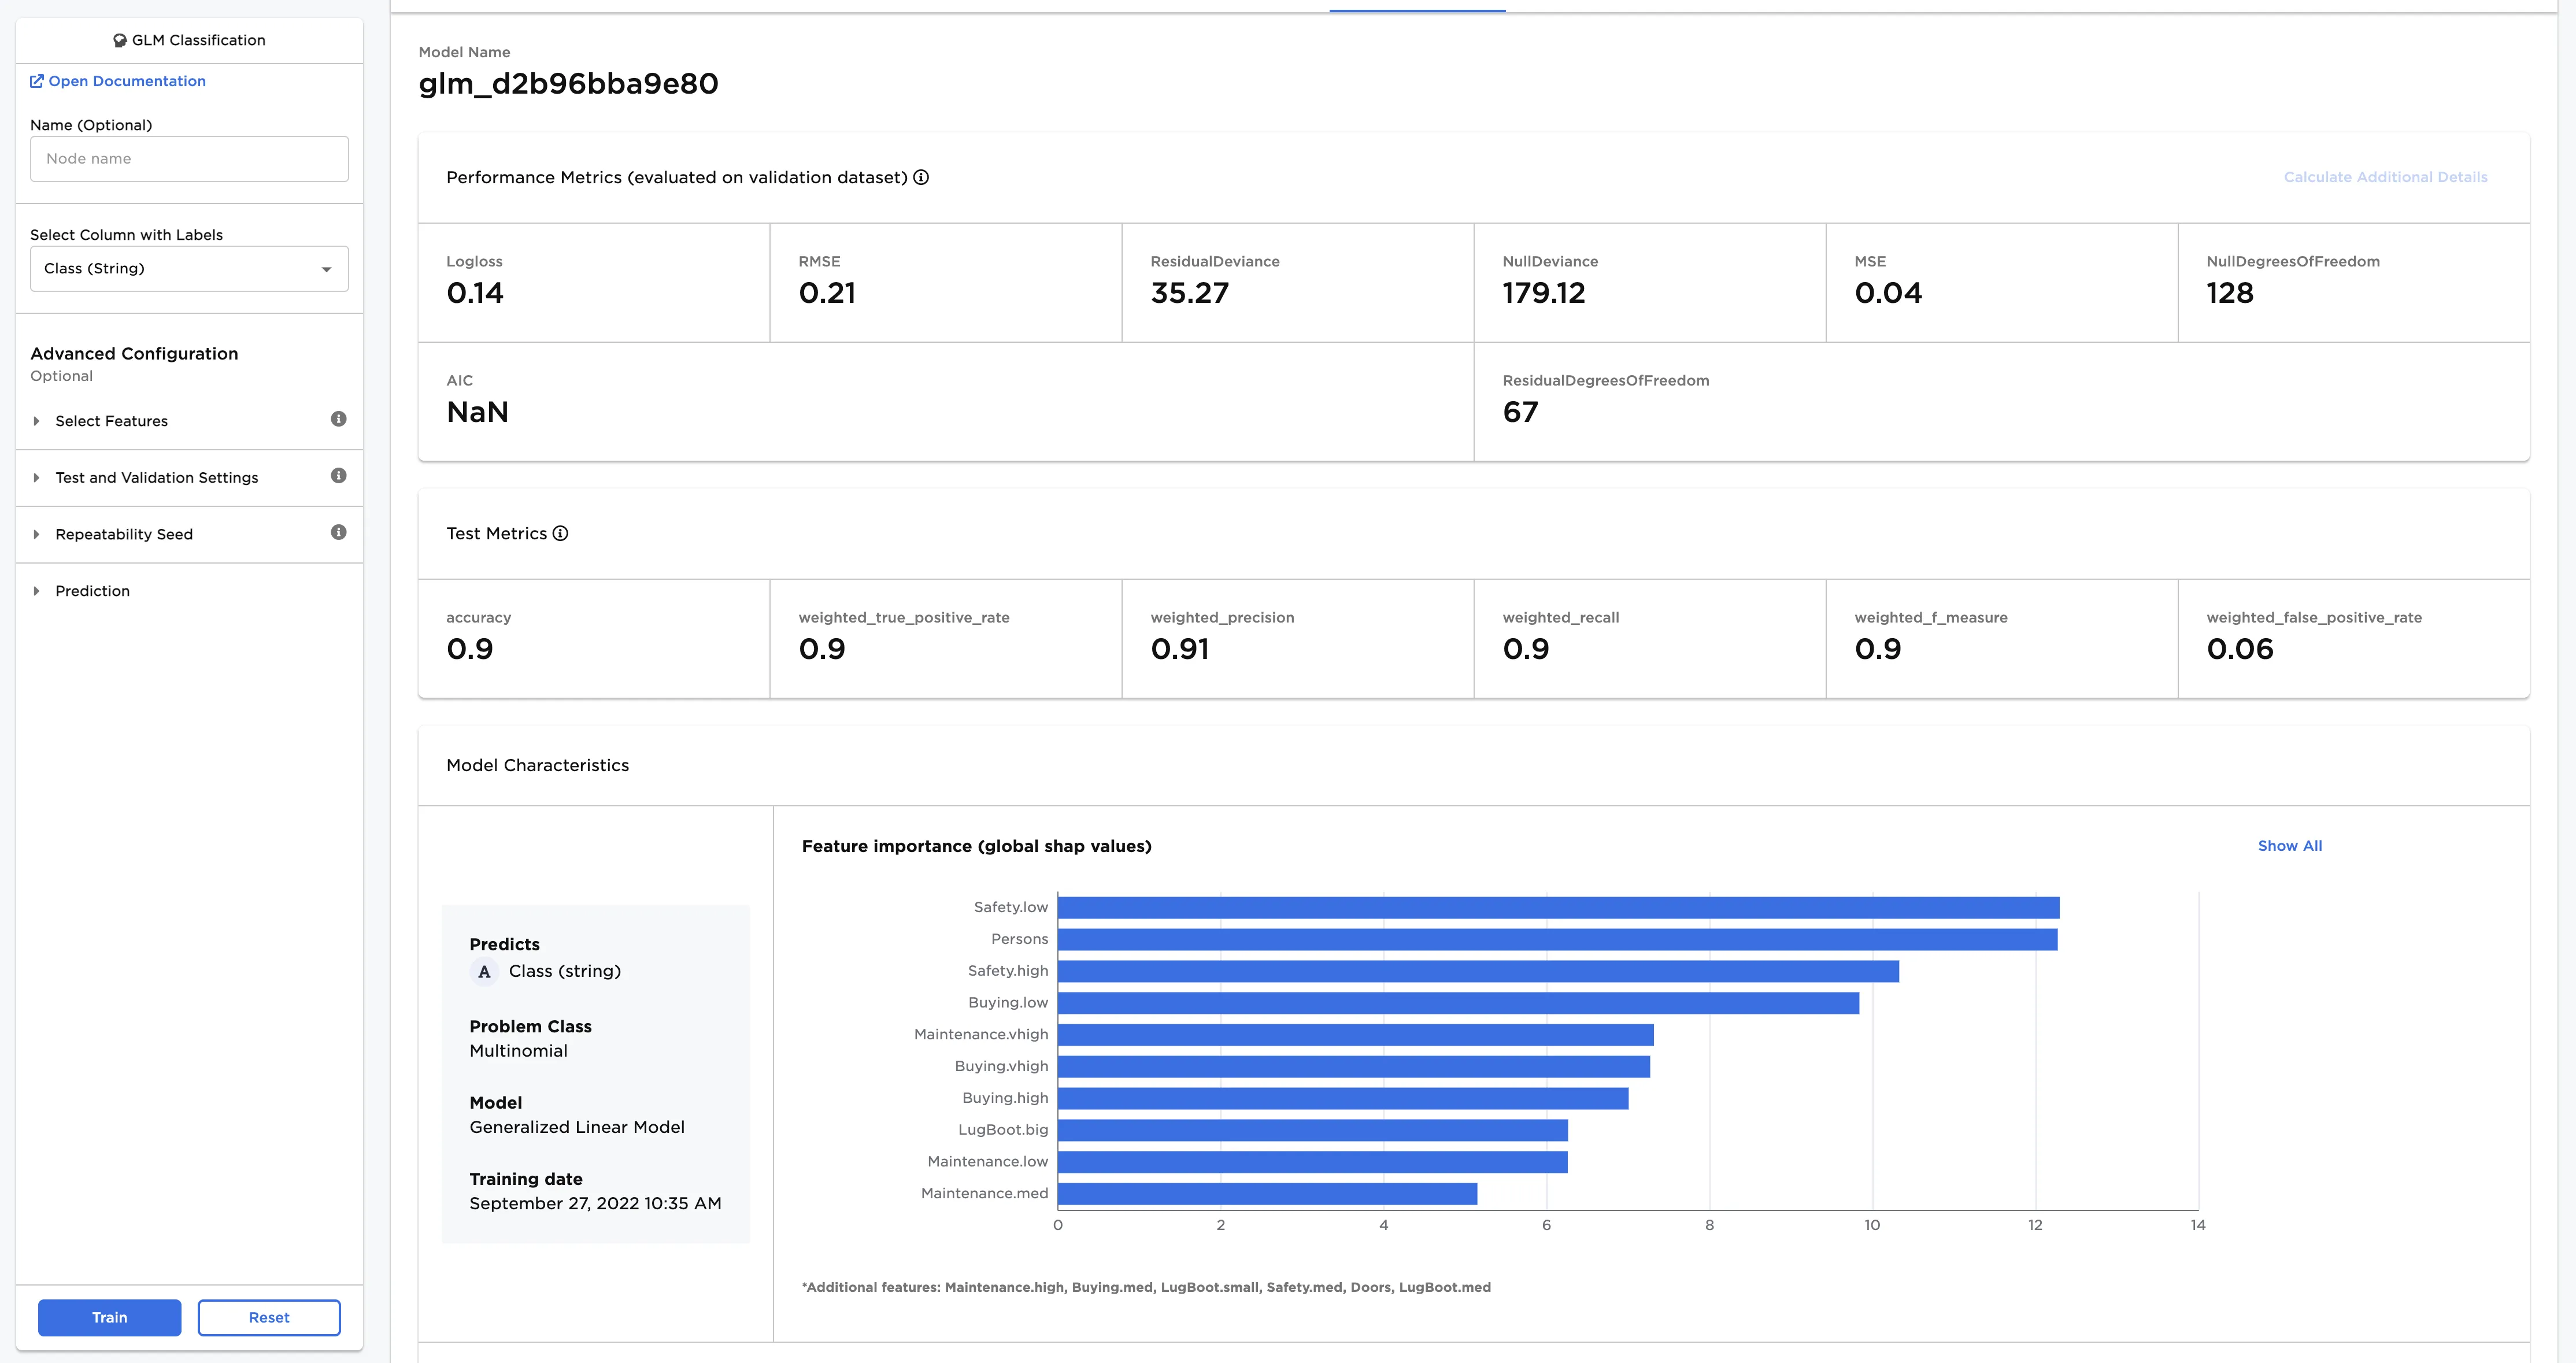
Figure 4: Model details
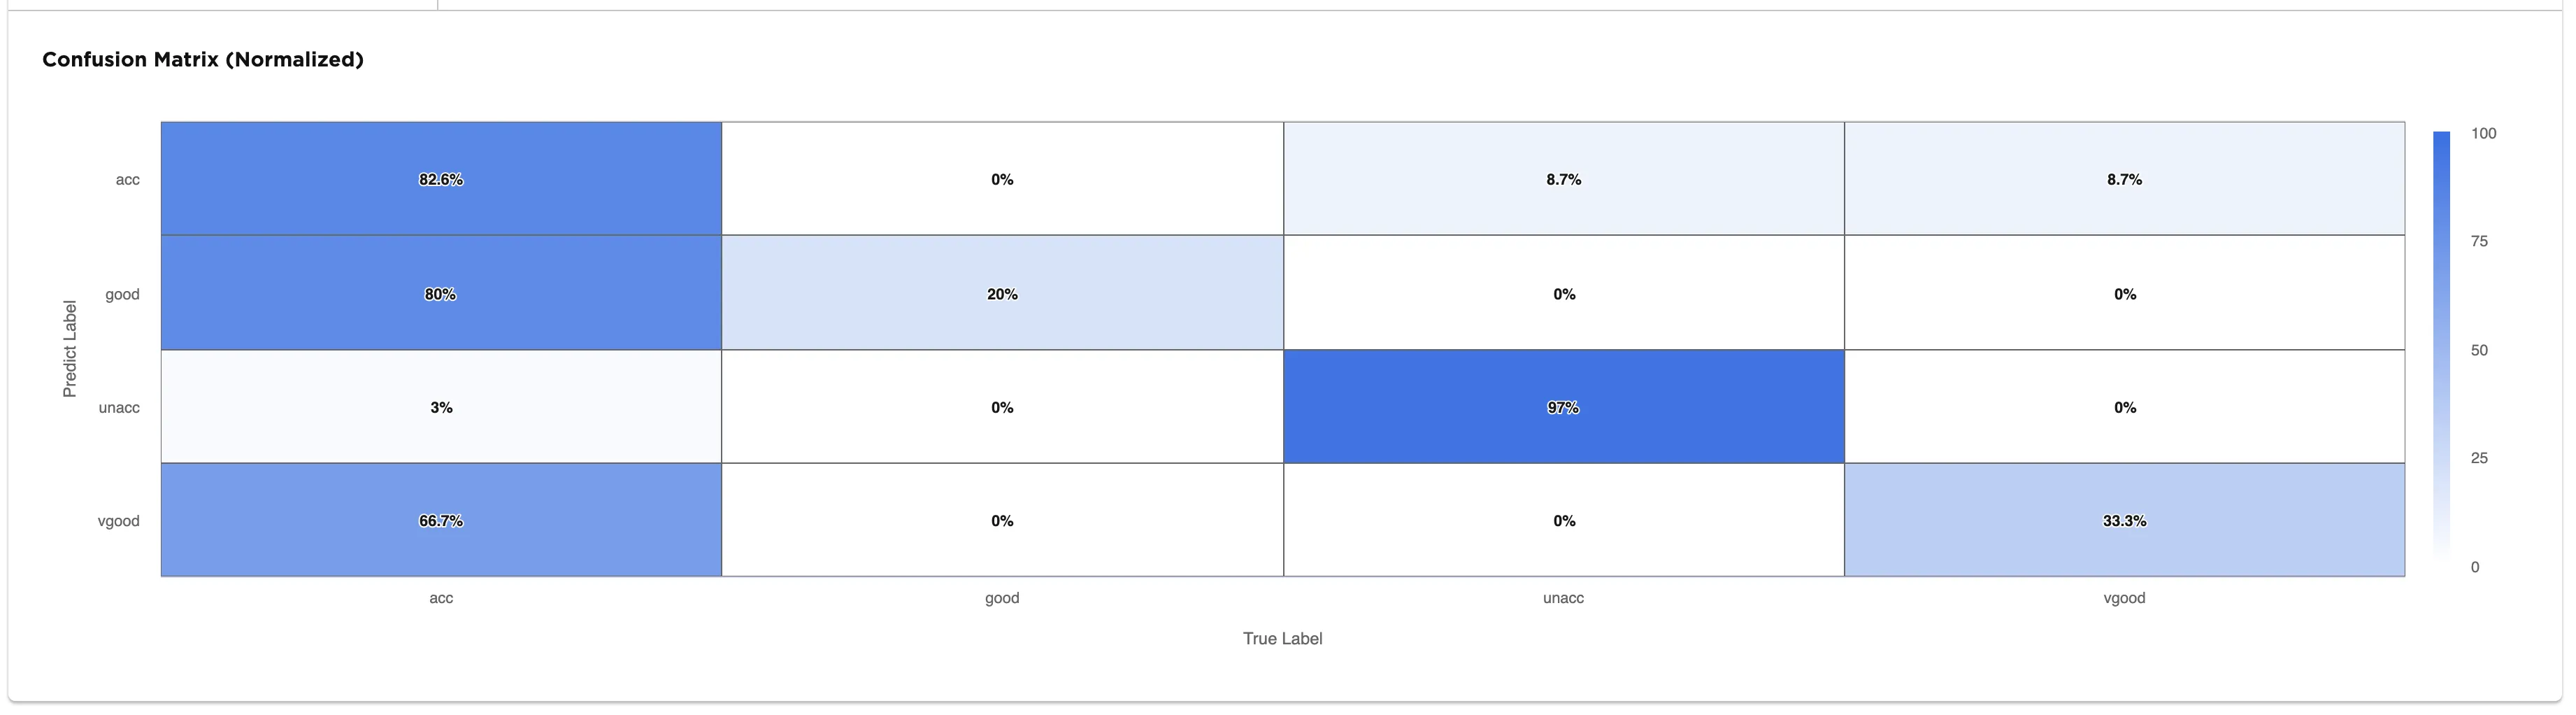
Figure 5: Confusion matrix
Follow the steps below to view the model's predictions.
- After you select a model, navigate to the Predictions tab.
- Select Calculate Predictions to view the selected model's predictions on the training data. The button appears dimmed after it has been selected.
If the model doesn't perform as well as you'd like it to, try altering the advanced configuration options and training new models.
Note that if your model correctly predicts all values, it might be overfit. In other words, the model may be too closely aligned to the training data that it is makes less accurate predictions on unseen data.