K Means
Train a K Means clustering model in Visual Notebooks.
Configuration
| Field | Description |
|---|---|
Name default=K Means | A user-specified node name displayed in the workspace |
Select Feature Columns default=Select all columns as features | Features to train the model with |
| Use all columns as features, or select specific columns using the auto-populated dropdown menu. Columns selected as features should be numerical and continuous. Do not use categorical data. |
Feature Scaling
K Means uses the distance between points to cluster data. If the distance between different features is not accurately represented, the algorithm may find patterns that don't actually exist. This field adjusts the data so all features are on the same scale. This is particularly useful for columns that use different units of measurement. For more information about scaling, see the Standard Scaler node.
| Field | Description |
|---|---|
Standard scale numeric columns default=On | Scale data to the standard deviation and center around zero |
| Leave this toggle switch on to scale numeric features. Toggle this switch off to leave the data as-is. |
Validation Settings
A K Means model attempts to find previously unidentified patterns in data. Since the results are unknown before training, there isn't a way to validate the model's predictions.
Additional test and validation methods will be implemented at a later date. When that occurs, use this field to determine whether the model is consistent when given additional data.
| Field | Description |
|---|---|
Select test and validation method default=No Validation | Validation method |
| Additional test and validation methods are coming soon. |
Hyperparameters Search
By default, Visual Notebooks trains many models with different hyperparameter configurations, then ranks the models by performance. The fields in this section determine the hyperparameter options used during training. Although you don't need to alter these fields to train a high-performing model, it is possible to explore different combinations.
Hyperparameters give you precise control over a model. Use these fields to tell the model how many clusters to make, the approach to use when finding initial clusters, and when to stop iterating during training.
| Field | Description |
|---|---|
Hyperparameters Search default=Search | Train one model or multiple models |
| Select Search to train multiple models with different hyperparameter combinations and then compare the models to find the best one. Select Fixed to train a single model with a fixed hyperparameter configuration. | |
Search number of clusters -k default=2, 3, 4, 5 | The number of clusters to create |
| Enter an integer between 1 and the total number of rows in your data. If Search is selected in the Hyperparameters Search field, Visual Notebooks creates multiple models, each with one of the desired cluster counts. If Define Fixed is selected in the Hyperparameters Search field and the selected approach is Custom, Visual Notebooks creates a single model with the number of clusters specified in this field. The default number of clusters for a single model is 10. | |
Initialization Mode for Finding Initial Cluster Centers default=Furthest | Strategy for initially finding clusters |
| Select Furthest, Kmeans++, or Random. The center of the first cluster is always selected at random. These options determine how to find cluster centers after the initial cluster. Select the next cluster center because it is the farthest away from the initial center, select the next cluster center using a weighted probability algorithm, or select all cluster centers at random. | |
Maximum Iterations per Model default=100 | When to stop improving the model |
| The K means algorithm continues to iterate on cluster center location until points no longer move between clusters. A maximum of 100 iterations is typically sufficient to find the best cluster center. For larger datasets, increase this value to 1000. | |
Approach default=Automatic | Number of clusters for a single model |
| Select Automatic to let Visual Notebooks estimate the optimal number of clusters. Select Custom to specify the desired number of clusters. | |
Maximum Allowable Clusters (kmax) default=10 | Maximum number of clusters |
| If Define Fixed and Automatic are selected in the Hyperparameters Search and Approach fields, enter the maximum amount of clusters Visual Notebooks can create for the single trained model. |
Initialization Seed
Random numbers are used throughout the training process for splitting the original dataset, splitting individual trees, and optimizing hyperparameters. Ex Machina uses one number, called a seed, to generate those random numbers. The field in this section allows you to enter a custom seed. If you enter a custom seed, you can enter that same custom seed at a later date to reproduce the results of the training.
| Field | Description |
|---|---|
Seed default=Random | The number used throughout the AutoML process |
| Select Random to use a random number, or select Custom to enter a specific integer. The seed is used to generate numbers used throughout the AutoML process. If you enter a custom seed, you can enter the same custom seed at a later date to get the same results. |
Prediction
The output of this node is each model's predictions on the training data. This section determines how the predictions are portrayed in the resulting dataframe.
| Field | Description |
|---|---|
| modelId default=none | Selected model's name |
| This auto-populated field displays the selected model's name. | |
Prediction Column Name default=prediction | The column name for the model's predictions |
| Enter a name for the column that contains the selected model's predictions. Column names can contain alphanumeric characters and underscores, but cannot contain spaces. | |
Add column with probabilistic output scores default=On | Model prediction probabilities |
| Leave this switch on to create a column with the model's confidence in each prediction. Toggle this switch off to create a dataframe without this column. | |
Dataset Selection default=Train Dataset | Data used to display a model's predictions |
| Select train dataset. Visual Notebooks displays a selected model's predictions on the dataset selected with this field. |
Node Inputs/Outputs
| Input | A Visual Notebooks dataframe |
|---|---|
| Output | A dataframe with predictions on the training data |
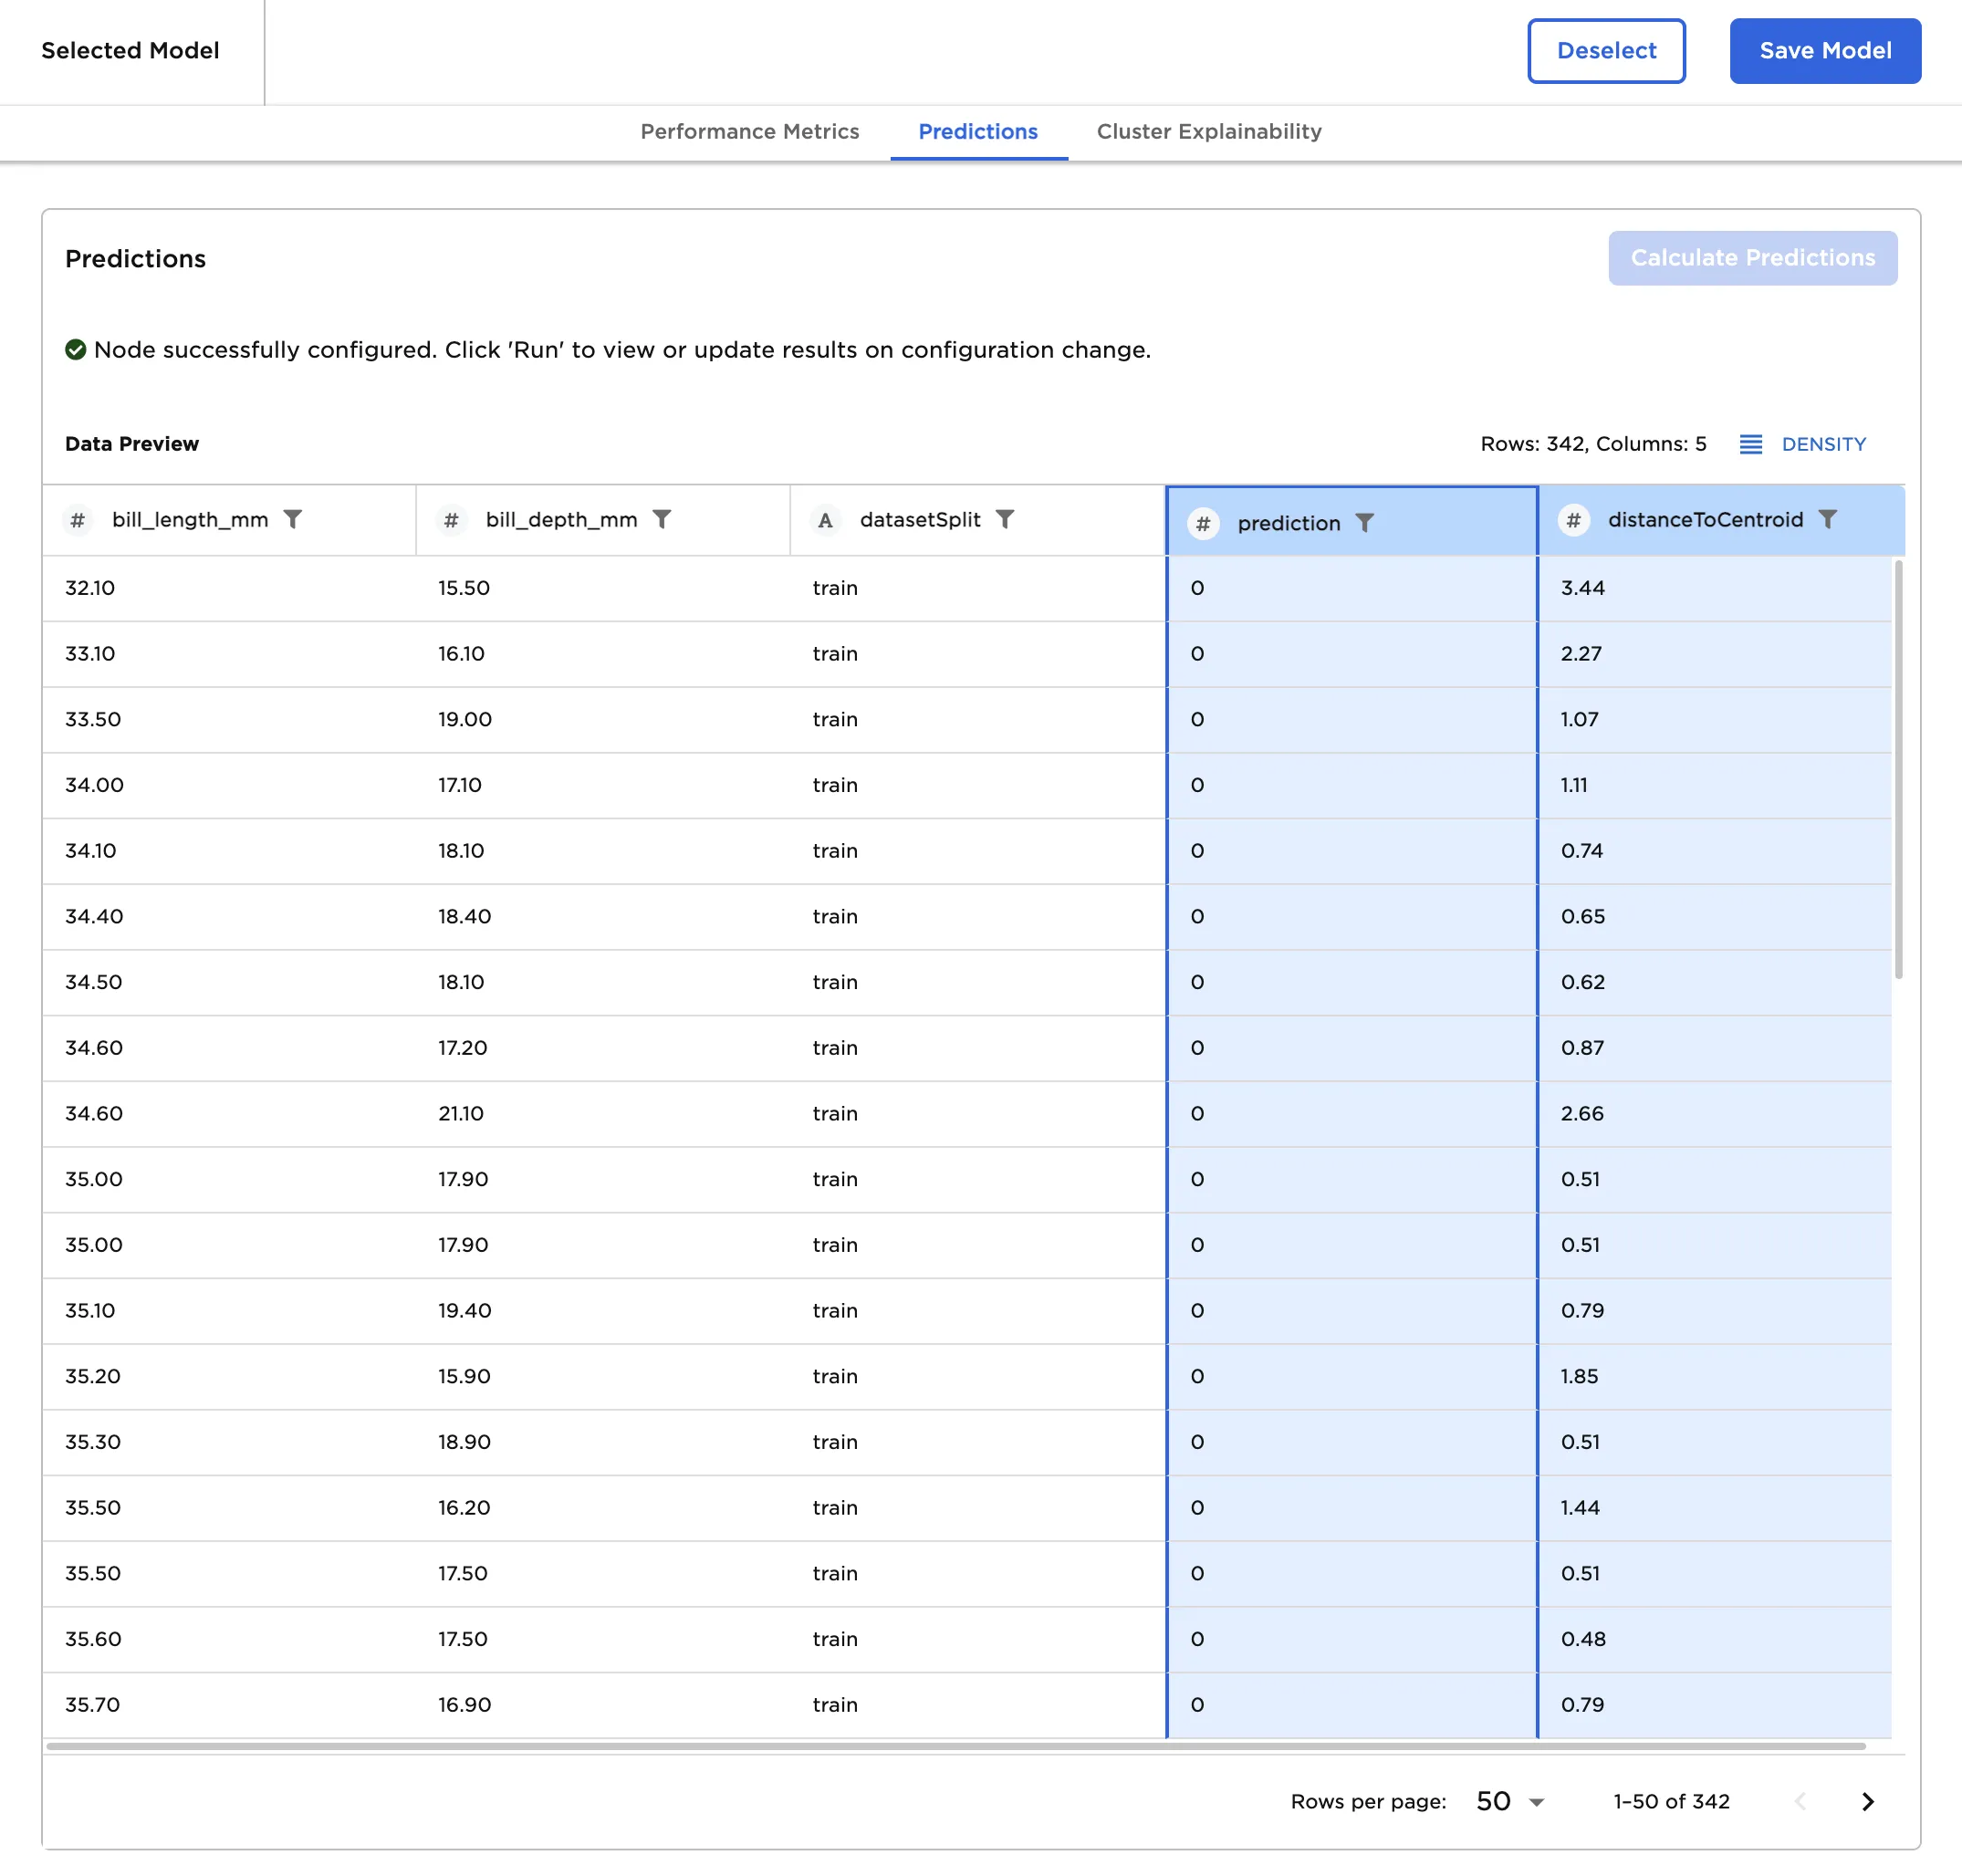
Figure 1: Example output
Examples
The dataframe in Figure 2 is used in this example. It contains the bill depth and bill length of over 300 penguins.
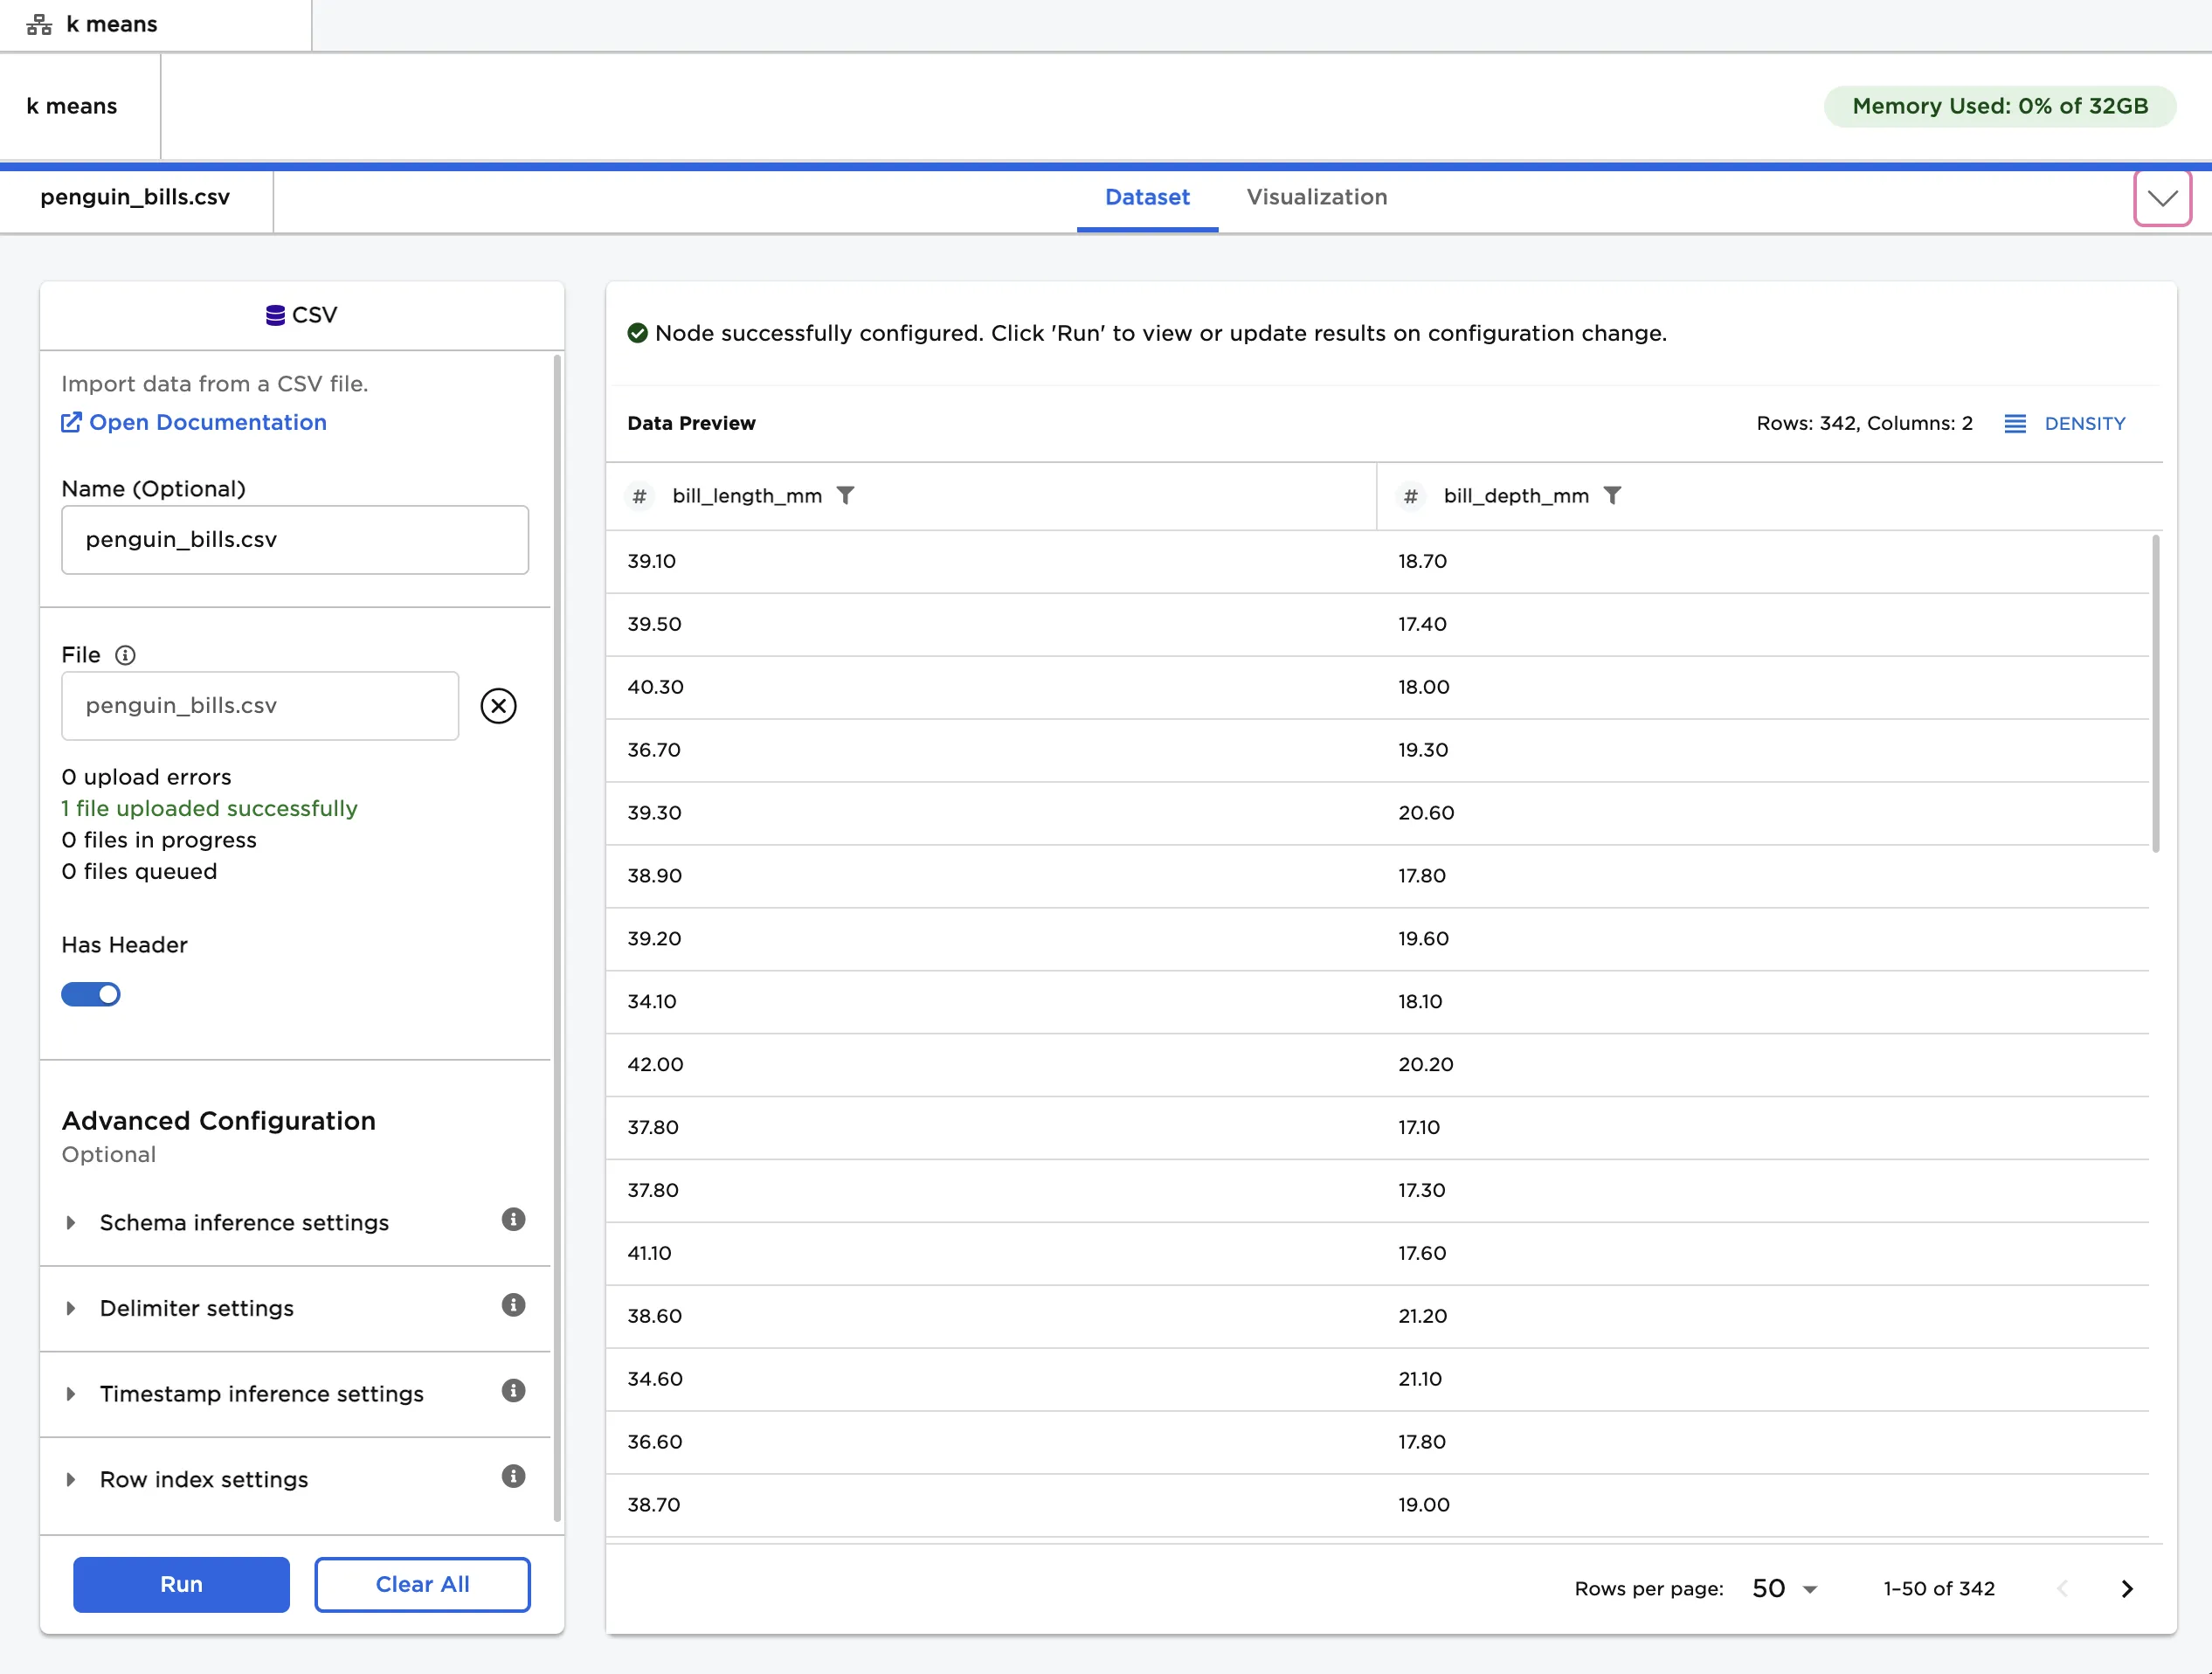
Figure 2: Example input data
Use a K Means node to group the data shown in Figure 2 into clusters.
- Connect a K Means node to an existing node.
- Select Train to train a model with the default settings.
Notice that Visual Notebooks trains multiple models, each with a different number of clusters. All trained models are displayed on a leaderboard and ranked by the total within cluster sum of square error. Total within cluster sum of square error is the distance between each point and the center of the cluster it belongs to. The model with the most clusters typically has the lowest total within cluster sum of square error and appears first on the leaderboard.
The total between cluster sum of square error is also represented on the leaderboard. This metric measures the distance between one cluster center to the other cluster centers. For models with the same number of clusters, a higher number for this metric indicates a better model.
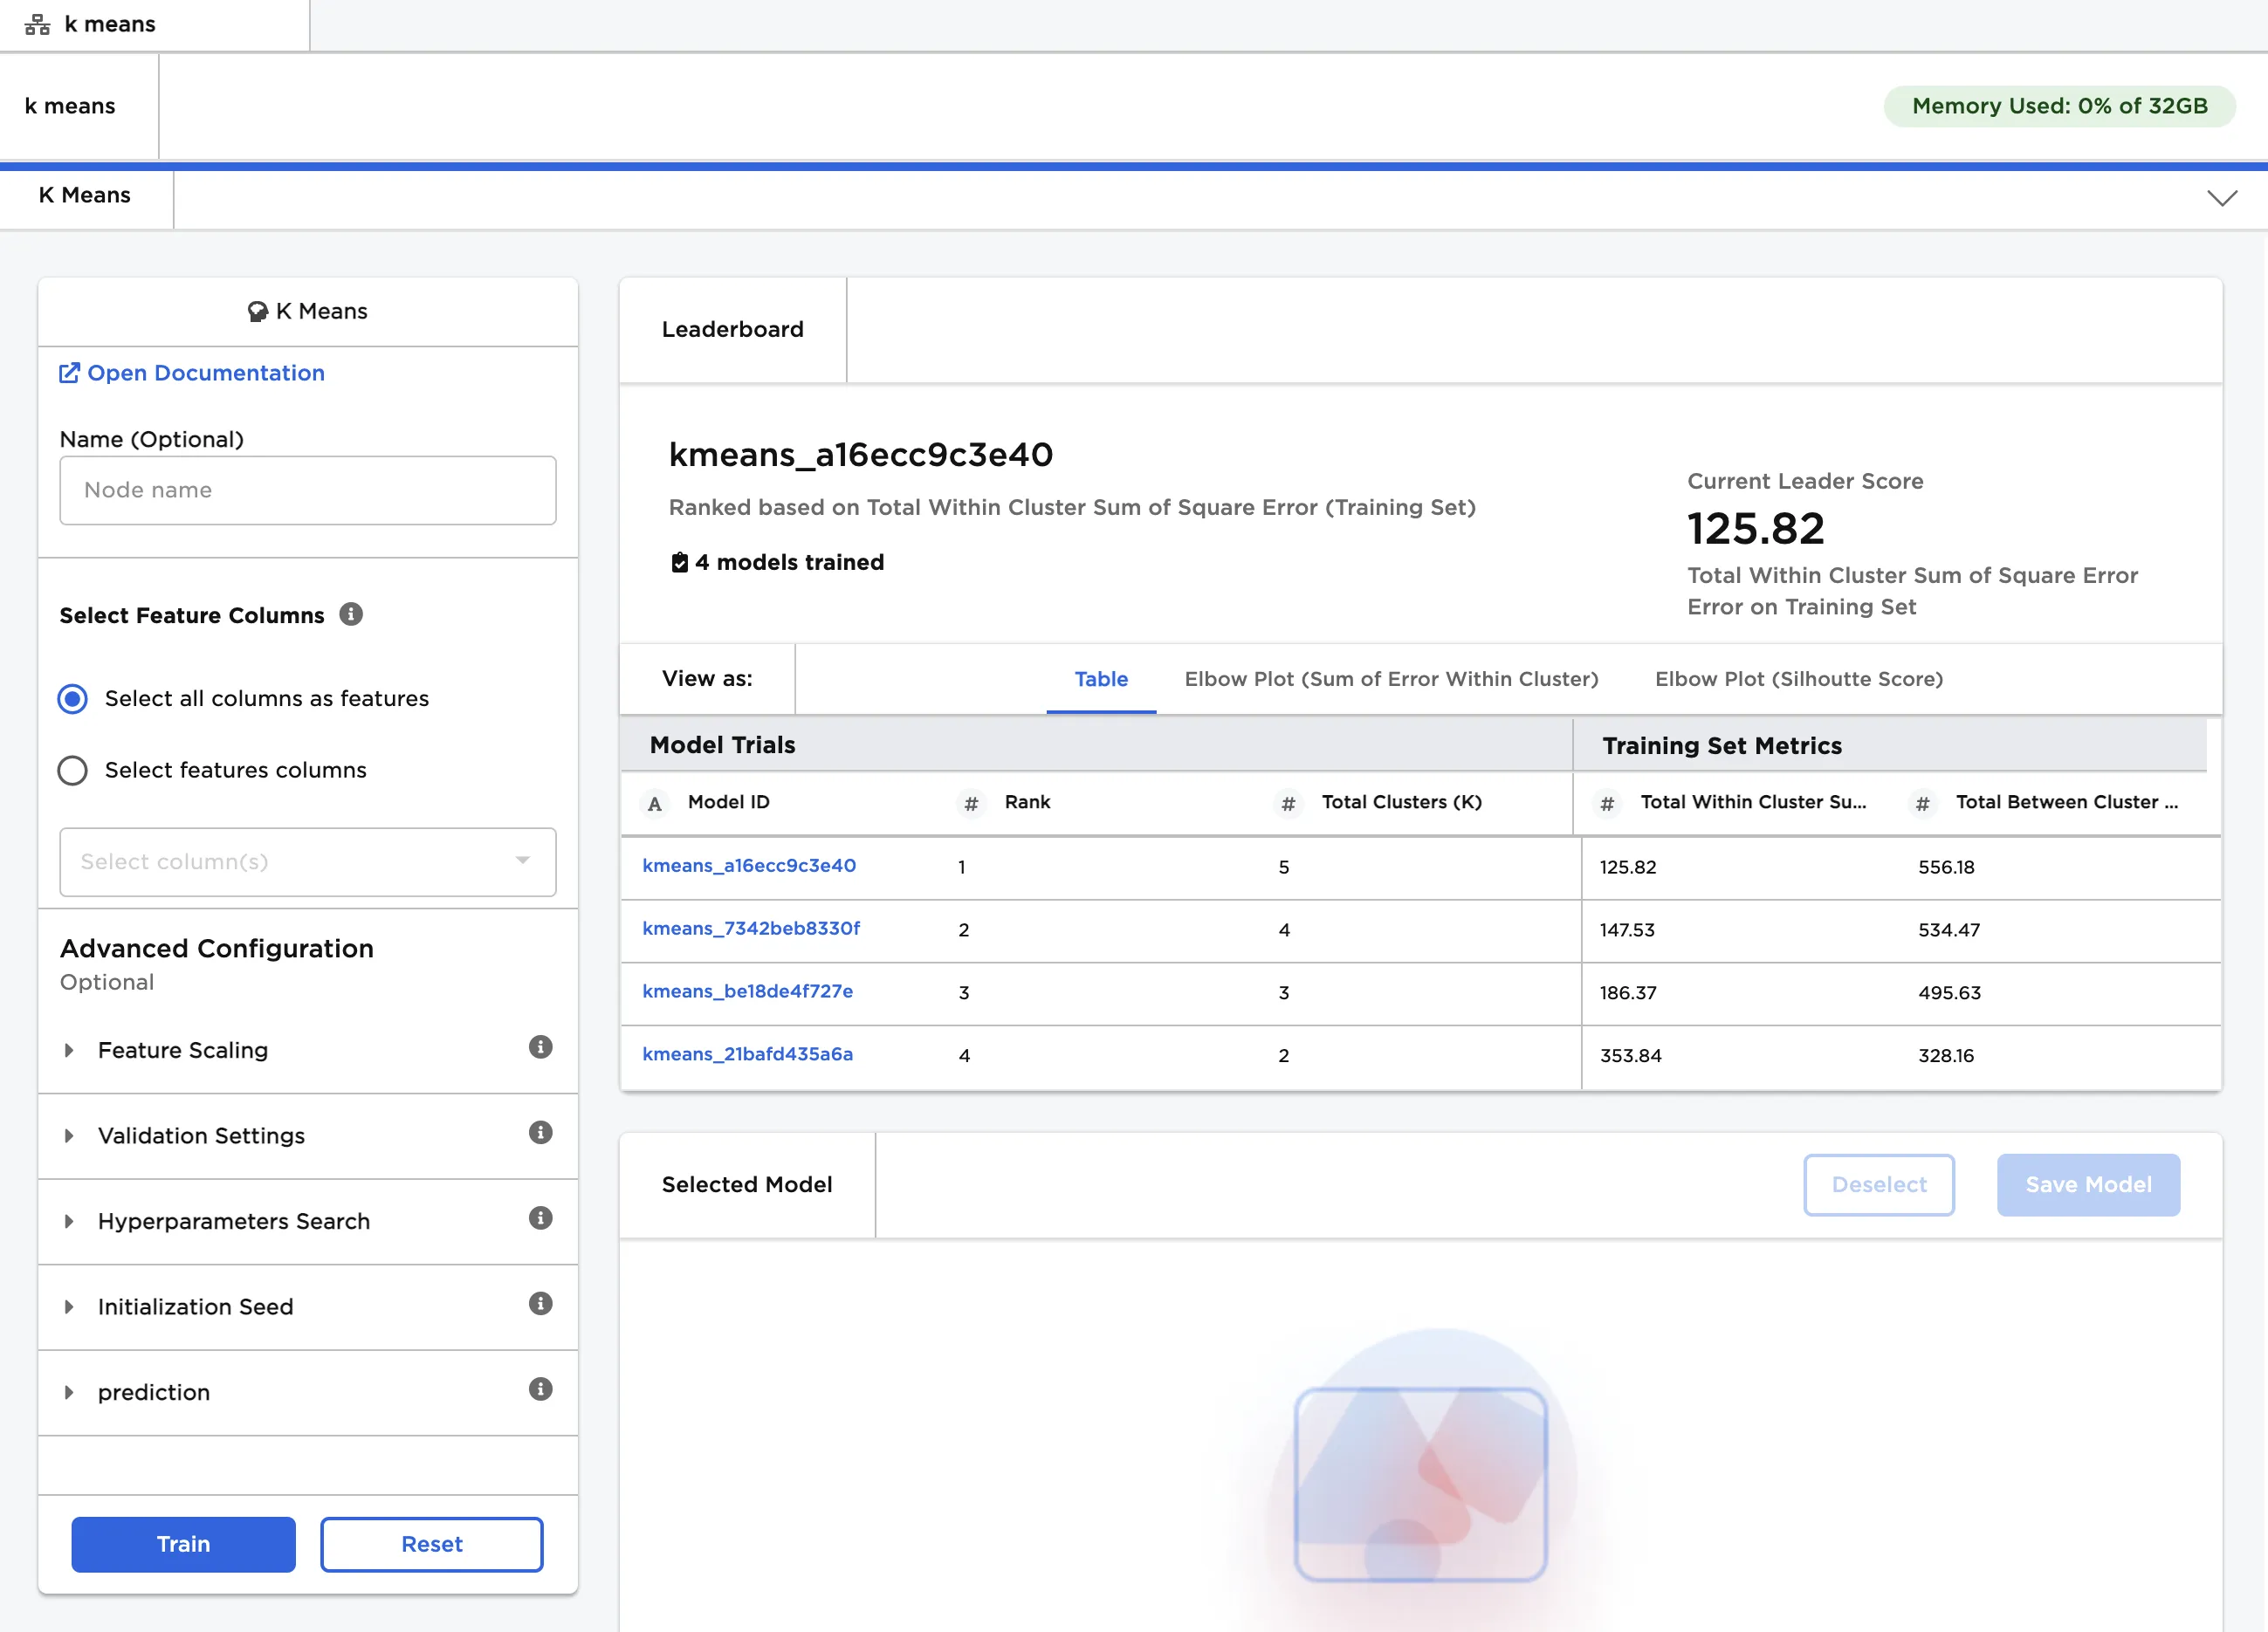
Figure 3: Model leaderboard
When comparing models with different numbers of clusters, the performance metrics on the leaderboard might not suggest the best model. It is also useful to consider the data displayed in the two elbow plots.
The first plot displays the same metric that appears on the leaderboard, total within cluster sum of square error, but provides additional insights. When looking at this plot, the optimal number of clusters is the value that appears at the "elbow" of the plot---the point where the slope of the line changes most sharply. If the elbow is not clear or the plot looks like a straight line, you may need to change the input features. In Figure 4, the elbow is the model with 3 clusters.
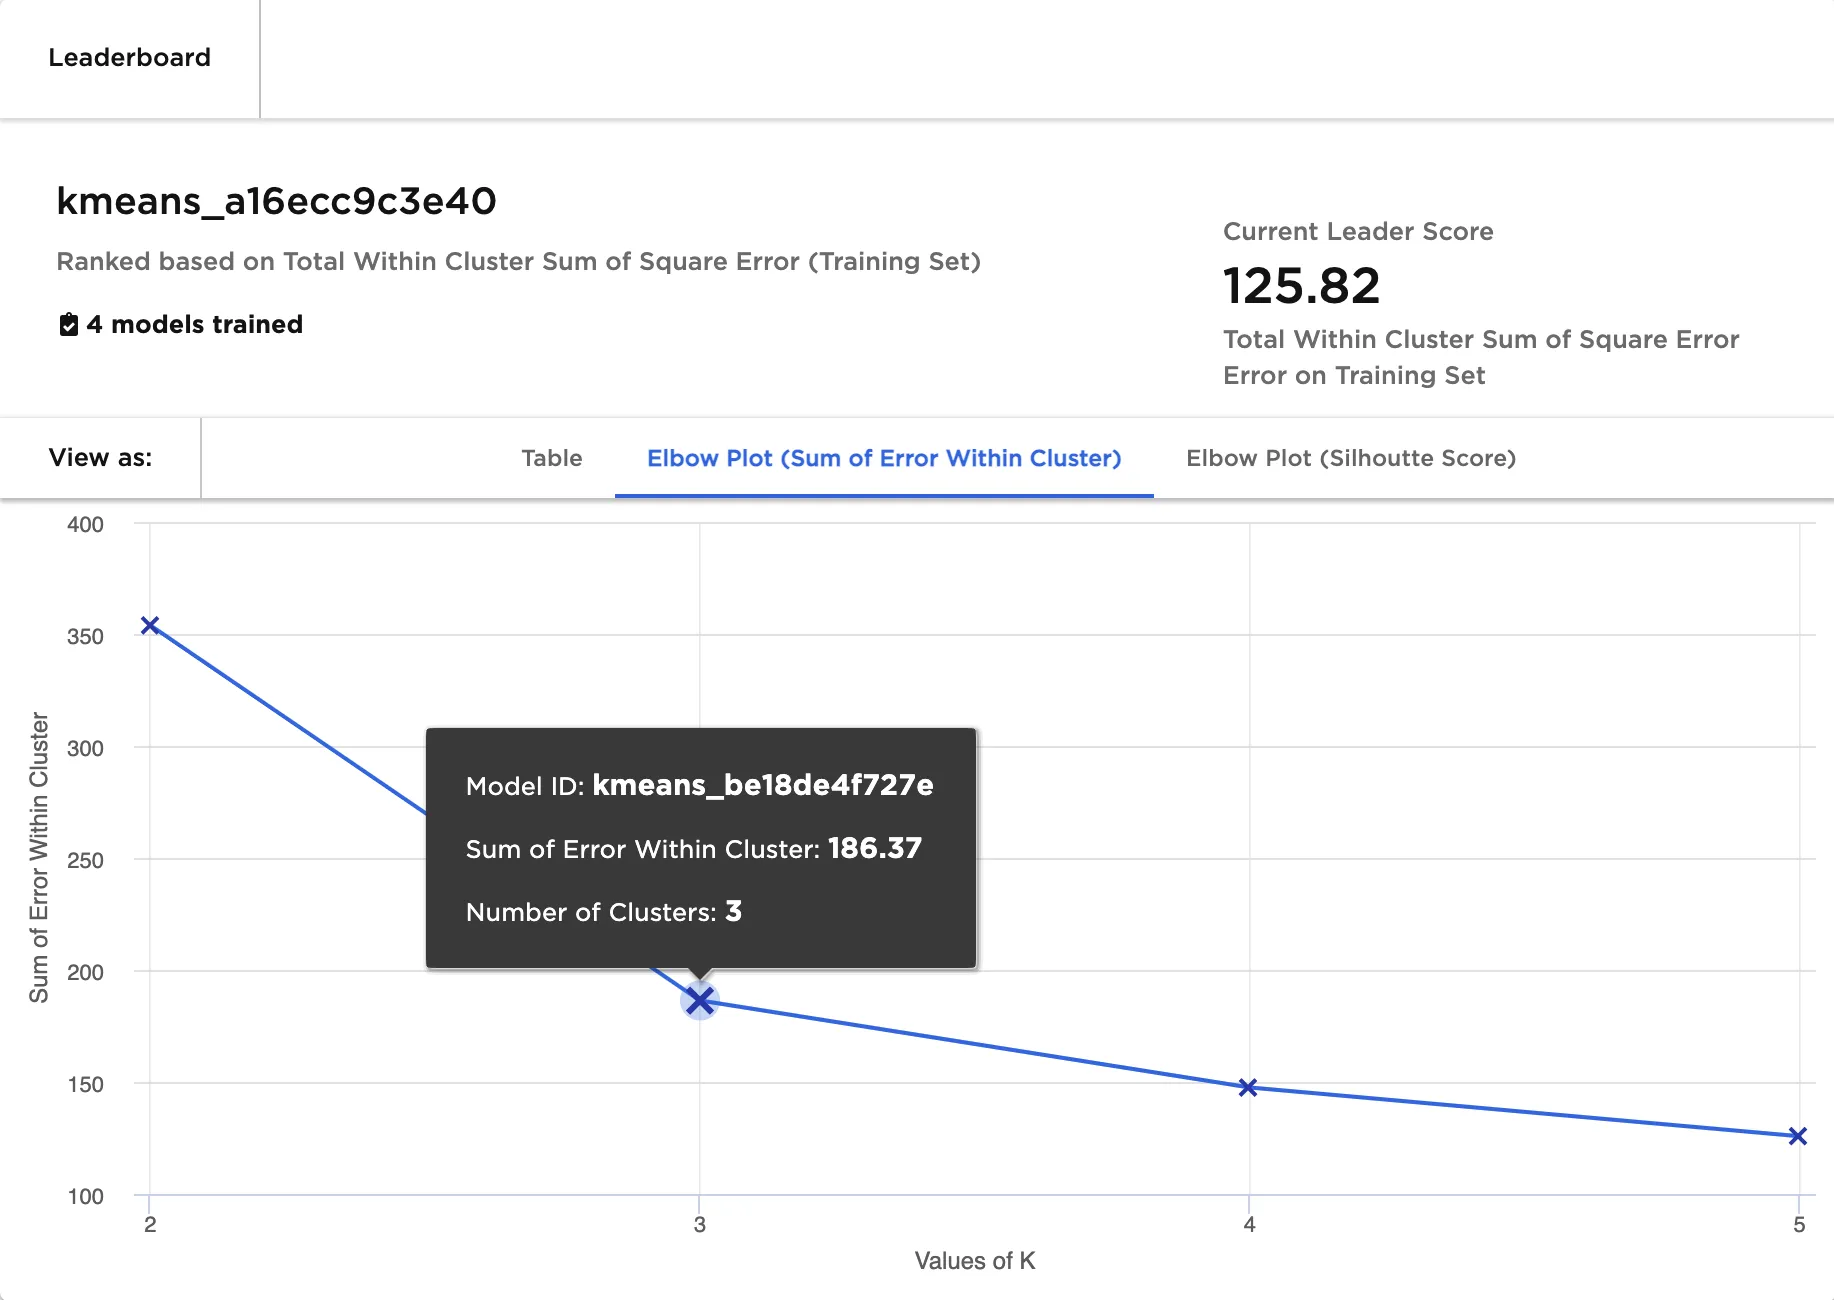
Figure 4: Elbow plot (sum of error within cluster)
The second plot, which displays silhouette scores, should also be considered when choosing the best model. The model with the optimal number of clusters has the highest silhouette score. Calculating the silhouette score for every model is computationally expensive and may take time for large datasets. In Figure 5, the model with 3 clusters has the highest silhouette score.
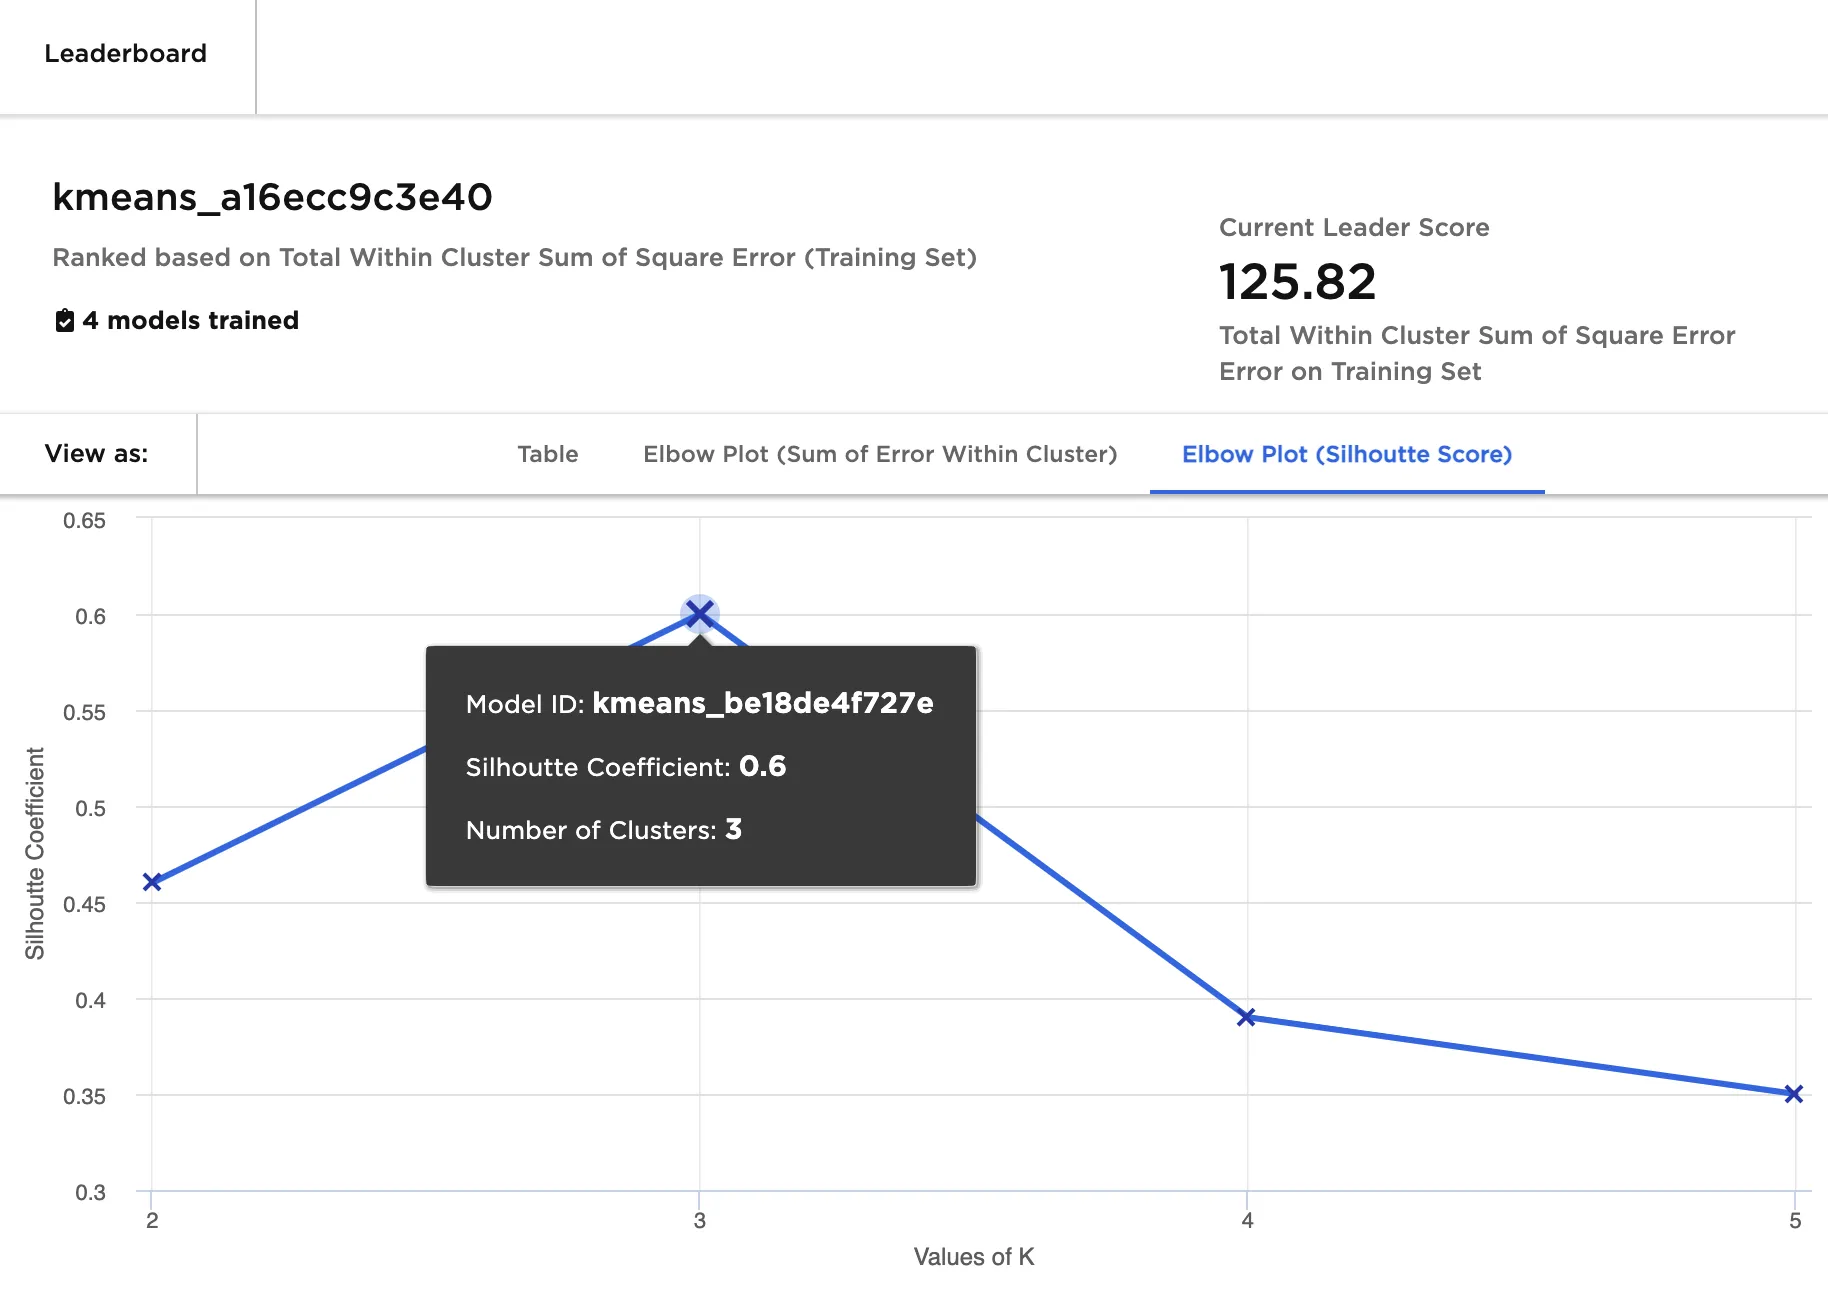
Figure 5: Elbow plot (silhouette score)
- Since both elbow plots indicate that 3 is the optimal number of clusters, select the model with 3 clusters.
- Scroll down to view more information about that specific model.
This tab includes the silhouette plot, which shows how well individual points are assigned to clusters. A point with a positive silhouette score fits well into its cluster, while a point with a negative silhouette score may be in the wrong cluster. If the silhouette plot shows many negative values across the clusters, try training a model with a different number of clusters.
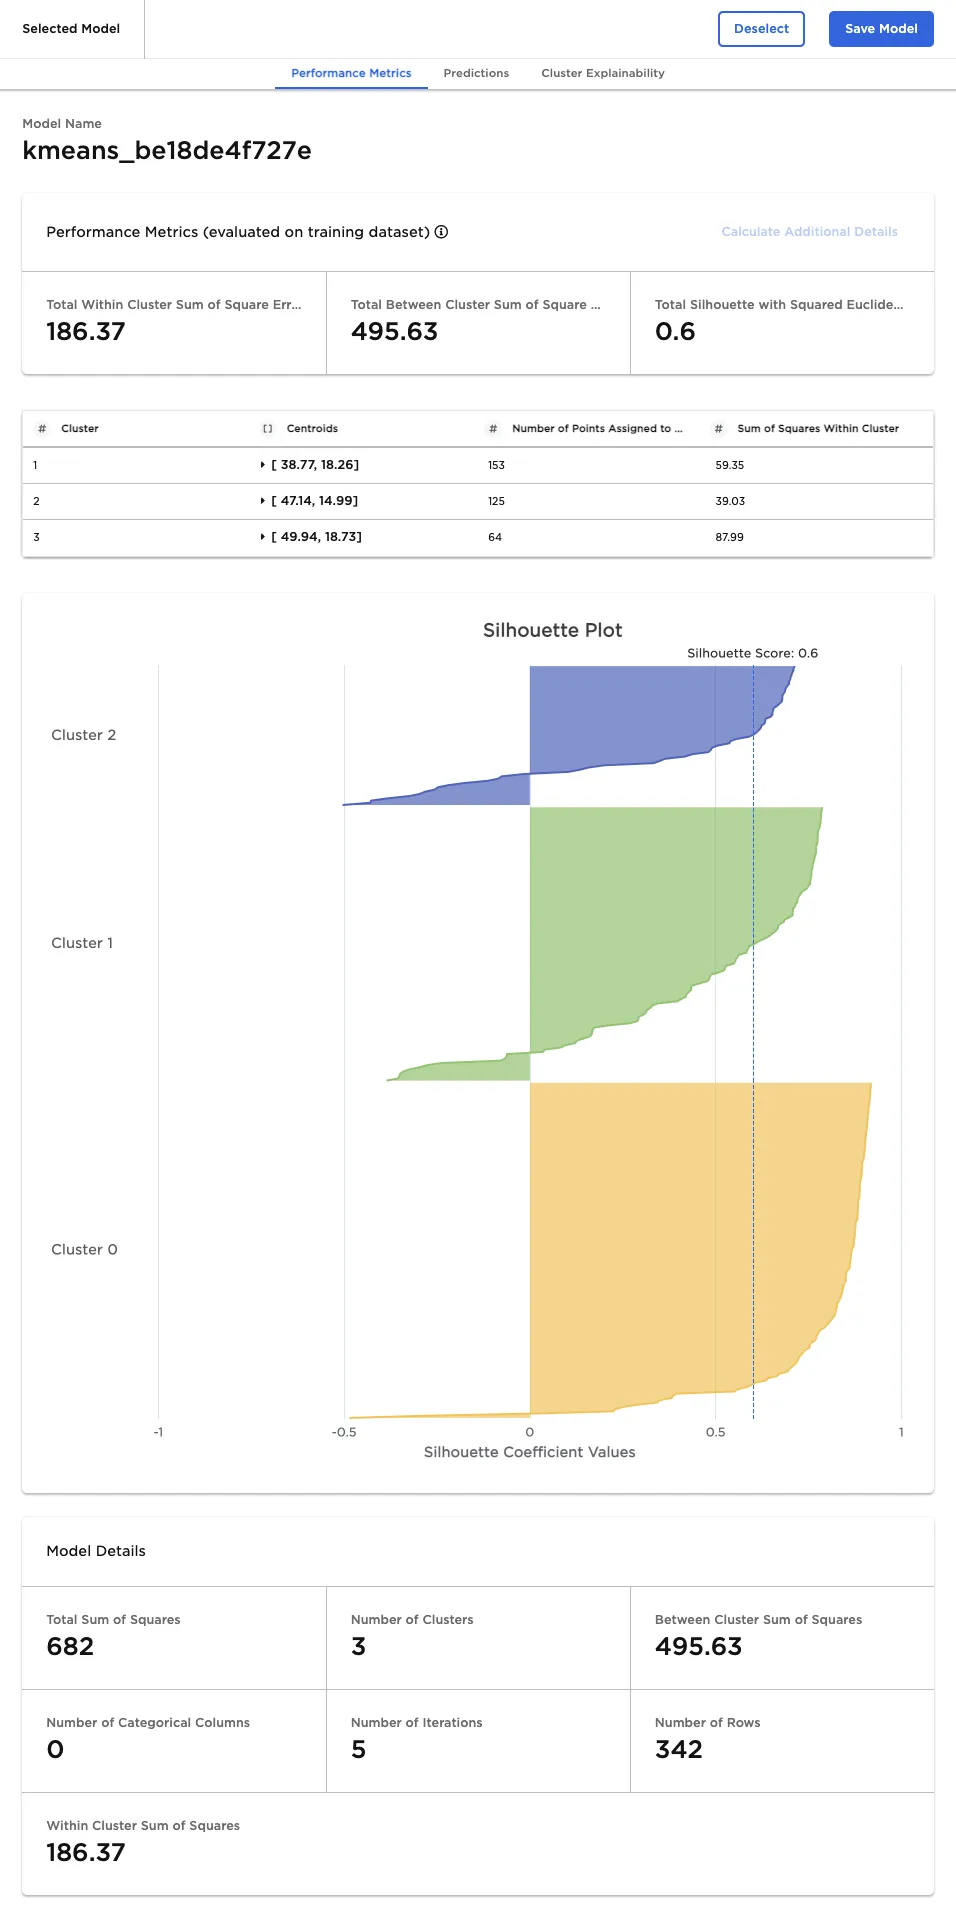
Figure 6: Selected model performance metrics
- After a model is selected, navigate to the Predictions tab.
- Select Calculate Predictions to see which cluster each point belongs to and the distance from each point to the center of that cluster.
Figure 7: Selected model predictions
Select the Cluster Explainability tab to view details about the features that influenced the cluster. This tab includes a decision tree that attempts to explain the contents of the cluster.
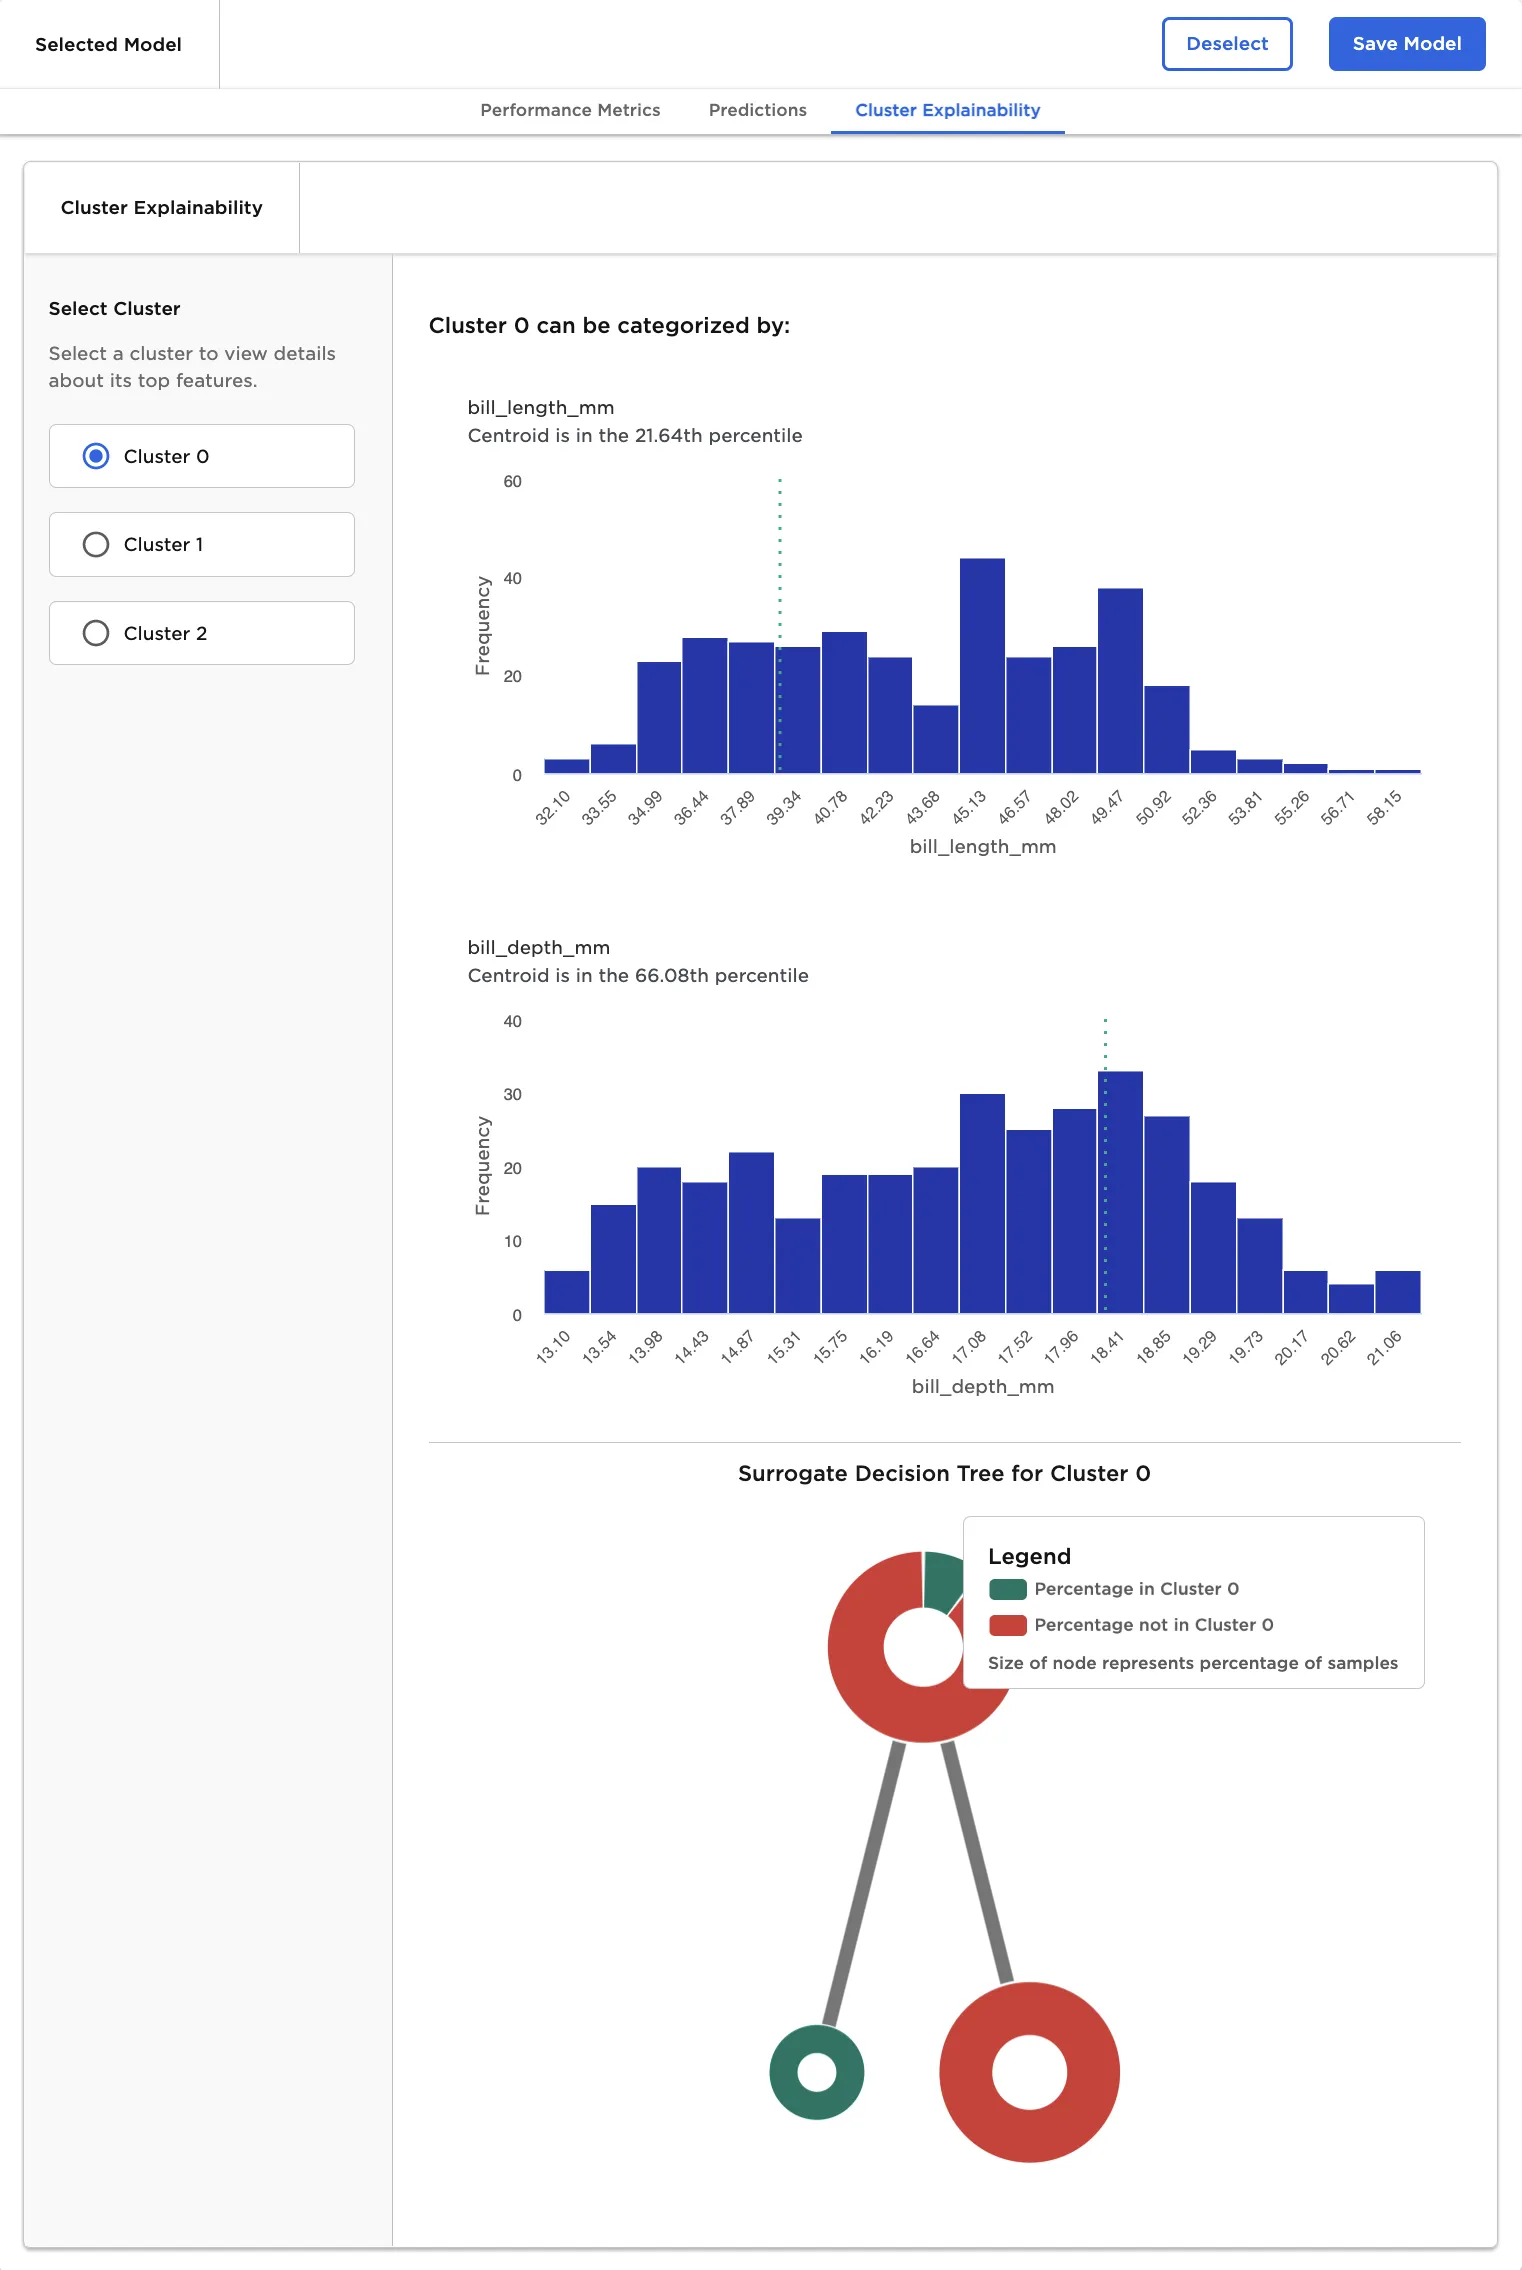
Figure 8: Cluster details