Group By and Aggregate
Use the Group By and Aggregate node in Visual Notebooks to group your data and see aggregate functions on data, and optionally associate the aggregations with one or more groups.
Configuration
| Field | Description |
|---|---|
| Name default=none | Field to name the node An optional user-specified node name displayed in the workspace, both on the node and in the dataframe as a tab. |
| Select Column(s) to Group By (Optional) default=none | Selection to group the data by a column Optionally choose a column and group the data by your selection. |
| Select Column(s) to Aggregate *Required | Columns to aggregate Specify which columns to aggregate. |
| Select Aggregation Method(s) *Required | Apply aggregation method Select an aggregation method to apply to the columns specified in Select Column(s) to Aggregate. |
| Add additional aggregation default=none | Apply additional aggregation Select additional columns to aggregate and aggregation methods to apply to those columns. |
| Sort By default=none | Option to sort the data Optionally choose a column to sort by. The sort can be reversed and additional sort steps can be added. |
Node Inputs/Outputs
| Input | A Visual Notebooks dataframe |
|---|---|
| Output | A dataframe with specified columns to group by and/or apply aggregation methods |
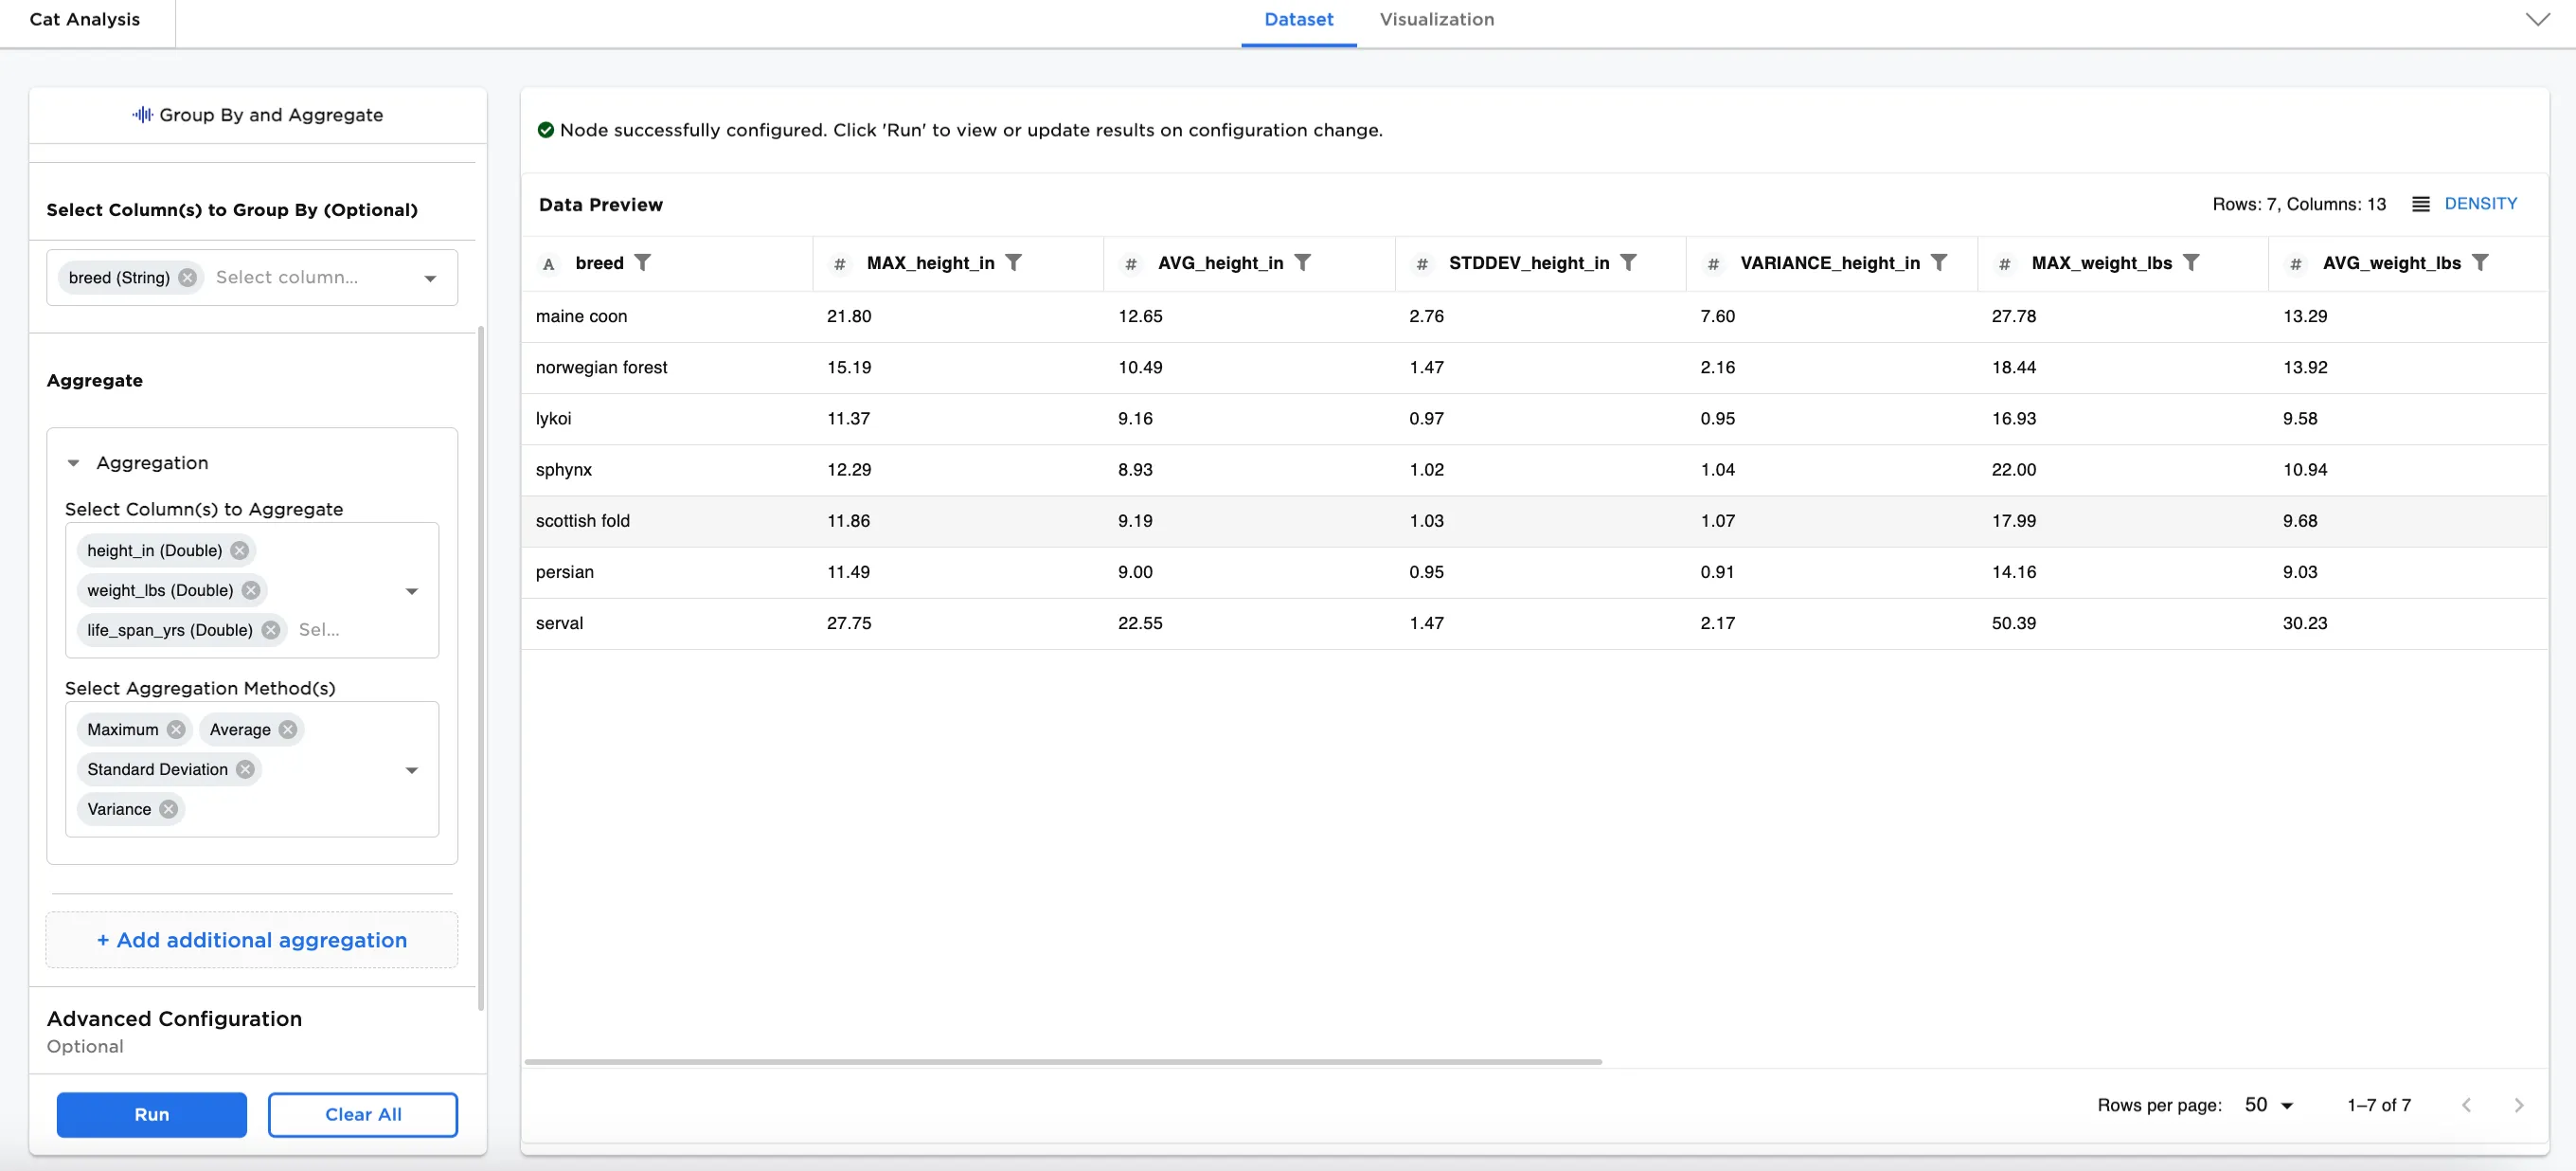
Figure 1: Example output
Example
Analysis of cat breeds is often used in designing products and foods. In our example, we use a dataset with 700 rows of data with 4 columns about several different breeds of cats.
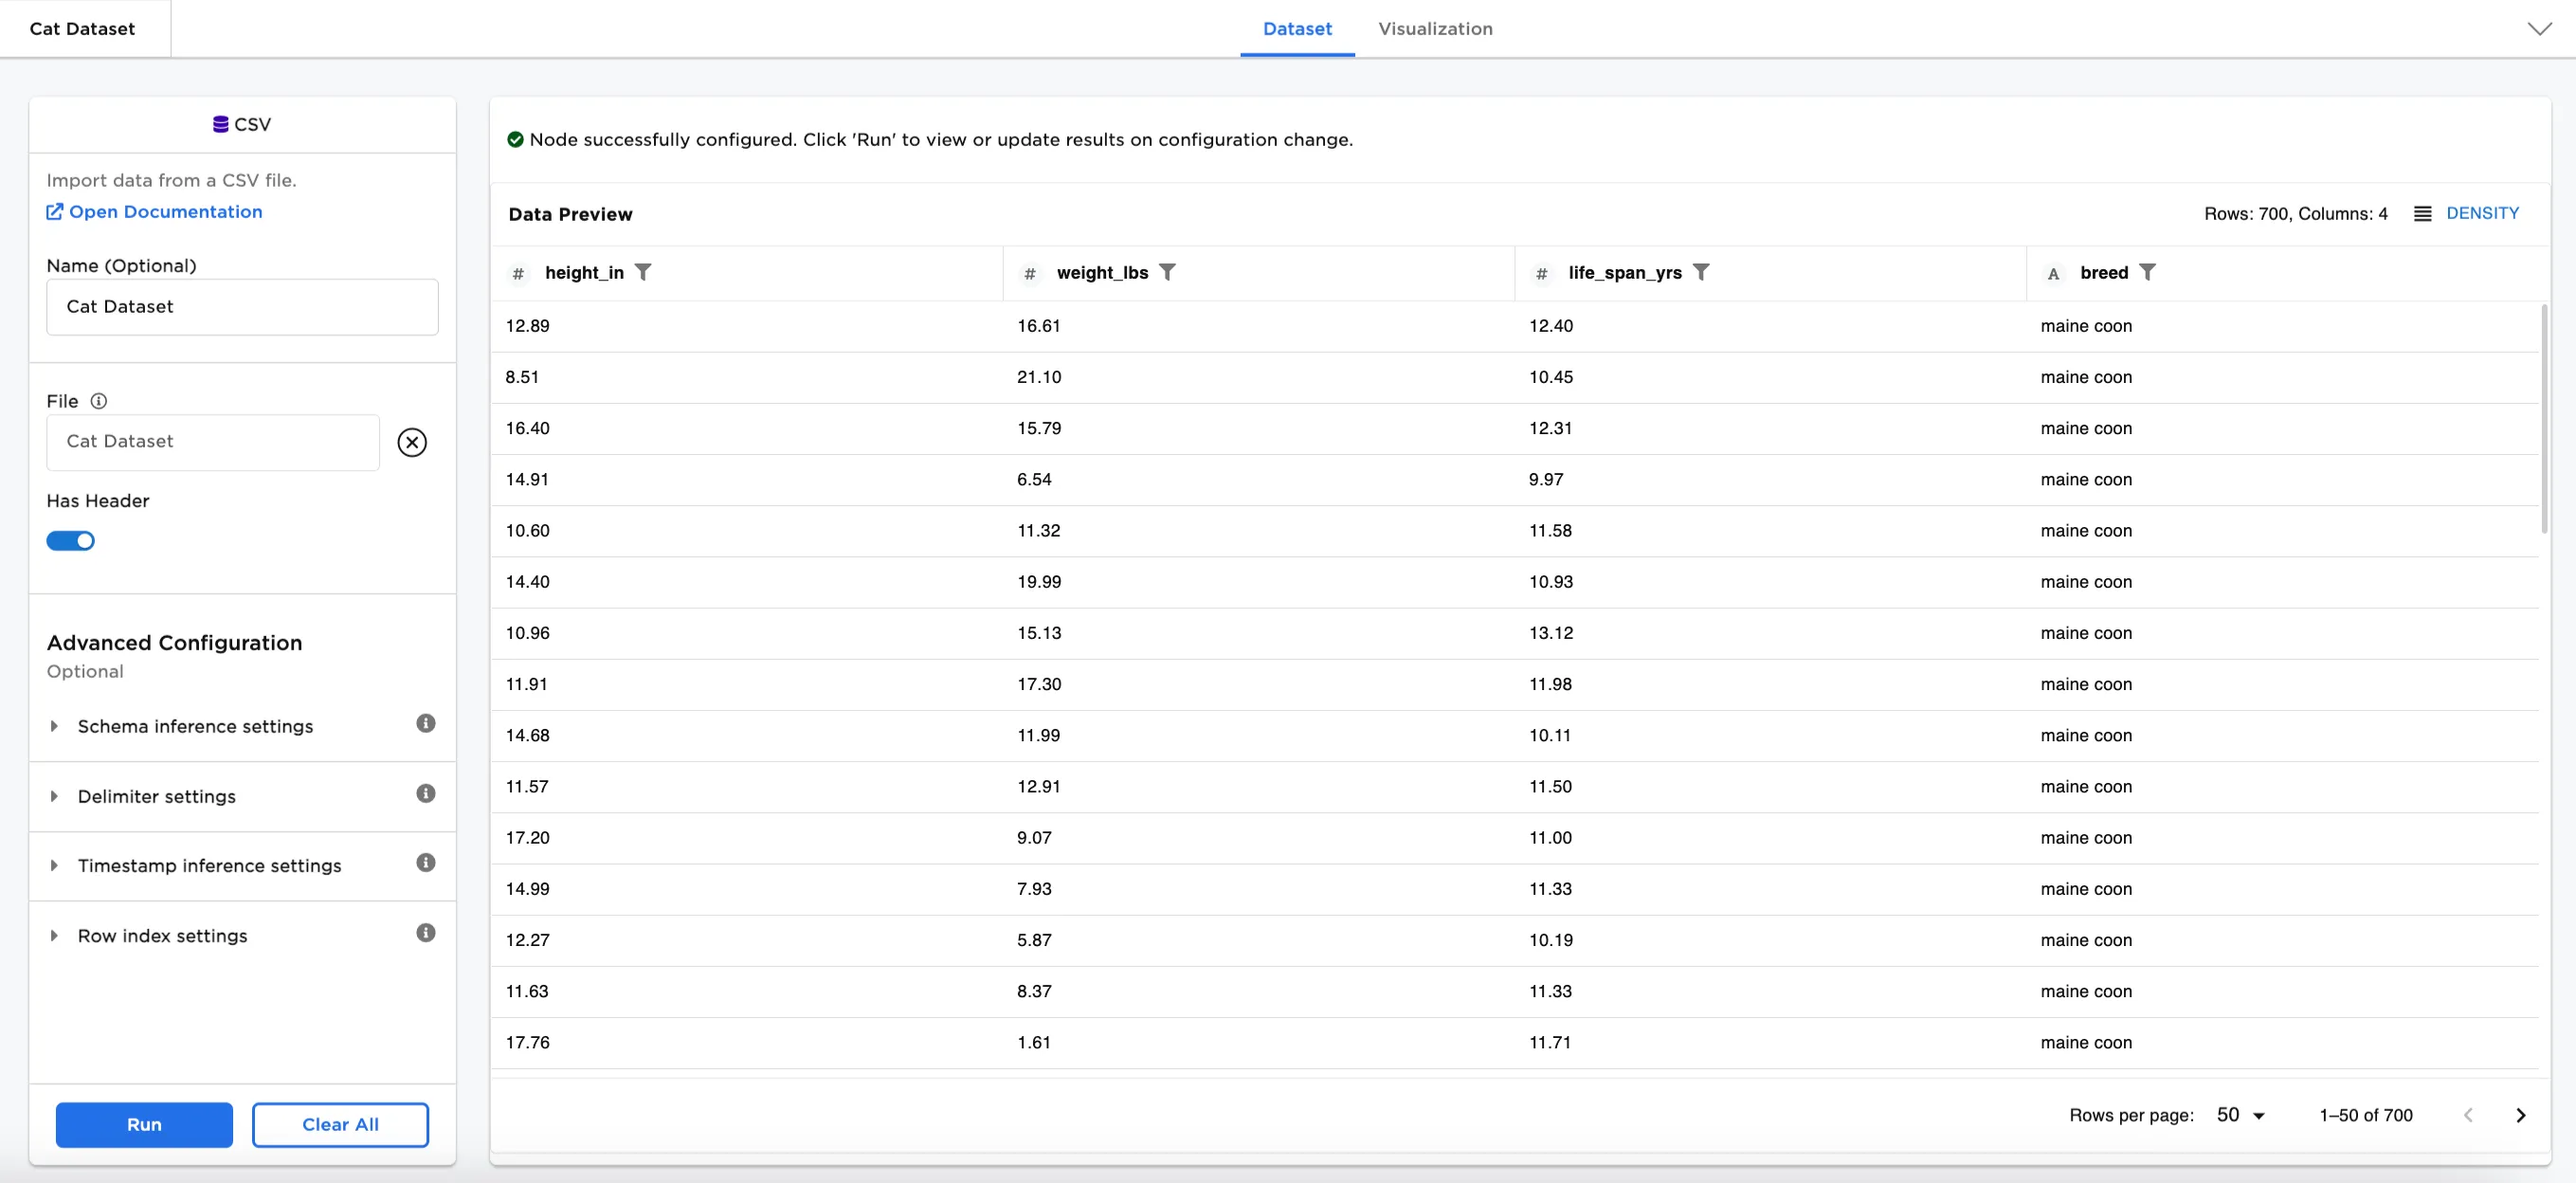
Figure 2: Example input data
First, we explore how Aggregation selections work in the node.
- Connect the Group By and Aggregate node to an existing node. In this case, the node is connected to a CSV node with the sample data.
- In the Select Column(s) to Aggregate field, select the dataset columns you'd like to aggregate. In this case,
height_in (Double),weight_lbs (Double), andlife_span_yrs (Double)are selected. - In the Select Aggregation Method(s) field, choose which aggregation method(s) you'd like to apply the selected columns. Figure 3 shows
Maximum,Average,Standard Deviation, andVarianceare selected. - Select Run.
The dataset in Figure 3 shows 12 columns with each of the 4 aggregation methods applied on the 3 columns selected for aggregation. The resulting dataset shows a single line with the maximum, average, standard deviation, and variance of all 700 rows of data.
The full list of the available aggregation method selections is here:
SumMinimumMaximumAverageCountCount DistinctStandard DeviationVariance25% PercentileMedian75% Percentile
Note: The Sum Distinct and Count Distinct methods apply to unique values.
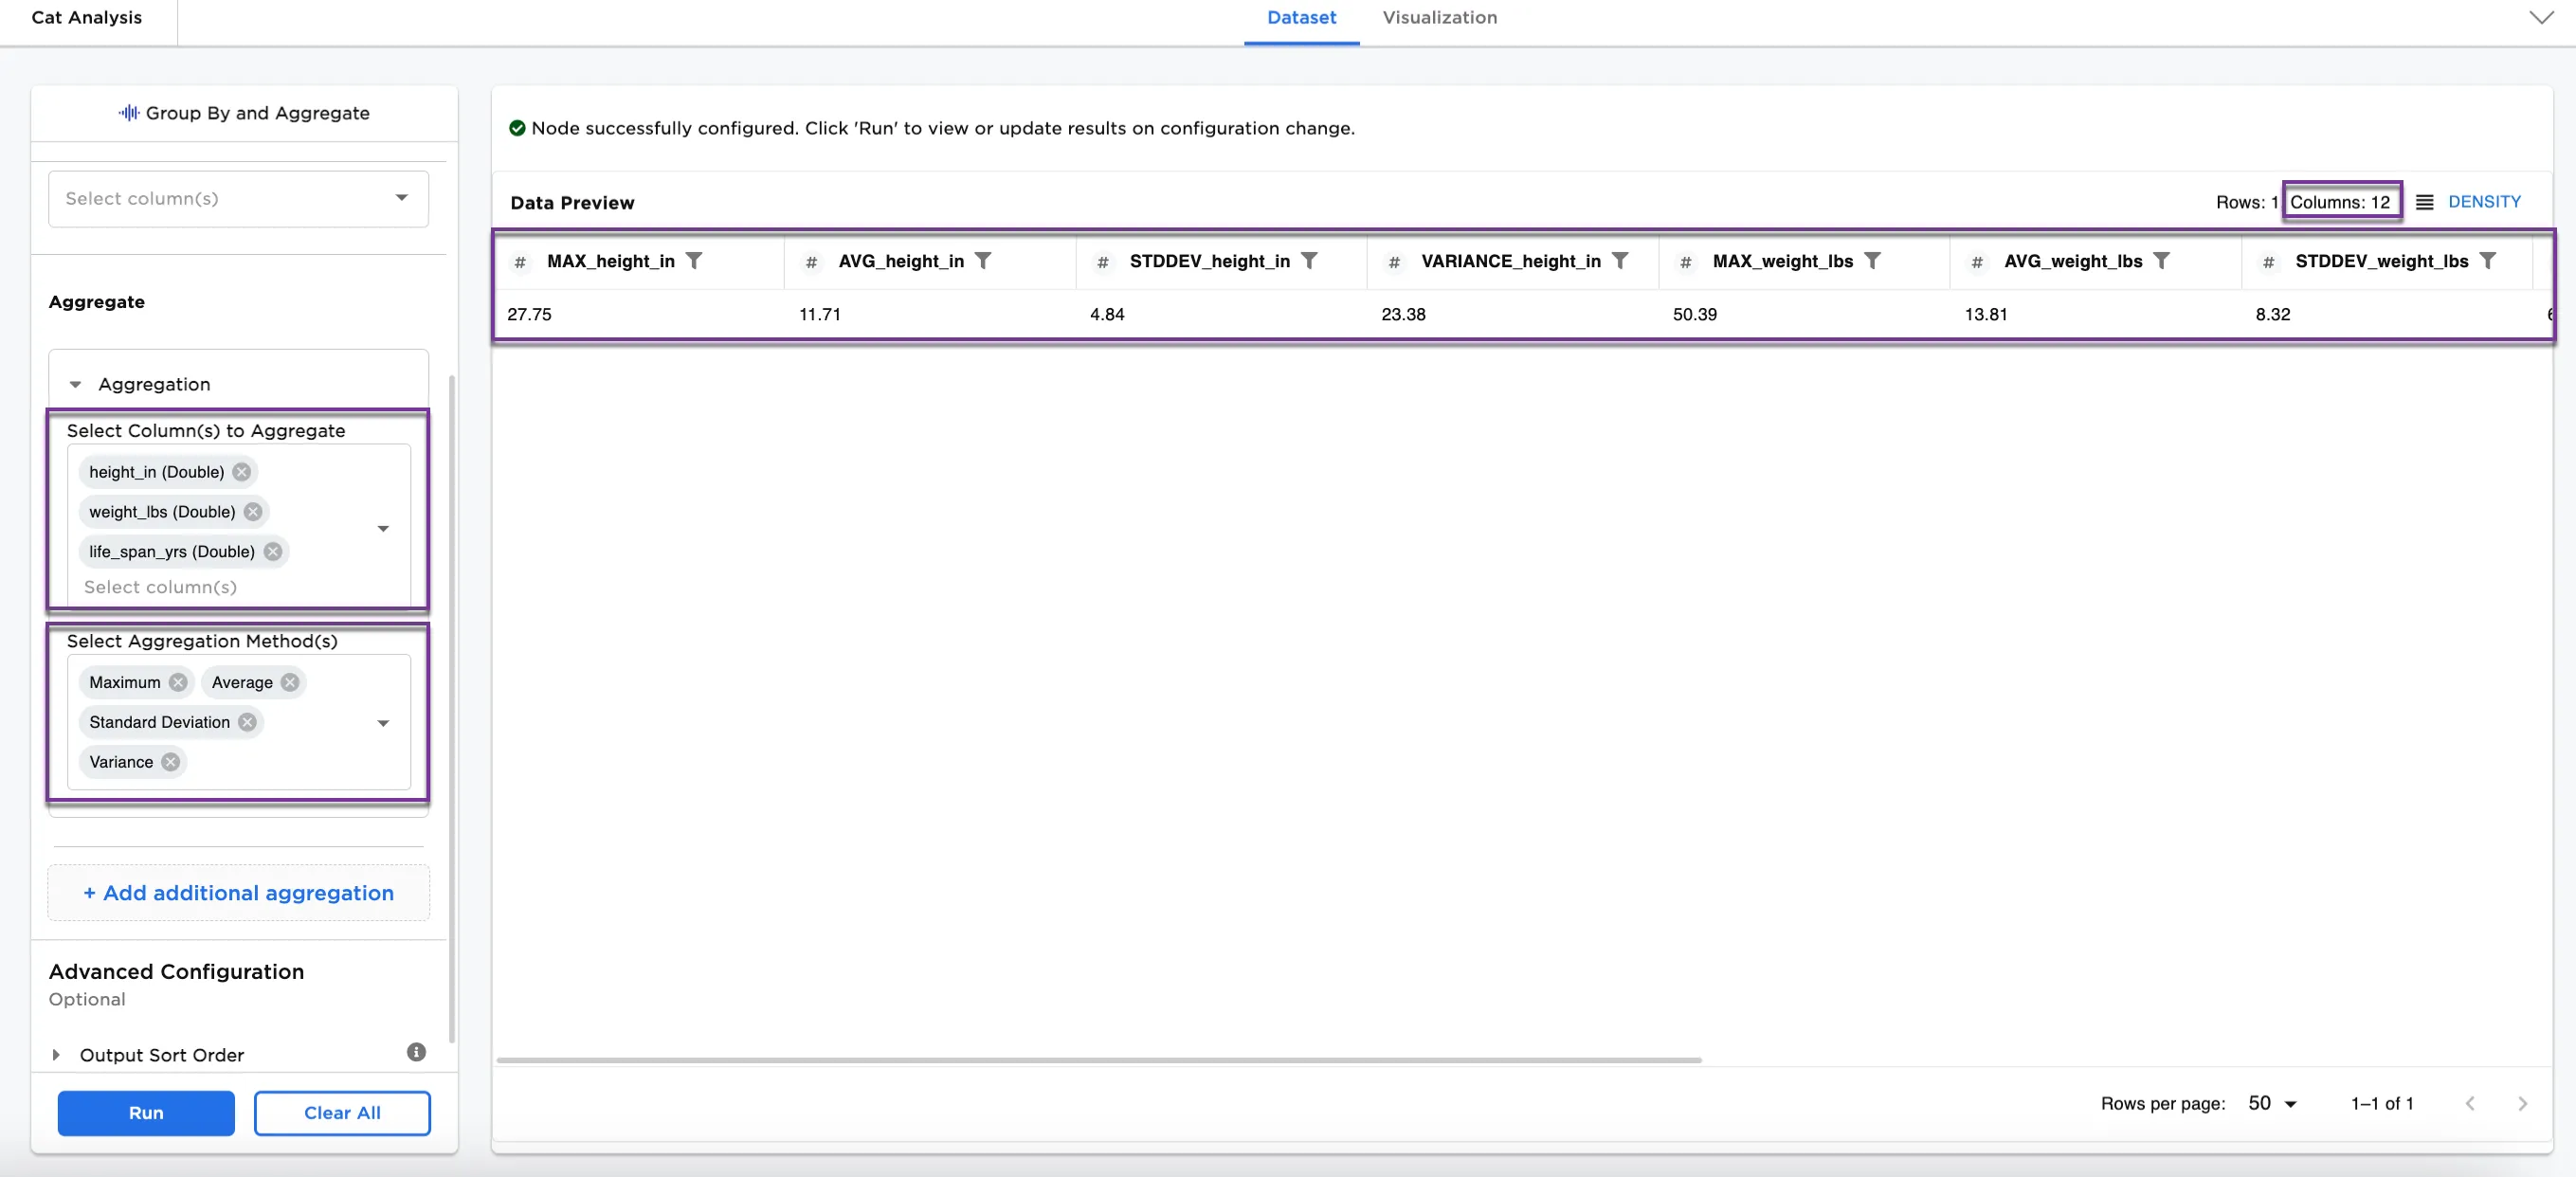
Figure 3: Example of aggregation on selected columns
Optionally, the aggregation columns can be grouped by another column.
- In the Select Column(s) to Group by (Optional) field, select a column to group by. Figure 4 shows the
breed (String)selected to group by. - Select Run.
The group by selection shows all the same aggregations by breed.
To create new aggregation methods on different columns in the same dataset, select the Add additional aggregation button.
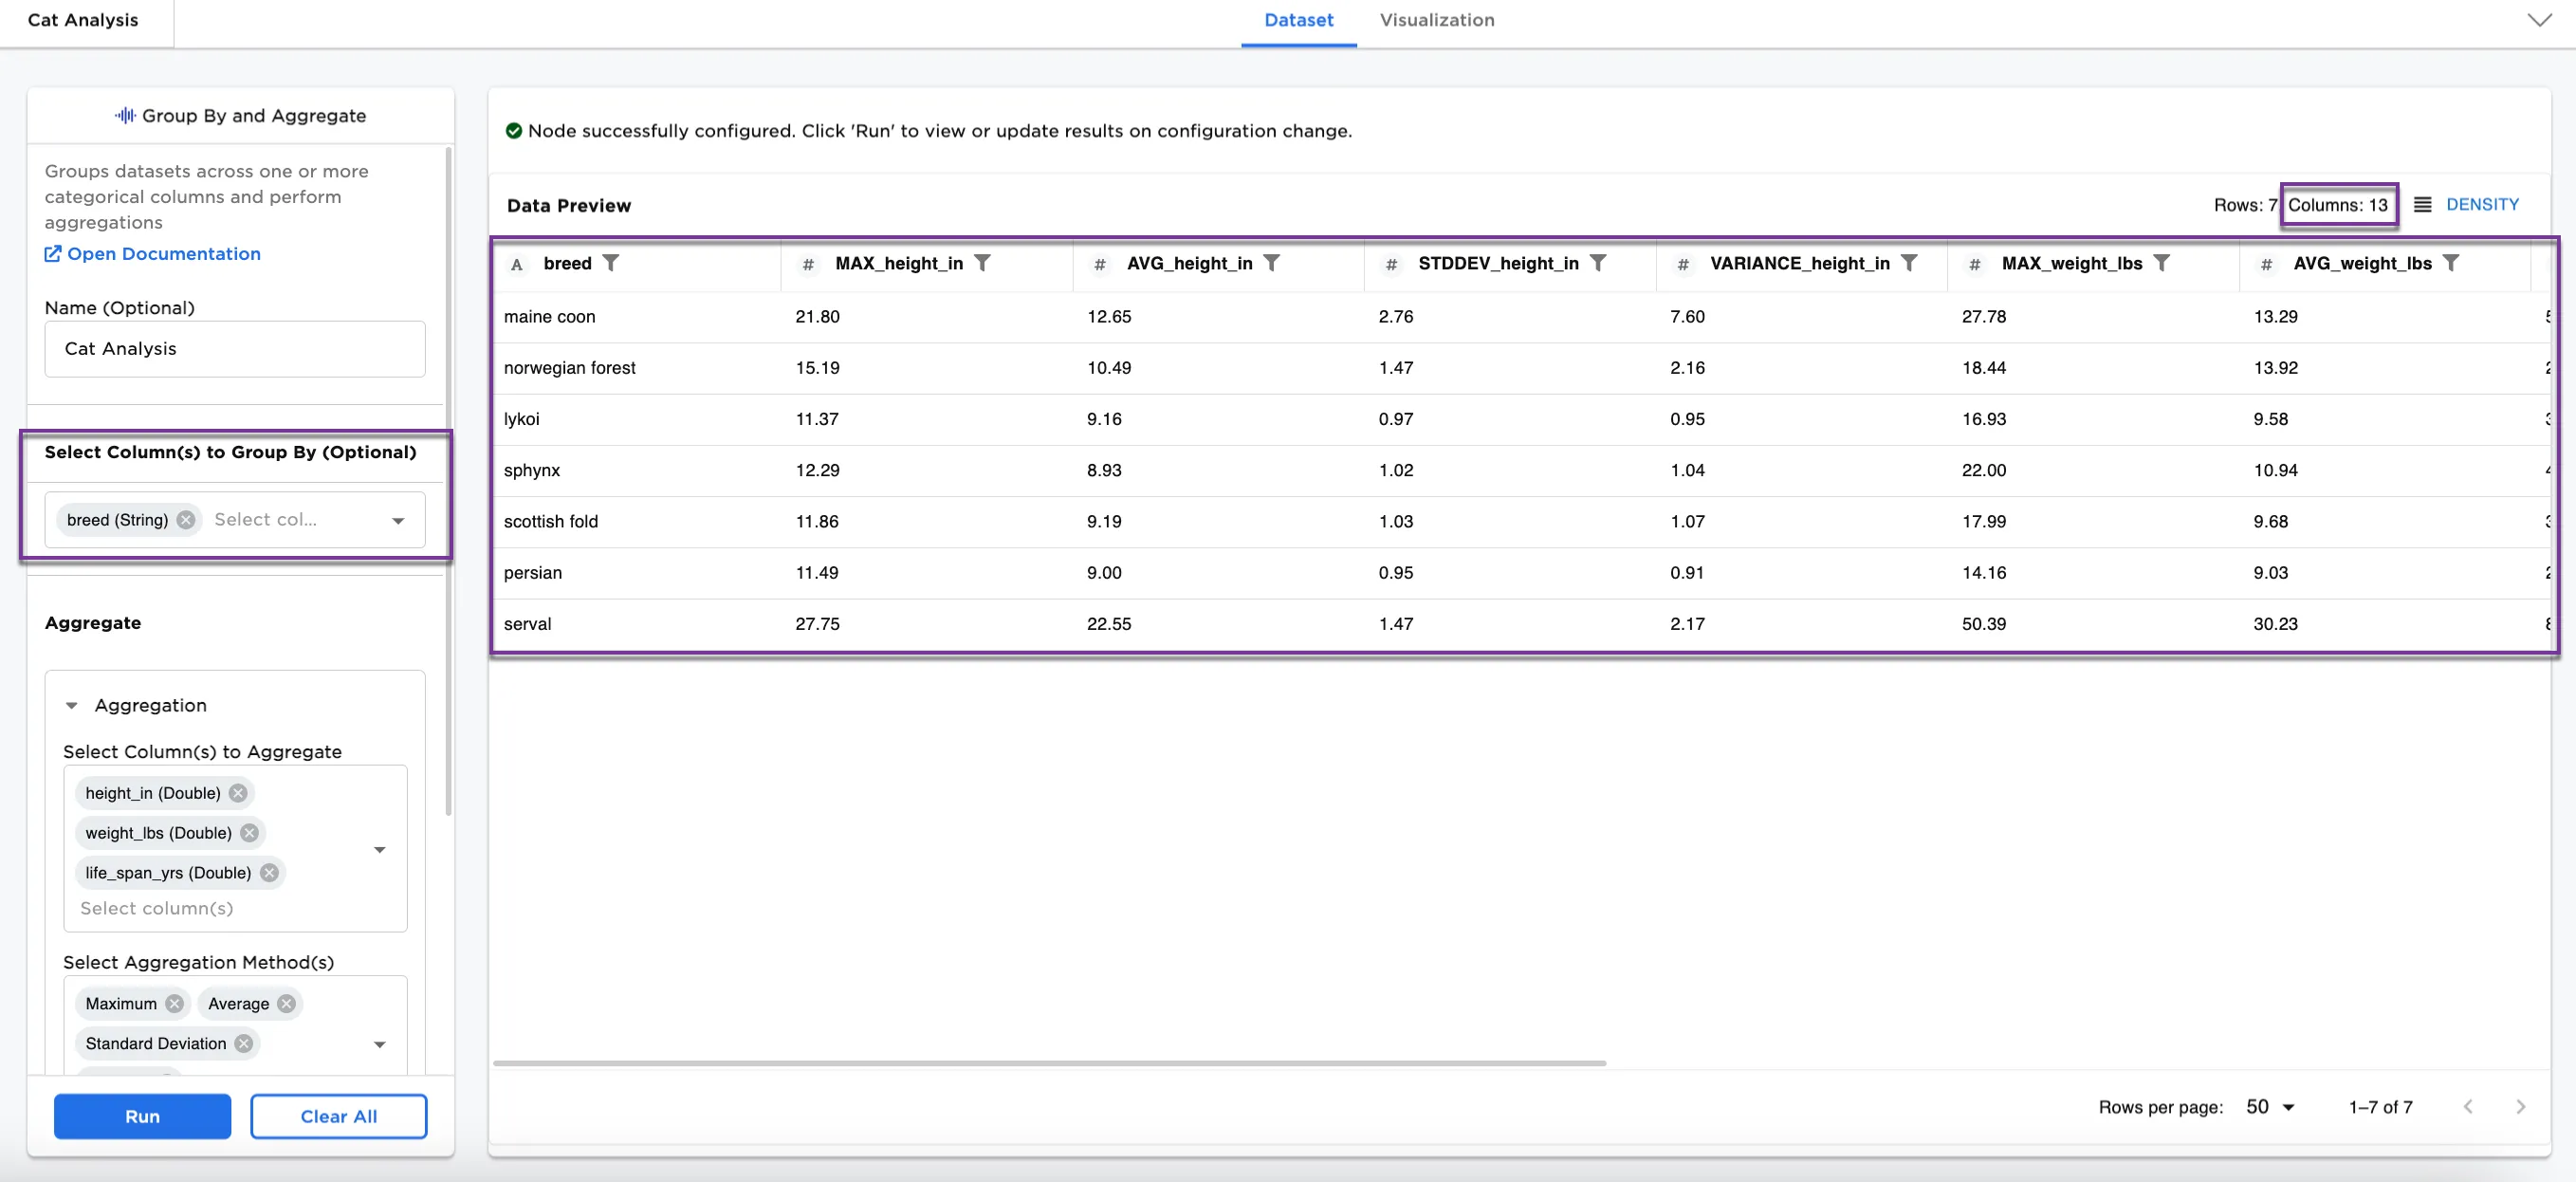
Figure 4: Example of aggregations grouped by breed
Once you've completed your aggregations and grouped the data by a column, another option available in this node is to sort.
- In the Advanced Configuration section, select a column to sort by. In Figure 5, the dataframes is sorted by
AVG_life_span_yrs. - Select Run.
Notice that the dataframe is sorted by the average life span in descending order from 14.87 (norwegian forest) to 11.84 (maine coon).
Note: Some columns in Figure 5 are removed to show relevant information. If you are following along with the example, please scroll to the right to see the AVG_life_span_yrs column,
Additional sort steps can be added, and the sort order can also be reversed.
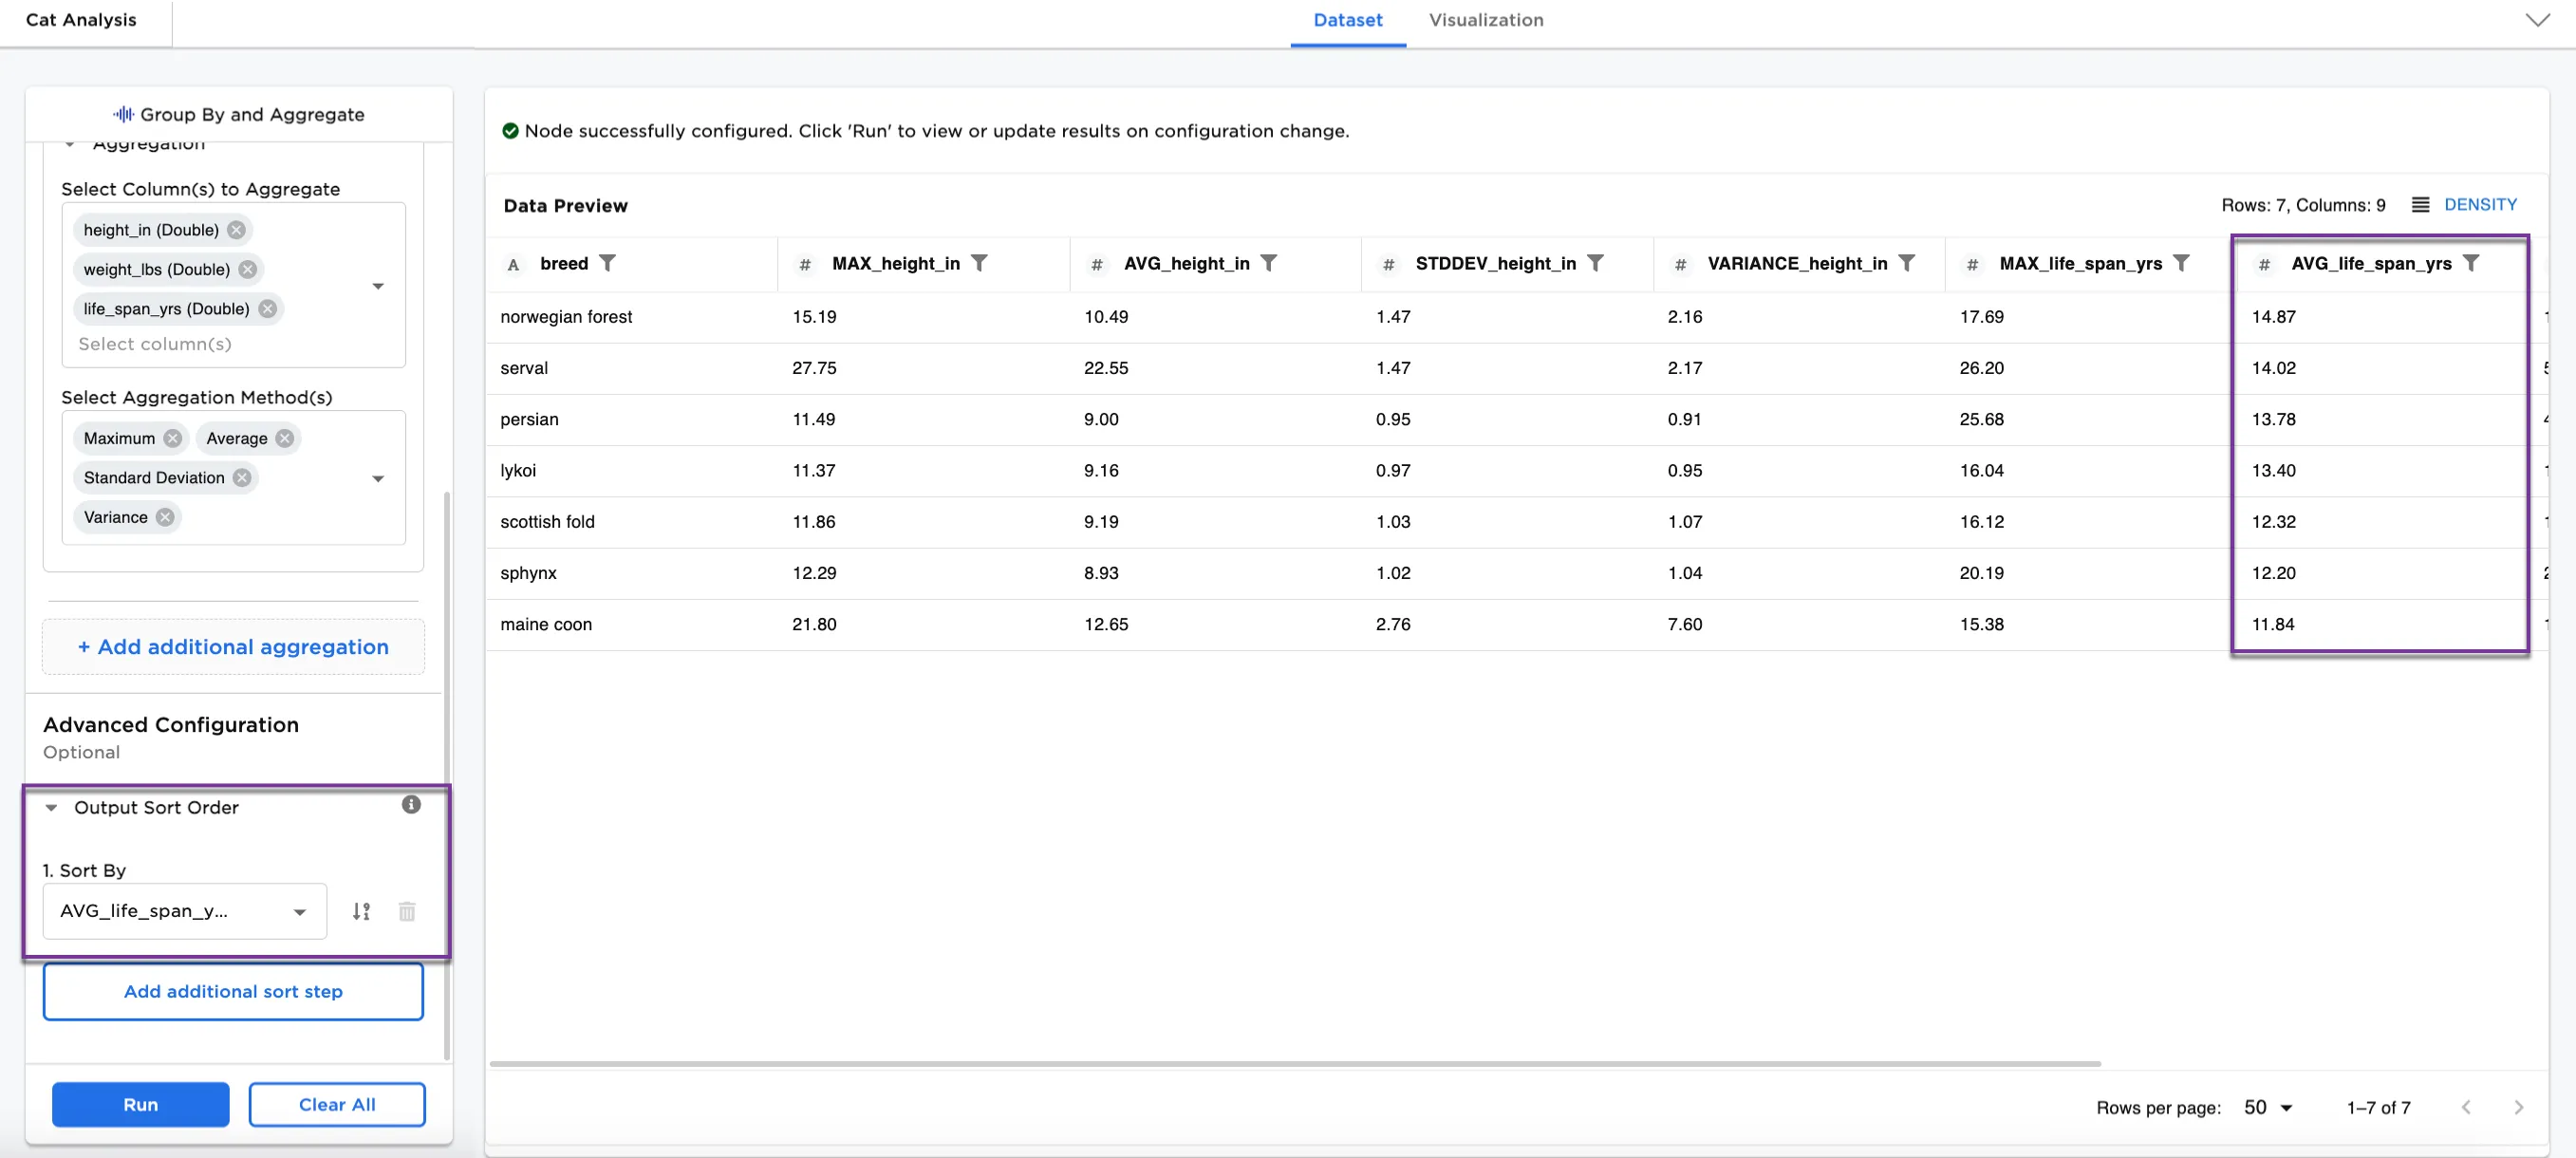
Figure 5: Example of dataframe sorted by average life span