Top N by Group
Use the Top N by Group node in Visual Notebooks to find the top N records with the same grouping values in each specified group within a dataset.
Top N by Group is used for analyzing business use cases involving the top N rows of a dataset or the top N rows of a grouped dataset. This is useful to isolate analytics by extracting specific datapoints from the dataset. Keep in mind, the results depend on the sort configuration and count per group; sorting in descending order places the highest integer or first alphabetical order values at the top, which can affect the analytics, and count per group changes the values that are included in the analytics.
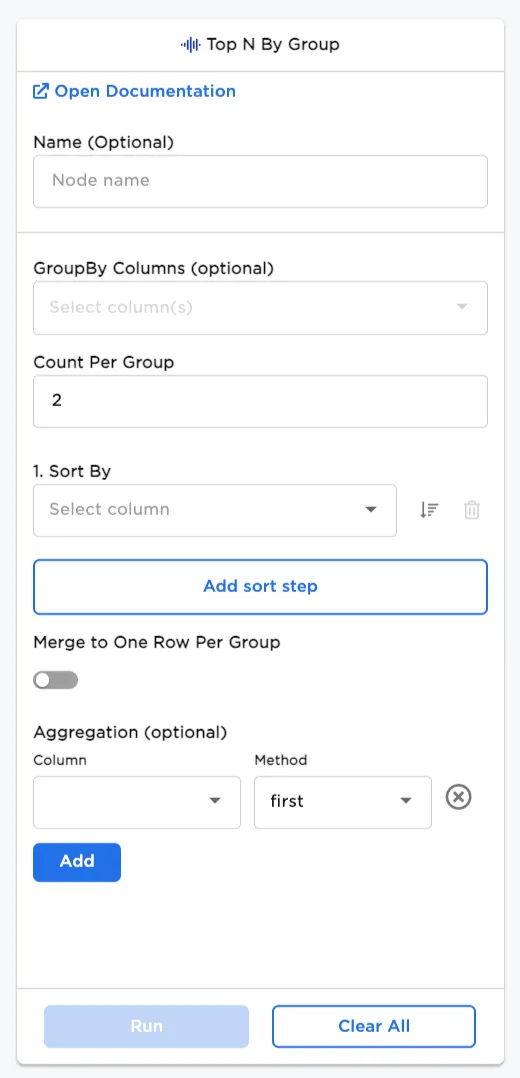
Configuration
| Field | Description |
|---|---|
| Name | Field to name the node An optional user-specified node name displayed in the workspace, both on the node and in the dataframe as a tab. |
| GroupBy Columns (optional) | Columns to group by Optionally, select columns to group by. |
| Count Per Group | Factor of Top Ns Select how many rows to count per group. |
| Add a sort step | Sorting option Enter field(s) from the dataset to sort by. |
| Merge to One Row Per Group | One row per group option Toggle the button on to merge to one row per group. Keep the toggle off (default) to show the dataset as a whole. Note: This option can only be used with an Aggregation selection. |
| Aggregation (optional) | Add aggregation(s) Select a column and method for one or more aggregations. |
Node Inputs/Outputs
| Input | A Visual Notebooks dataframe |
|---|---|
| Output | A dataframe with top N values by group |
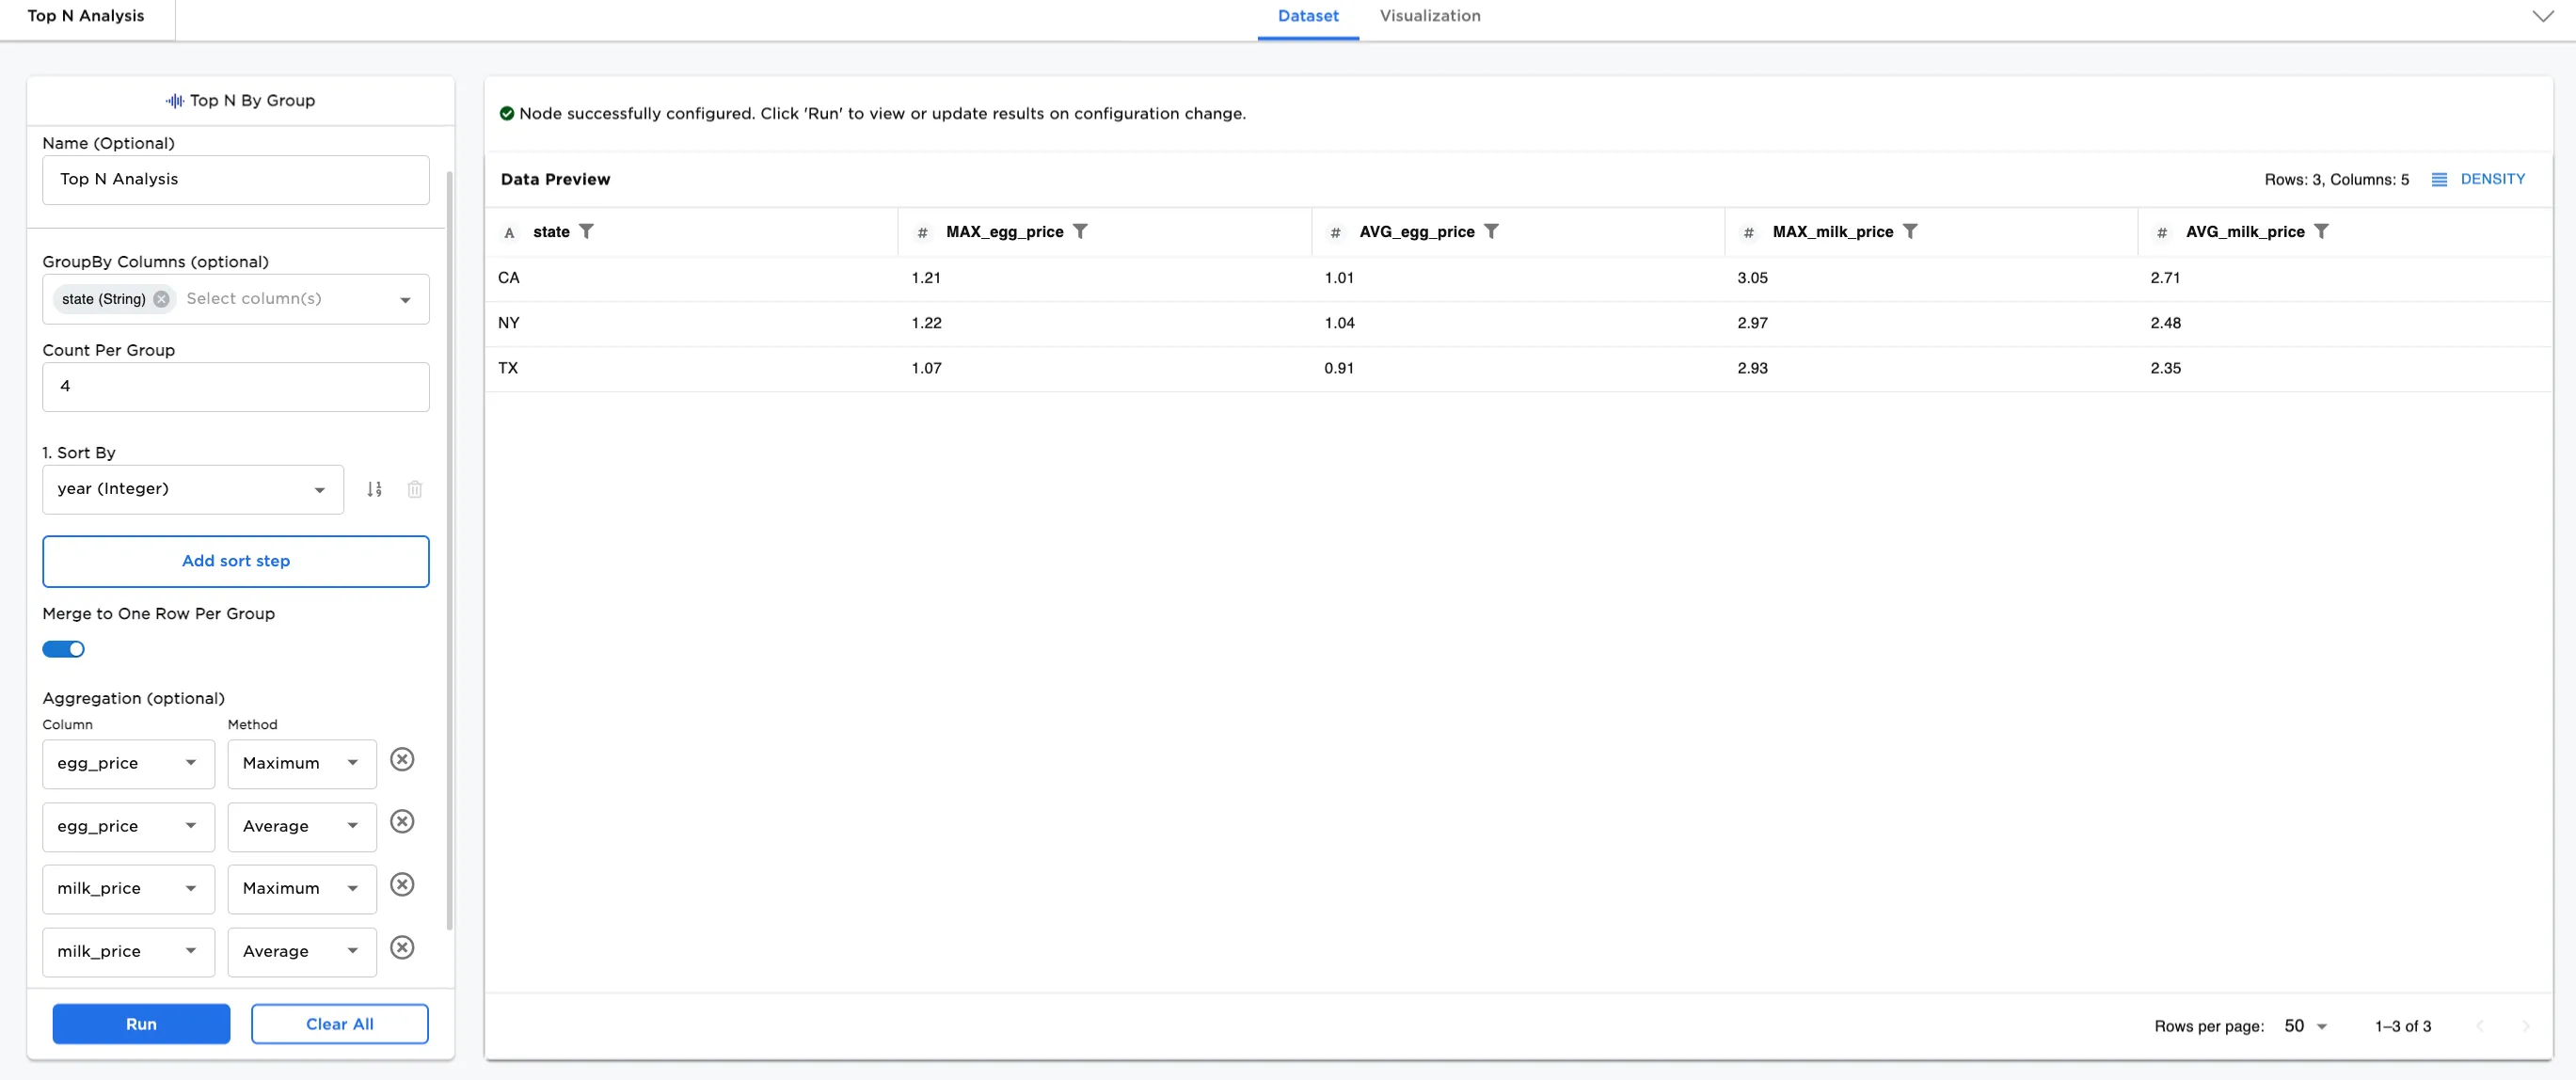
Figure 1: Example output dataframe
Examples
In this example, we have a dataset with the price of eggs and milk in three US states every five years from 1980 to 2020. There are 27 rows of data. We explore the Top N by Group node using this dataset.
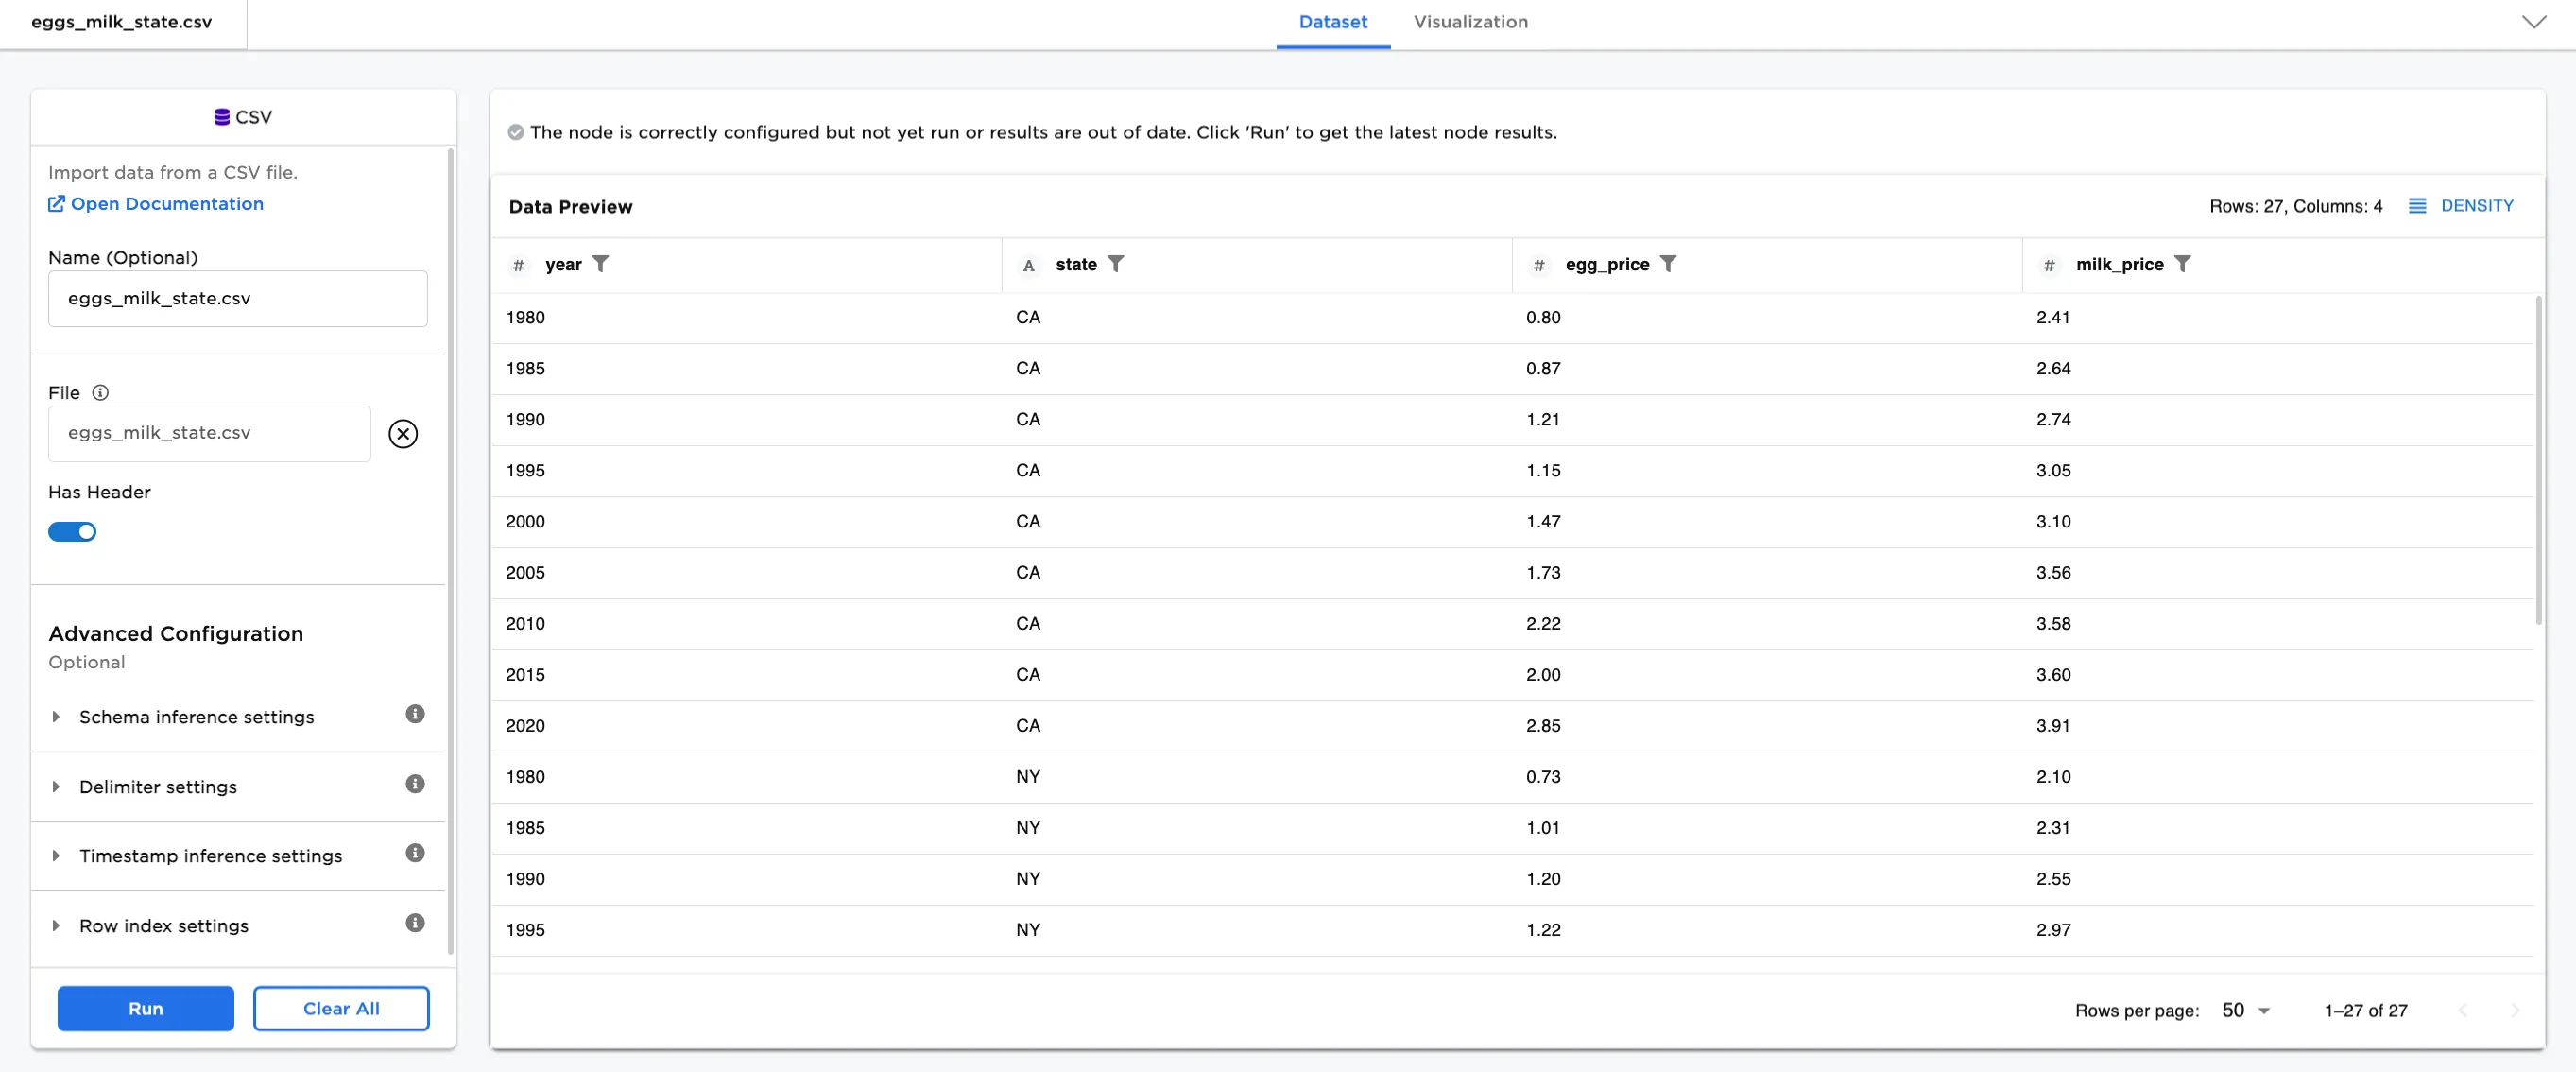
Figure 2: Example data input dataframe
- Connect a Top N by Group node to an existing node. In this case, it is connected to the Shipment CSV file.
- Optionally, name the Top N by Group node. In the example, the node is named,
Top N Analysis. - For GroupBy Column, select
state (String). - For Count Per Group, enter
4. - If the Sort By column is not set, you'll be prompted to enter at least one sort by column. For this example, select
state (String). - Select Run.
Notice that the dataset, shown in Figure 3a, has 12 rows with the first four values from each state (CA, NY, and TX) sorted by state.
Now select year (Integer) for the Sort By column and select Run.
Figure 3b shows the same first four values from each state sorted by year.
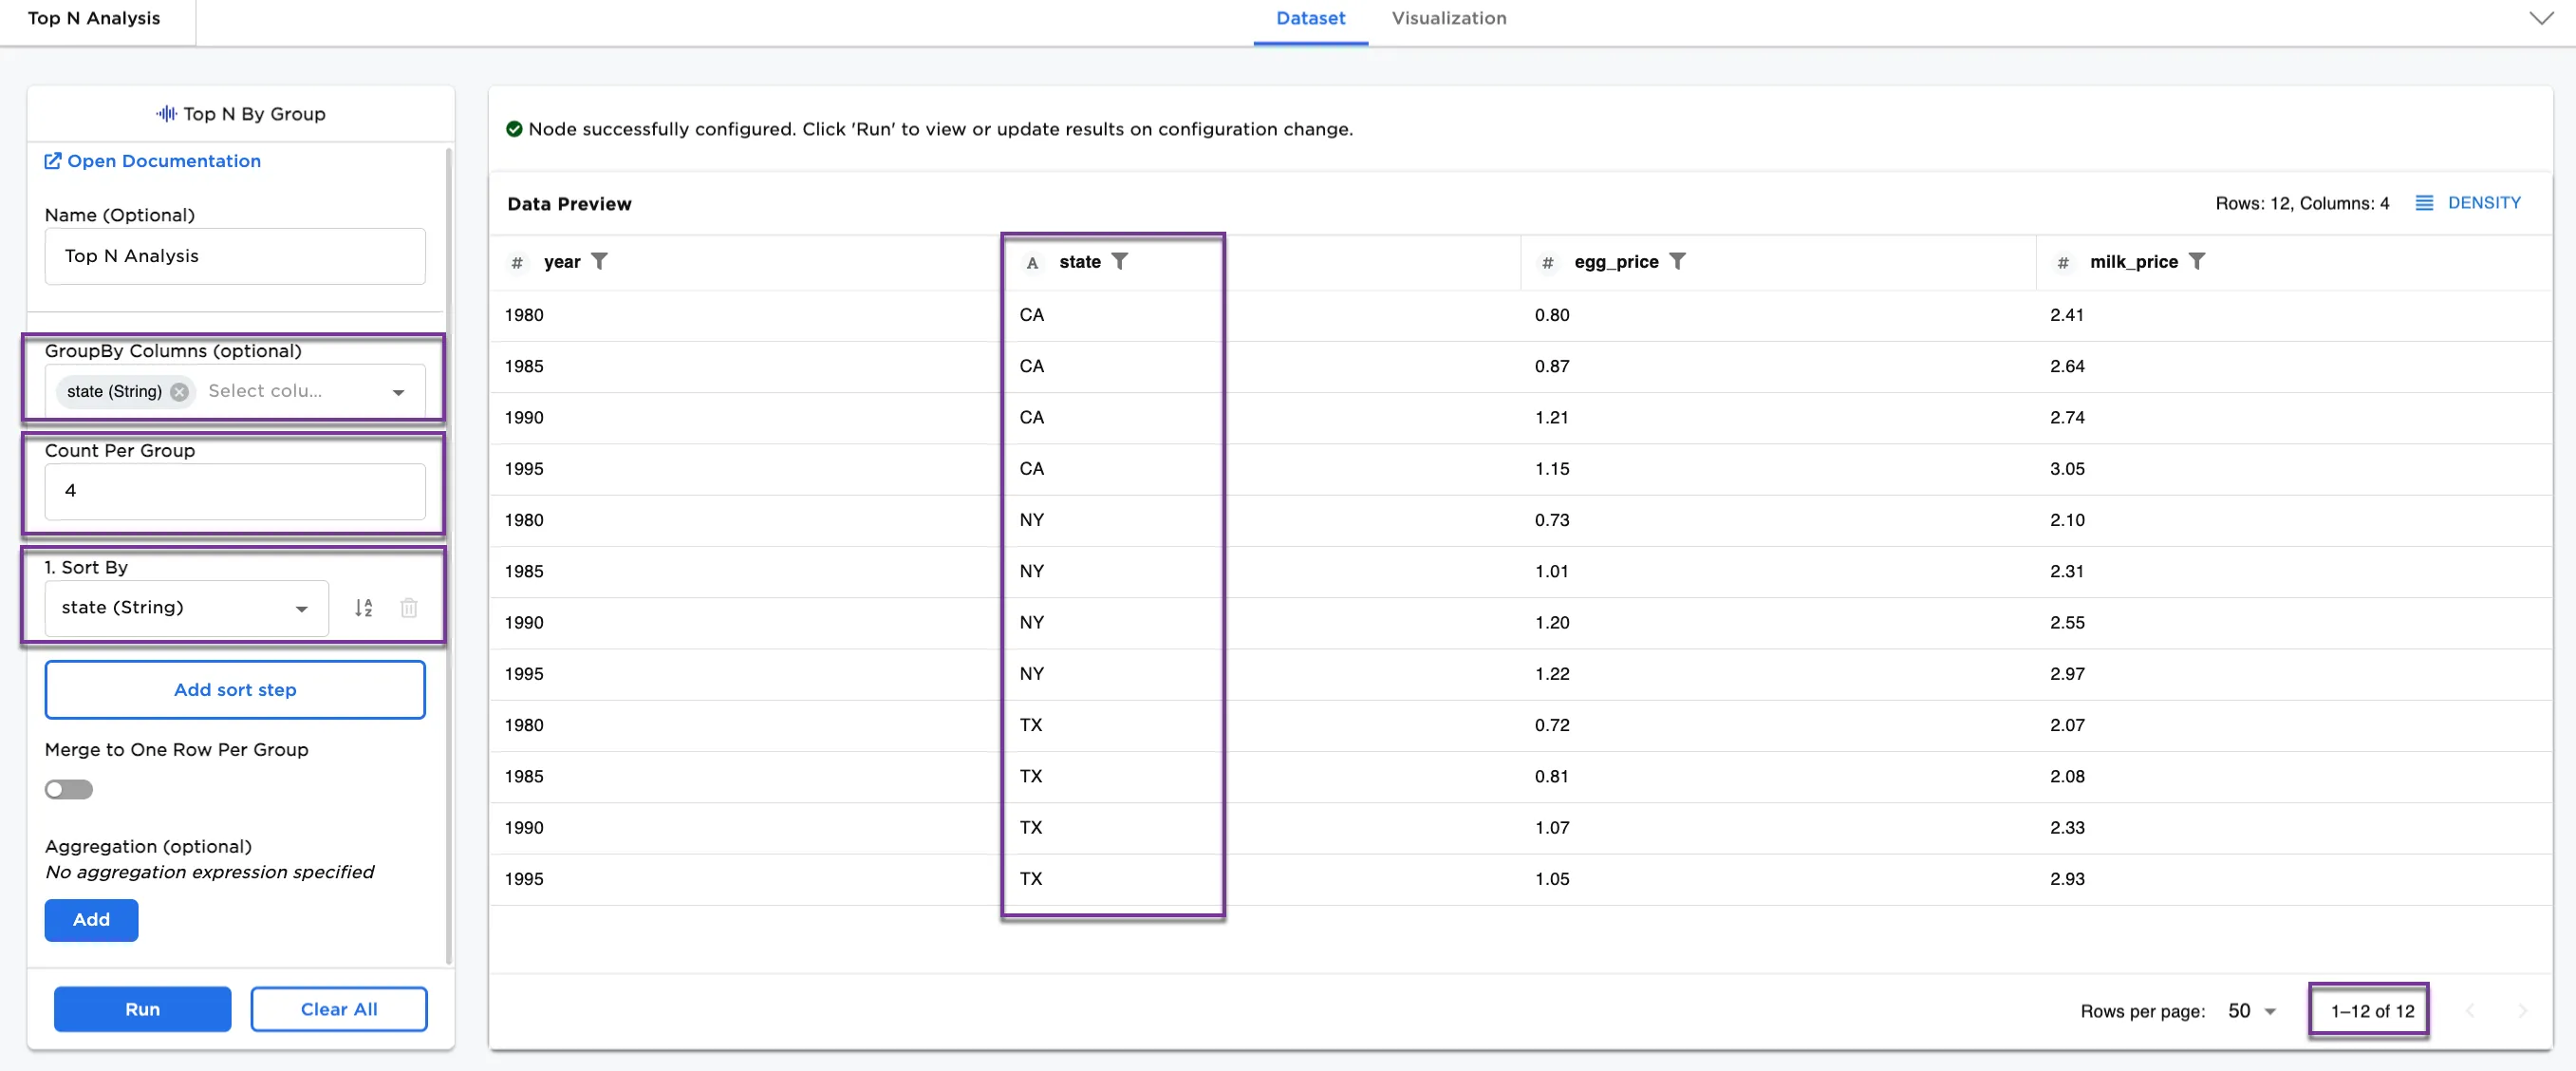
Figure 3a: Example showing group by and sorting by state
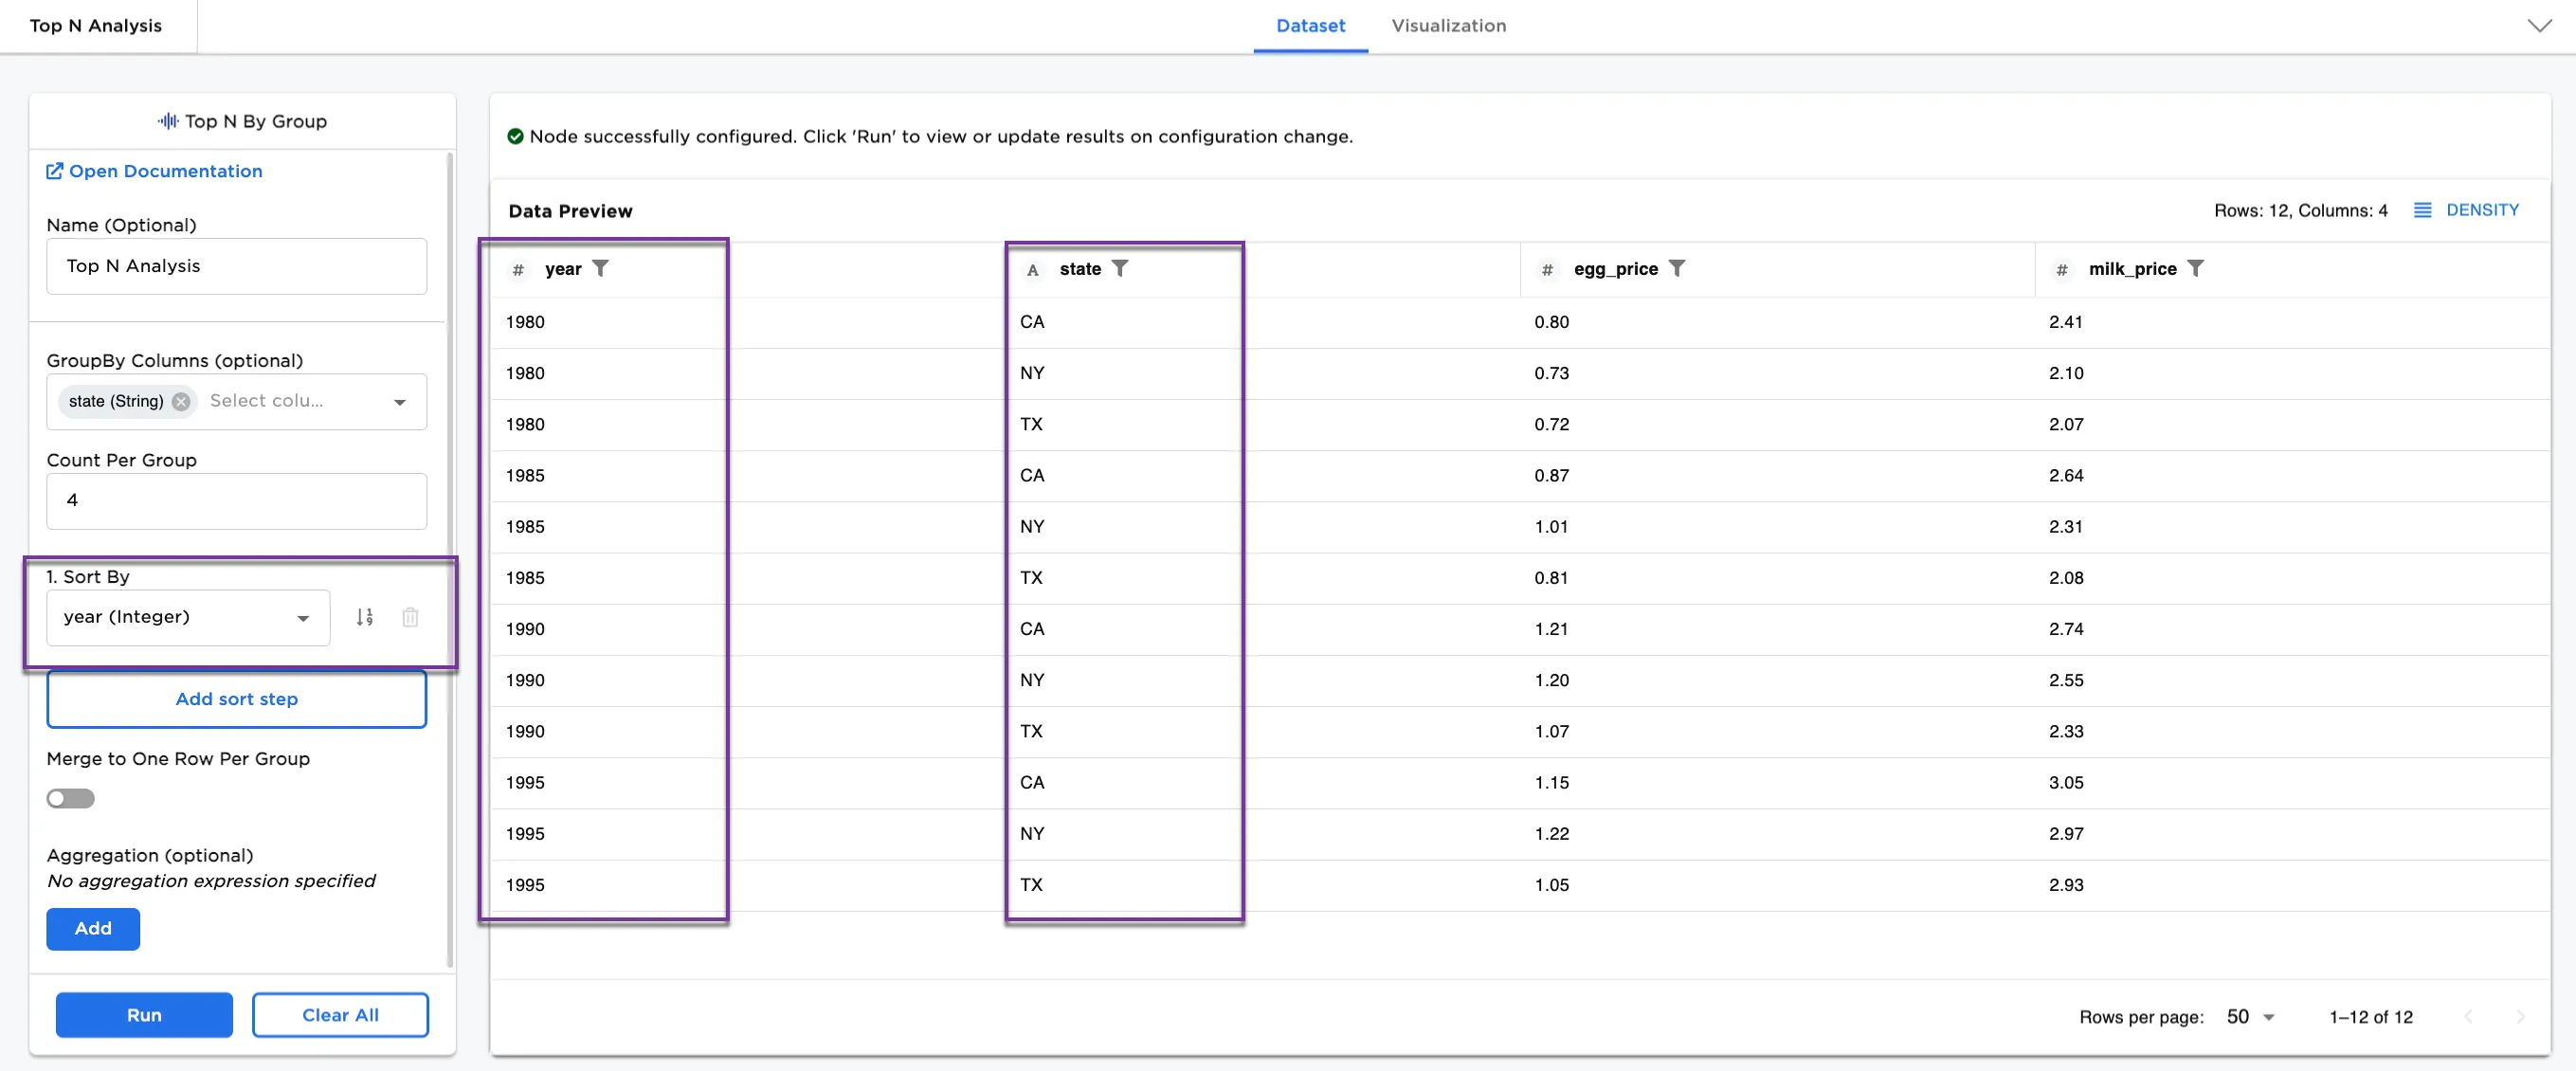
Figure 3b: Example showing group by and sorting by year
Optionally, explore the Merge to One Row Per Group and Aggregation (optional) configurations.
- Toggle the Merge to One Row Per Group on.
- Select Add and create the following aggregations:
- Colum/Method:
egg_price/Maximum - Colum/Method:
egg_price/Average - Colum/Method:
milk_price/Maximum - Colum/Method:
milk_price/Average
Notice that Figure 4a shows the maximum and average prices for eggs and milk in CA, NY, and TX using the first four values in the dataset.
Optionally, change the Count Per Group from 4 to 6.
Using the first six values changes the maximum and average values in the dataset. Notice how the egg and milk prices have changed between Figure 4a and Figure 4b.
Another option is to reverse the sort order. The original sort order is ascending. Try reversing the sort order and notice how the egg and milk prices have changed between Figure 4b and Figure 4c.
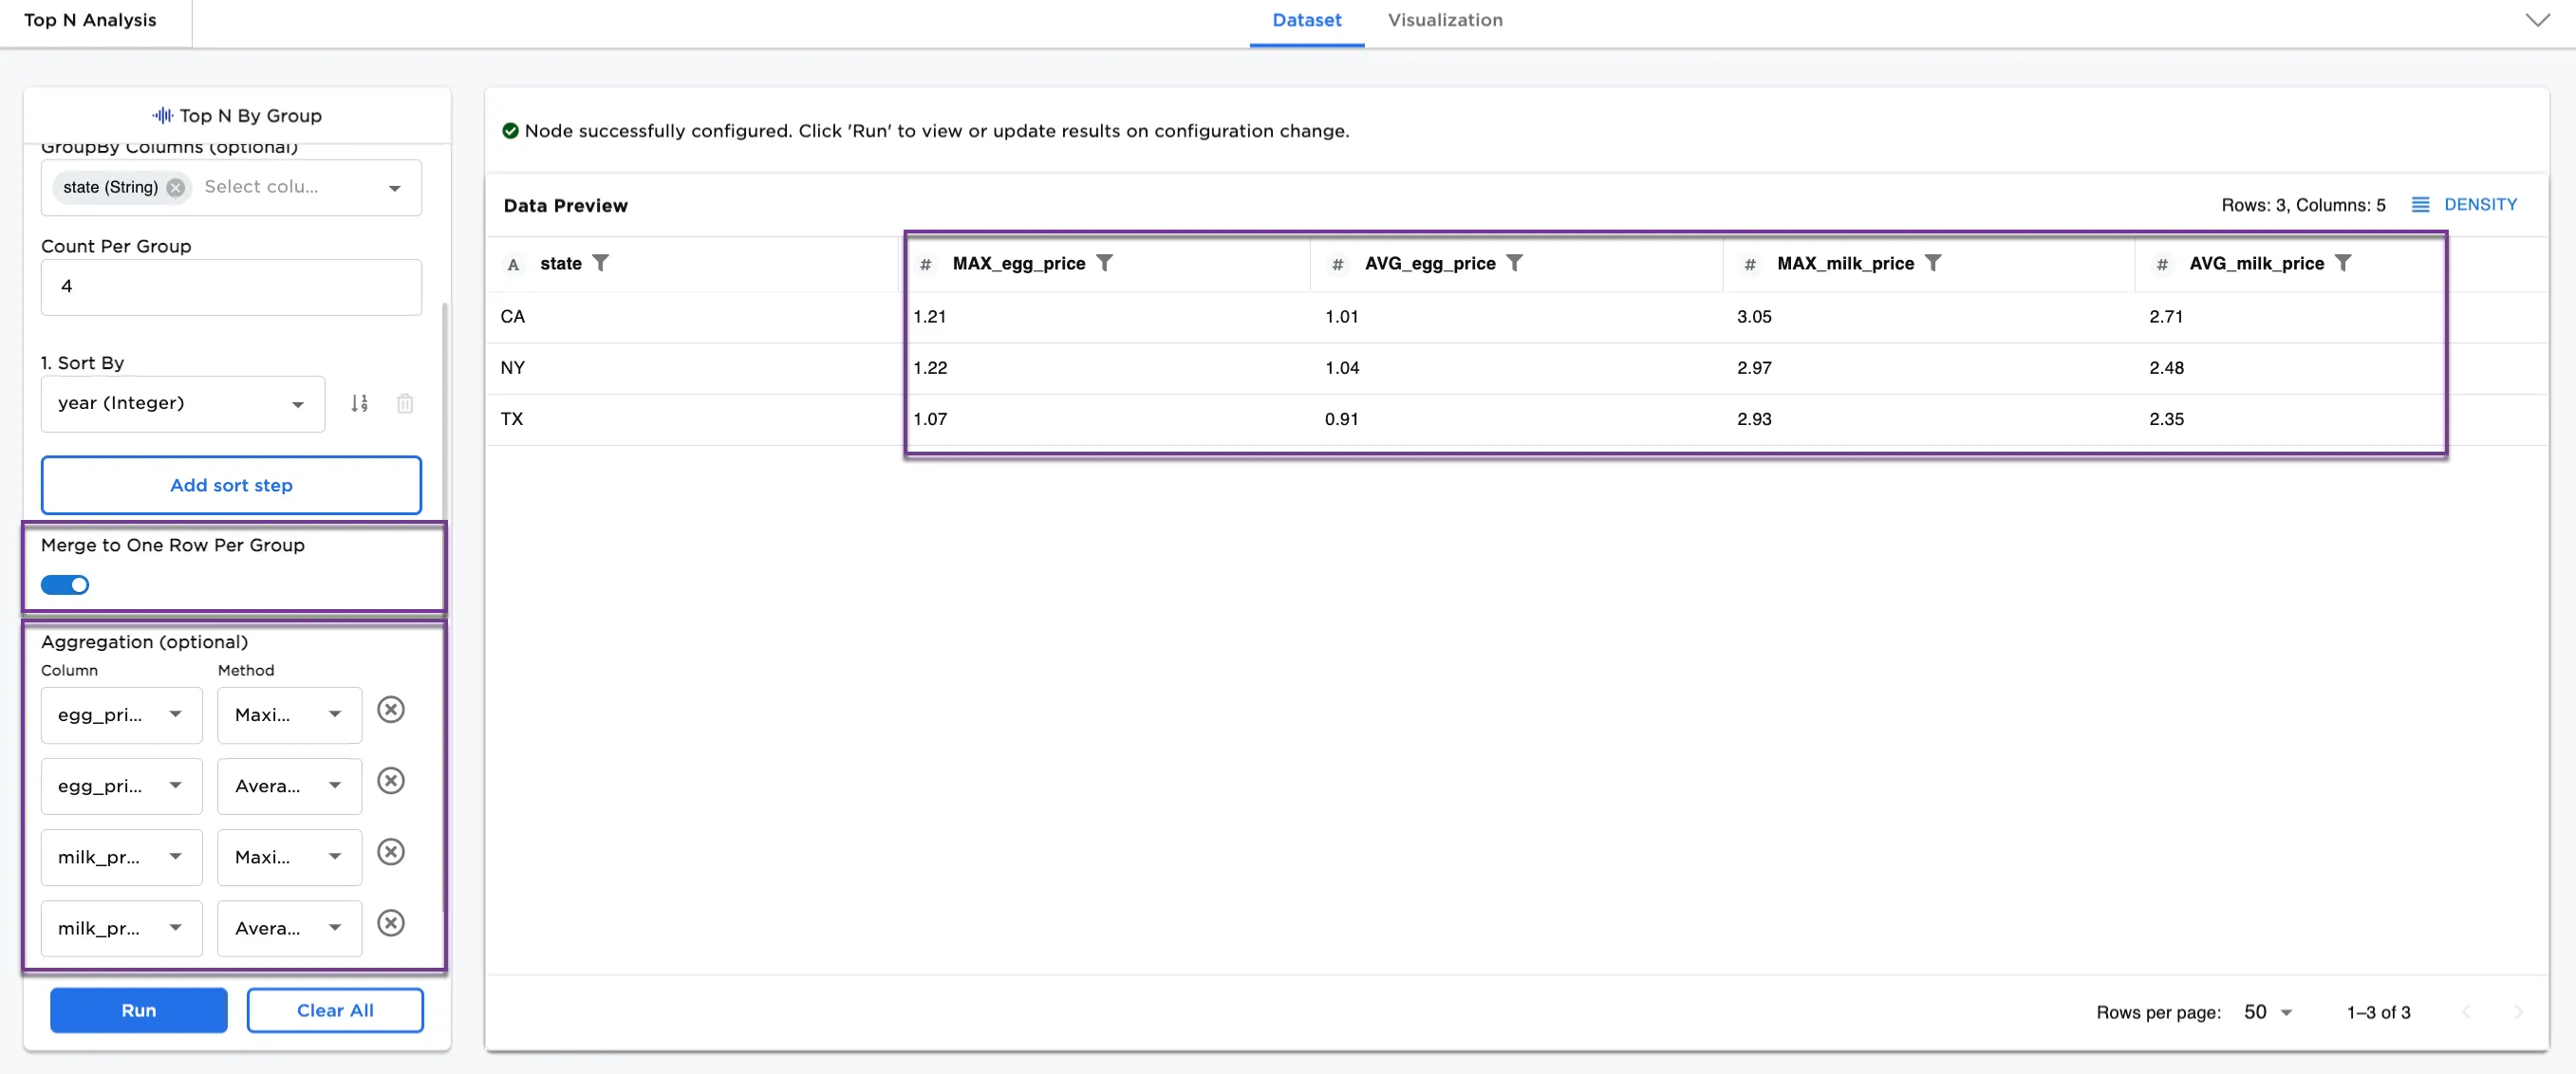
Figure 4a: Example with merge to one row per group and aggregation
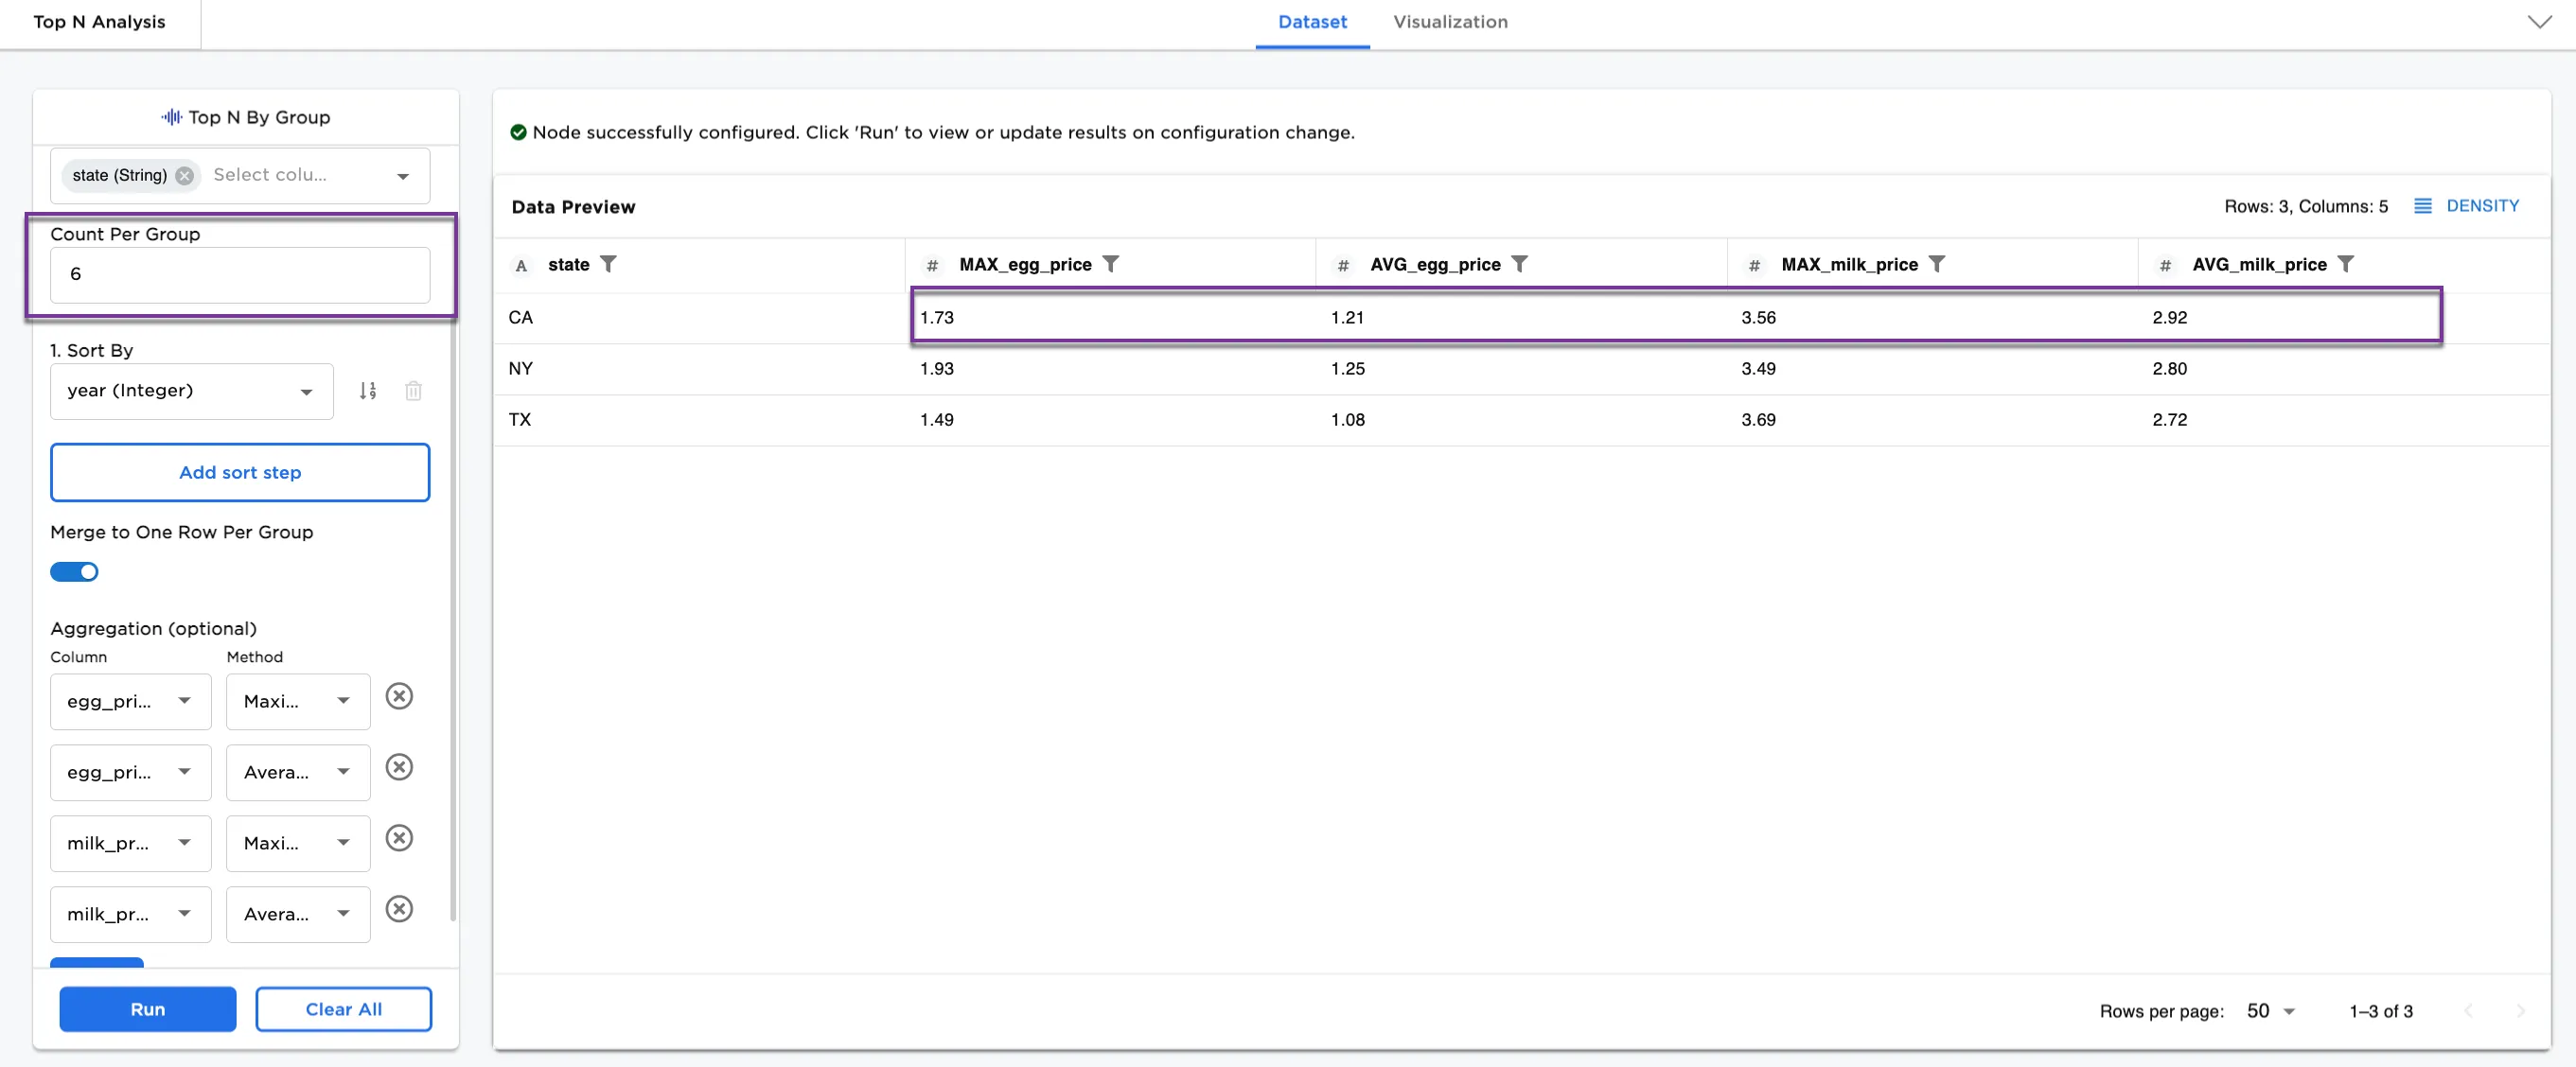
Figure 4b: Example changing the count per group
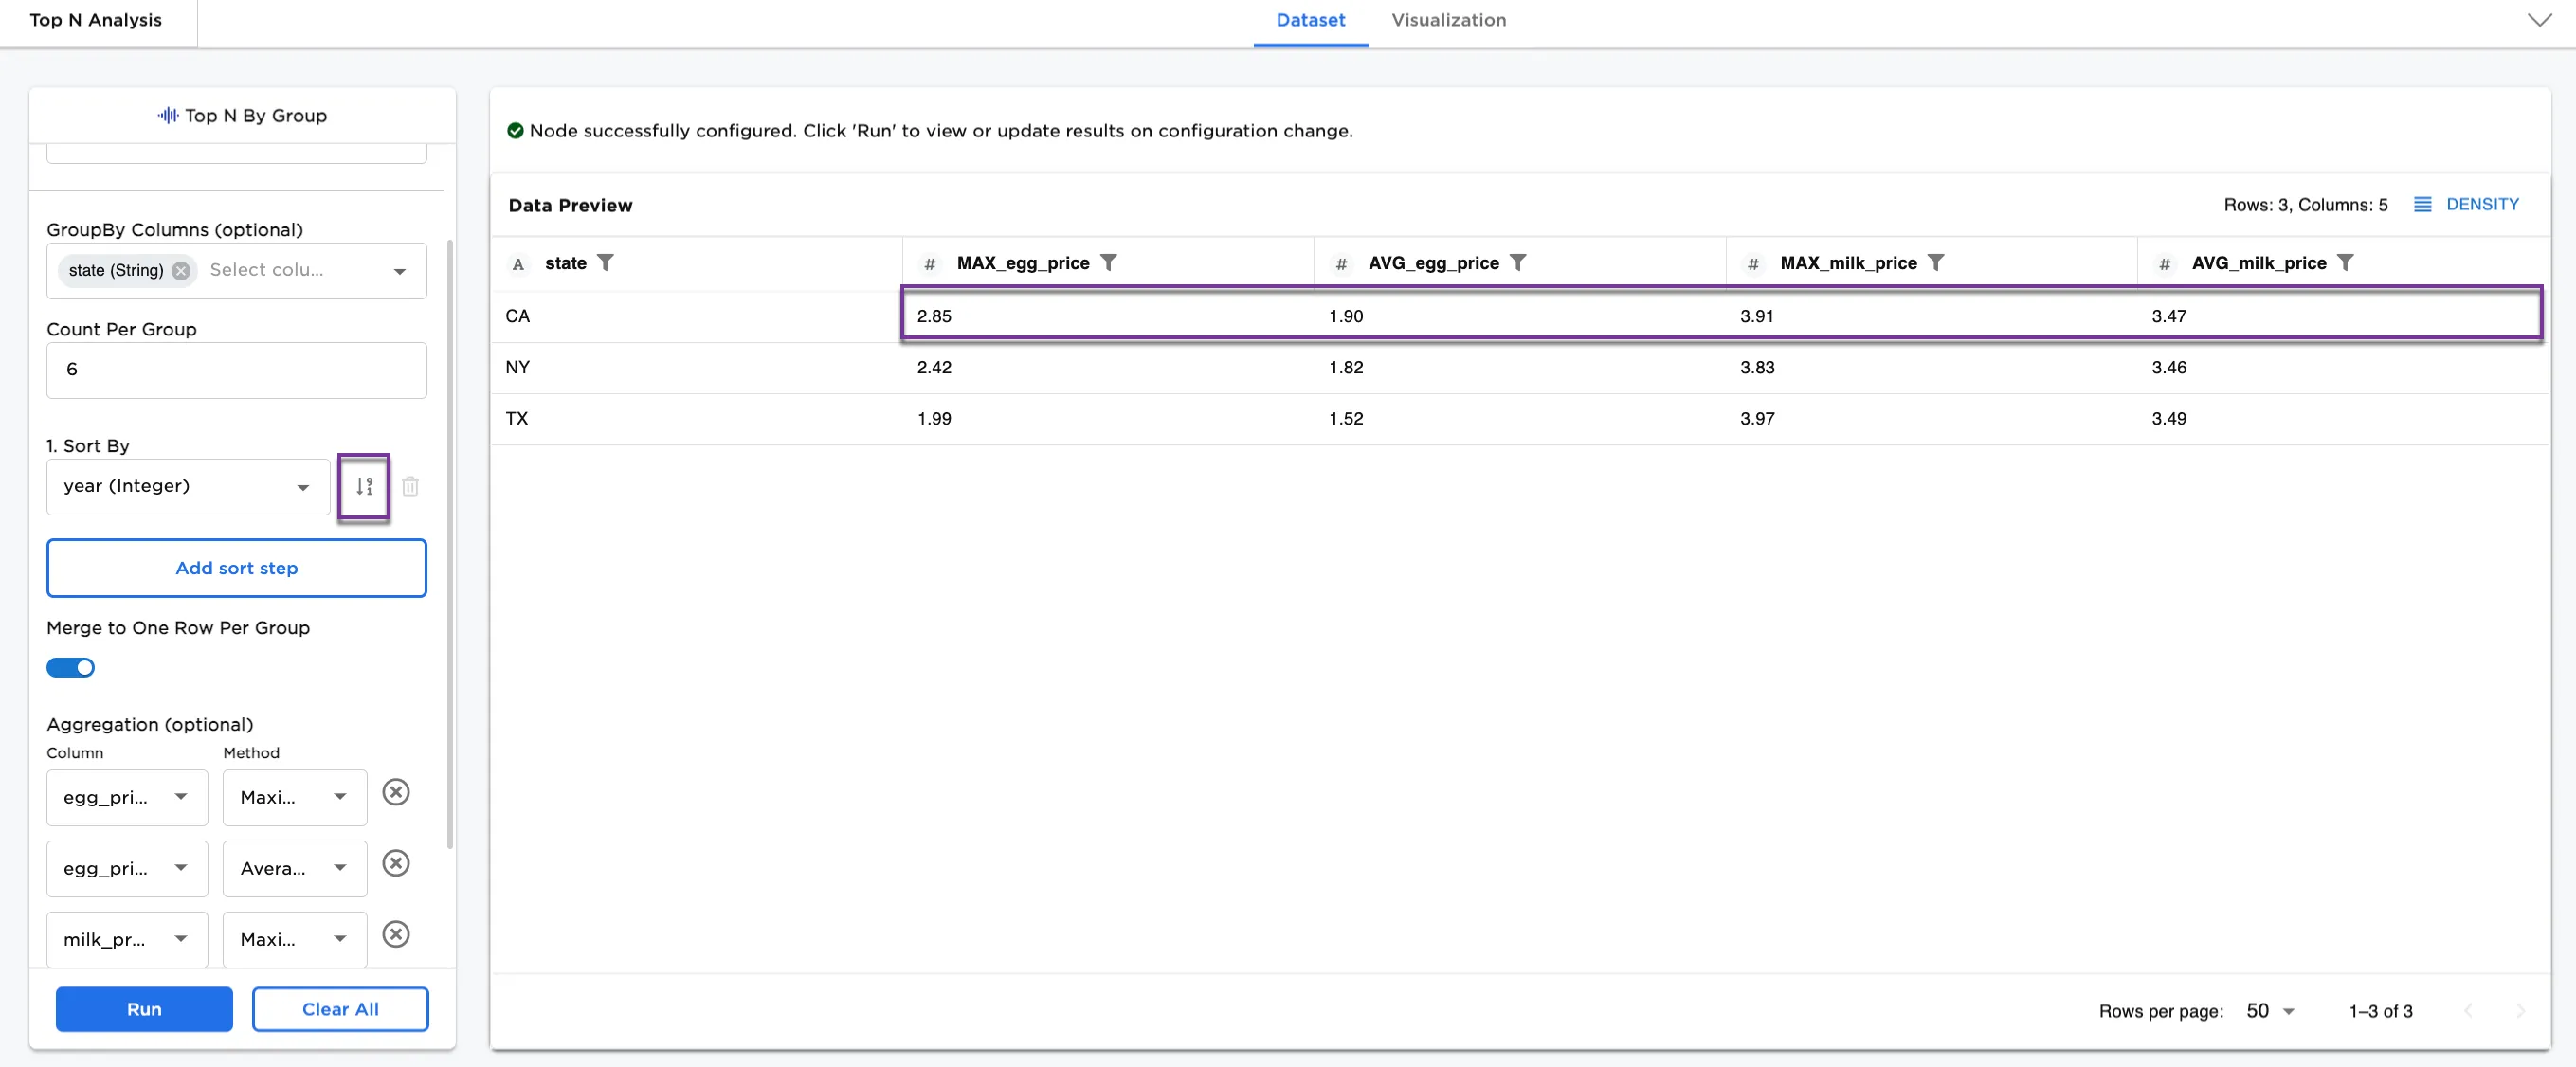
Figure 4c: Example reversing the sort order