Isolation Forest
Find anomalies using the isolation forest algorithm in Visual Notebooks. Isolation forest models isolate outliers using decision trees. These models are commonly used to identify fraud and mechanical failures.
Configuration
| Field | Description |
|---|---|
| Name default=none | Name of the node A user-specified node name displayed in the canvas, both on the node and in the dataframe as a tab. |
Select Feature Columns default=Select all columns as features | The columns to search for anomalies Use all columns as features or select specific columns from the dropdown menu. |
Advanced Configuration
Optionally alter the advanced configuration fields to control the output of the node.
Hyperparameters Search
Visual Notebooks trains many different models with various hyperparameter combinations. The fields in this section determine the hyperparameter options used during training. Although you don't need to alter these fields to train a high-performing model, it can be interesting to explore different combinations.
Hyperparameters give you precise control over a model. In general, the goal of changing the hyperparameters is to make the best possible model while avoiding overfitting. A model is considered overfit when it is too closely aligned to the training data to produce accurate predictions on unseen data.
| Field | Description |
|---|---|
Hyperparameters Search default=Search | Train one model or multiple models Select Search to train multiple models with different hyperparameter combinations and then compare the models to find the best one. Select Fixed to train a single model with a fixed hyperparameter configuration. |
Number of Trees in Forest default=20, 50, 100, 150, 200 | The number of trees to build Enter an integer between 1 and 10,000. More trees create a more accurate model, but can lead to overfitting. Values between 50 and 200 are common. If you define a fixed model, the default is 50. |
Maximum Tree Depth default=4, 8, 12, 16, 20, 40 | The maximum number of levels in each tree Enter an integer between 0 and 100. Setting this value to 0 specifies no limit. Increasing the tree depth allows the model to fine-tune its performance, but may lead to overfitting. If you define a fixed model, the default is 20. |
Sample Size default=256 | The number of samples to use to train each tree If Define Fixed is selected, specify the number of randomly sampled observations used to train each tree. |
Contamination Property
The contamination property tells the isolation forest model what percentage of the data you expect to be anomalous. A contamination value is not required to train a model, but must be provided in order to generate Boolean predictions for anomalies.
| Field | Description |
|---|---|
Contamination default=Don't Specify Contamination | The proportion of anomalies The contamination ratio is the percentage of anomalies in the input dataset. If Don't Specify Contamination is selected, models do not calculate Boolean predictions for anomalous values. |
Validation Settings
An isolation forest model attempts to find previously unidentified anomalies in data. Since the results are unknown before training, there isn't a way to validate the model's predictions.
Additional test and validation methods will be implemented at a later date. When that occurs, use this field to determine whether the model is consistent when given additional data.
| Field | Description |
|---|---|
Select test and validation method default=No Validation | Validation method Additional test and validation methods are coming soon. |
Initialization Seed
Random numbers are used throughout the training process for splitting the original dataset, splitting individual trees, and optimizing hyperparameters. Ex Machina uses one number, called a seed, to generate those random numbers. The field in this section allows you to enter a custom seed. If you enter a custom seed, you can enter that same custom seed at a later date to reproduce the results of training.
| Field | Description |
|---|---|
Seed default=Random | The number used throughout the AutoML process Select Random to use a random number, or select Custom to enter a specific integer. |
Output Column Names
| Field | Description |
|---|---|
Prediction default=prediction | The column with the model's predictions Enter a name for the column that contains the selected model's predictions. Column names can contain alphanumeric characters and underscores, but cannot contain spaces. This column contains a value of True if the data point is considered an anomaly, and contains a value of False if the data point is normal. If Don't Specify Contamination is selected for the Contamination field, the prediction column will not be visible in the resulting dataframe. |
Anomaly Score default=anomaly_score | The column with the anomaly score Enter a name for the column that contains the anomaly scores. Column names can contain alphanumeric characters and underscores, but cannot contain spaces. The anomaly score is typically between 0 and 1. Data points with higher scores are more anomalous. |
Mean Length default=mean_length | The column with the mean length Enter a name for the column that contains the mean length. Column names can contain alphanumeric characters and underscores, but cannot contain spaces. The mean length is the average number of splits it takes to isolate a data point across all decision trees in the isolation forest. Values with low scores close to 1 are more likely to be anomalous since it takes fewer partitions of the data to isolate them. |
Prediction
The output of this node is each model's predictions on the training data. This section determines how the predictions are portrayed in the resulting dataframe.
| Field | Description |
|---|---|
Prediction Column Name default=prediction | The column name for the model's predictions Enter a name for the column that contains the selected model's predictions. Column names can contain alphanumeric characters and underscores, but cannot contain spaces. |
Dataset Selection default=Train Dataset | Data used to display a model's predictions Visual Notebooks displays a selected model's predictions on the dataset selected with this field. |
| Include all columns default=off | Whether to include all columns in the predictions table Toggle this field on to include all columns in the predictions table, including the columns that you did not use as features for the model. By default, only columns you selected as features will be included. |
Node Inputs/Outputs
| Input | A Visual Notebooks dataframe |
|---|---|
| Output | Trained isolation forest models and a dataframe with predictions on the training data |
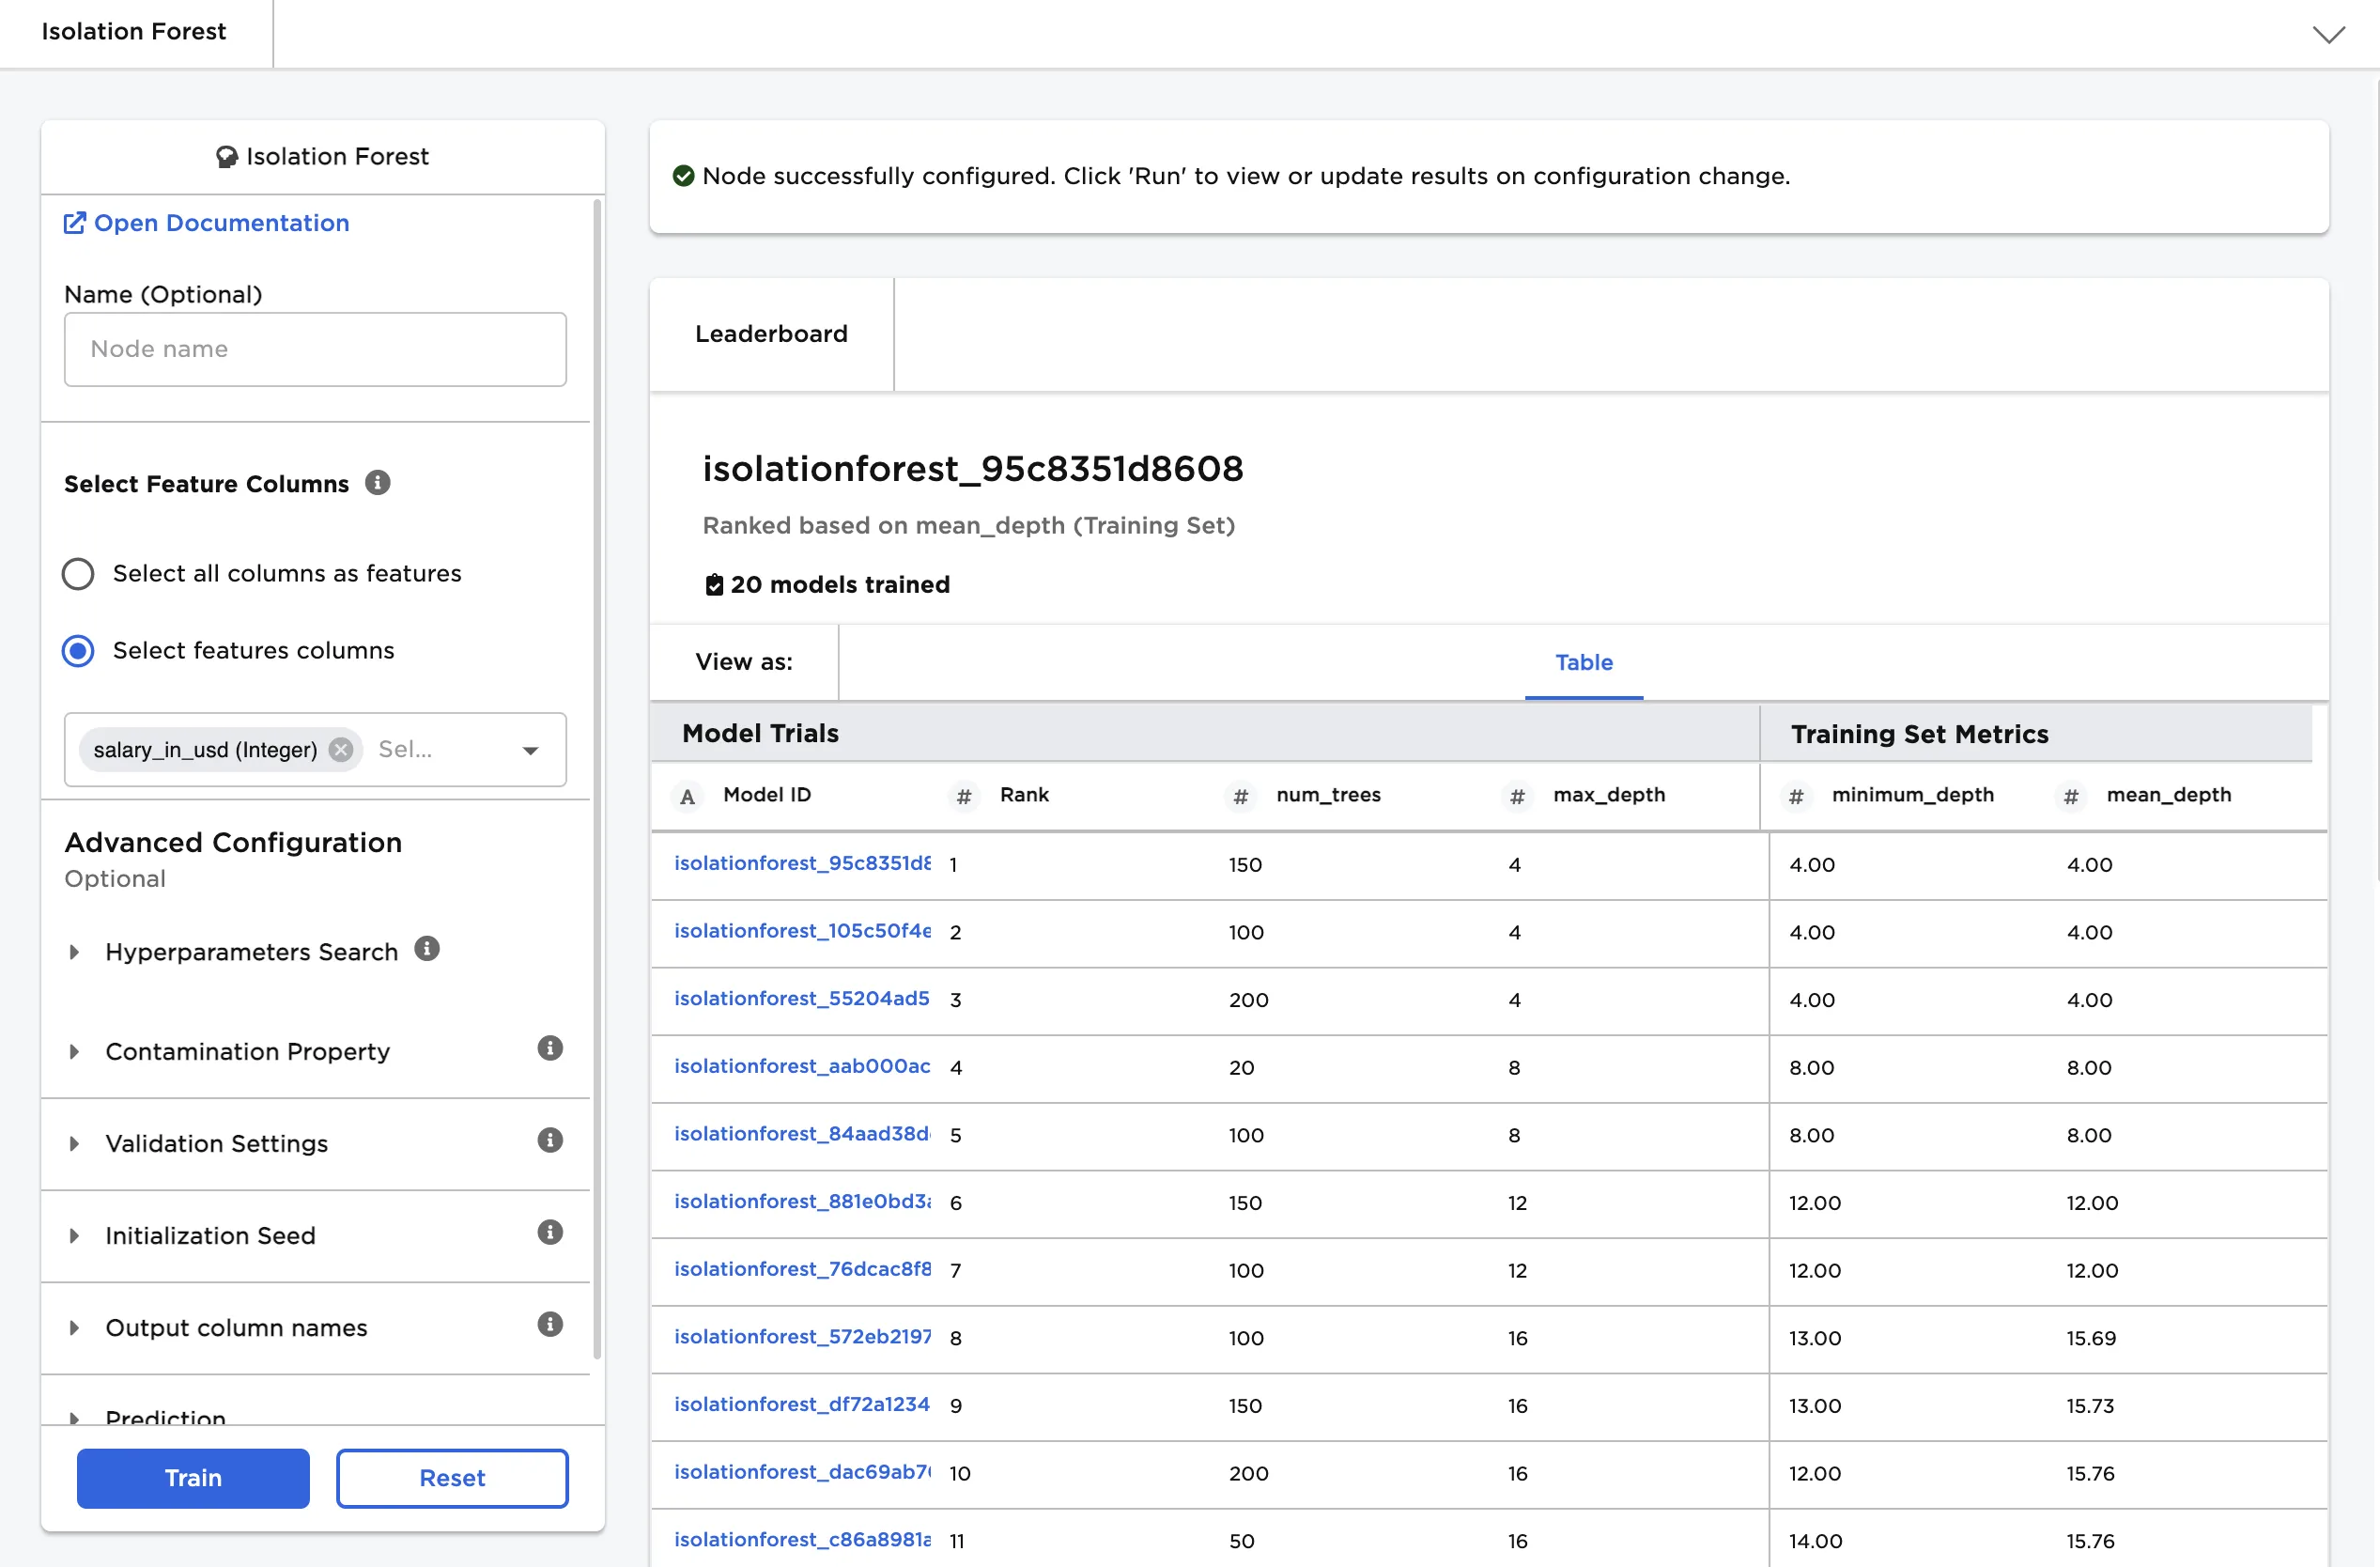
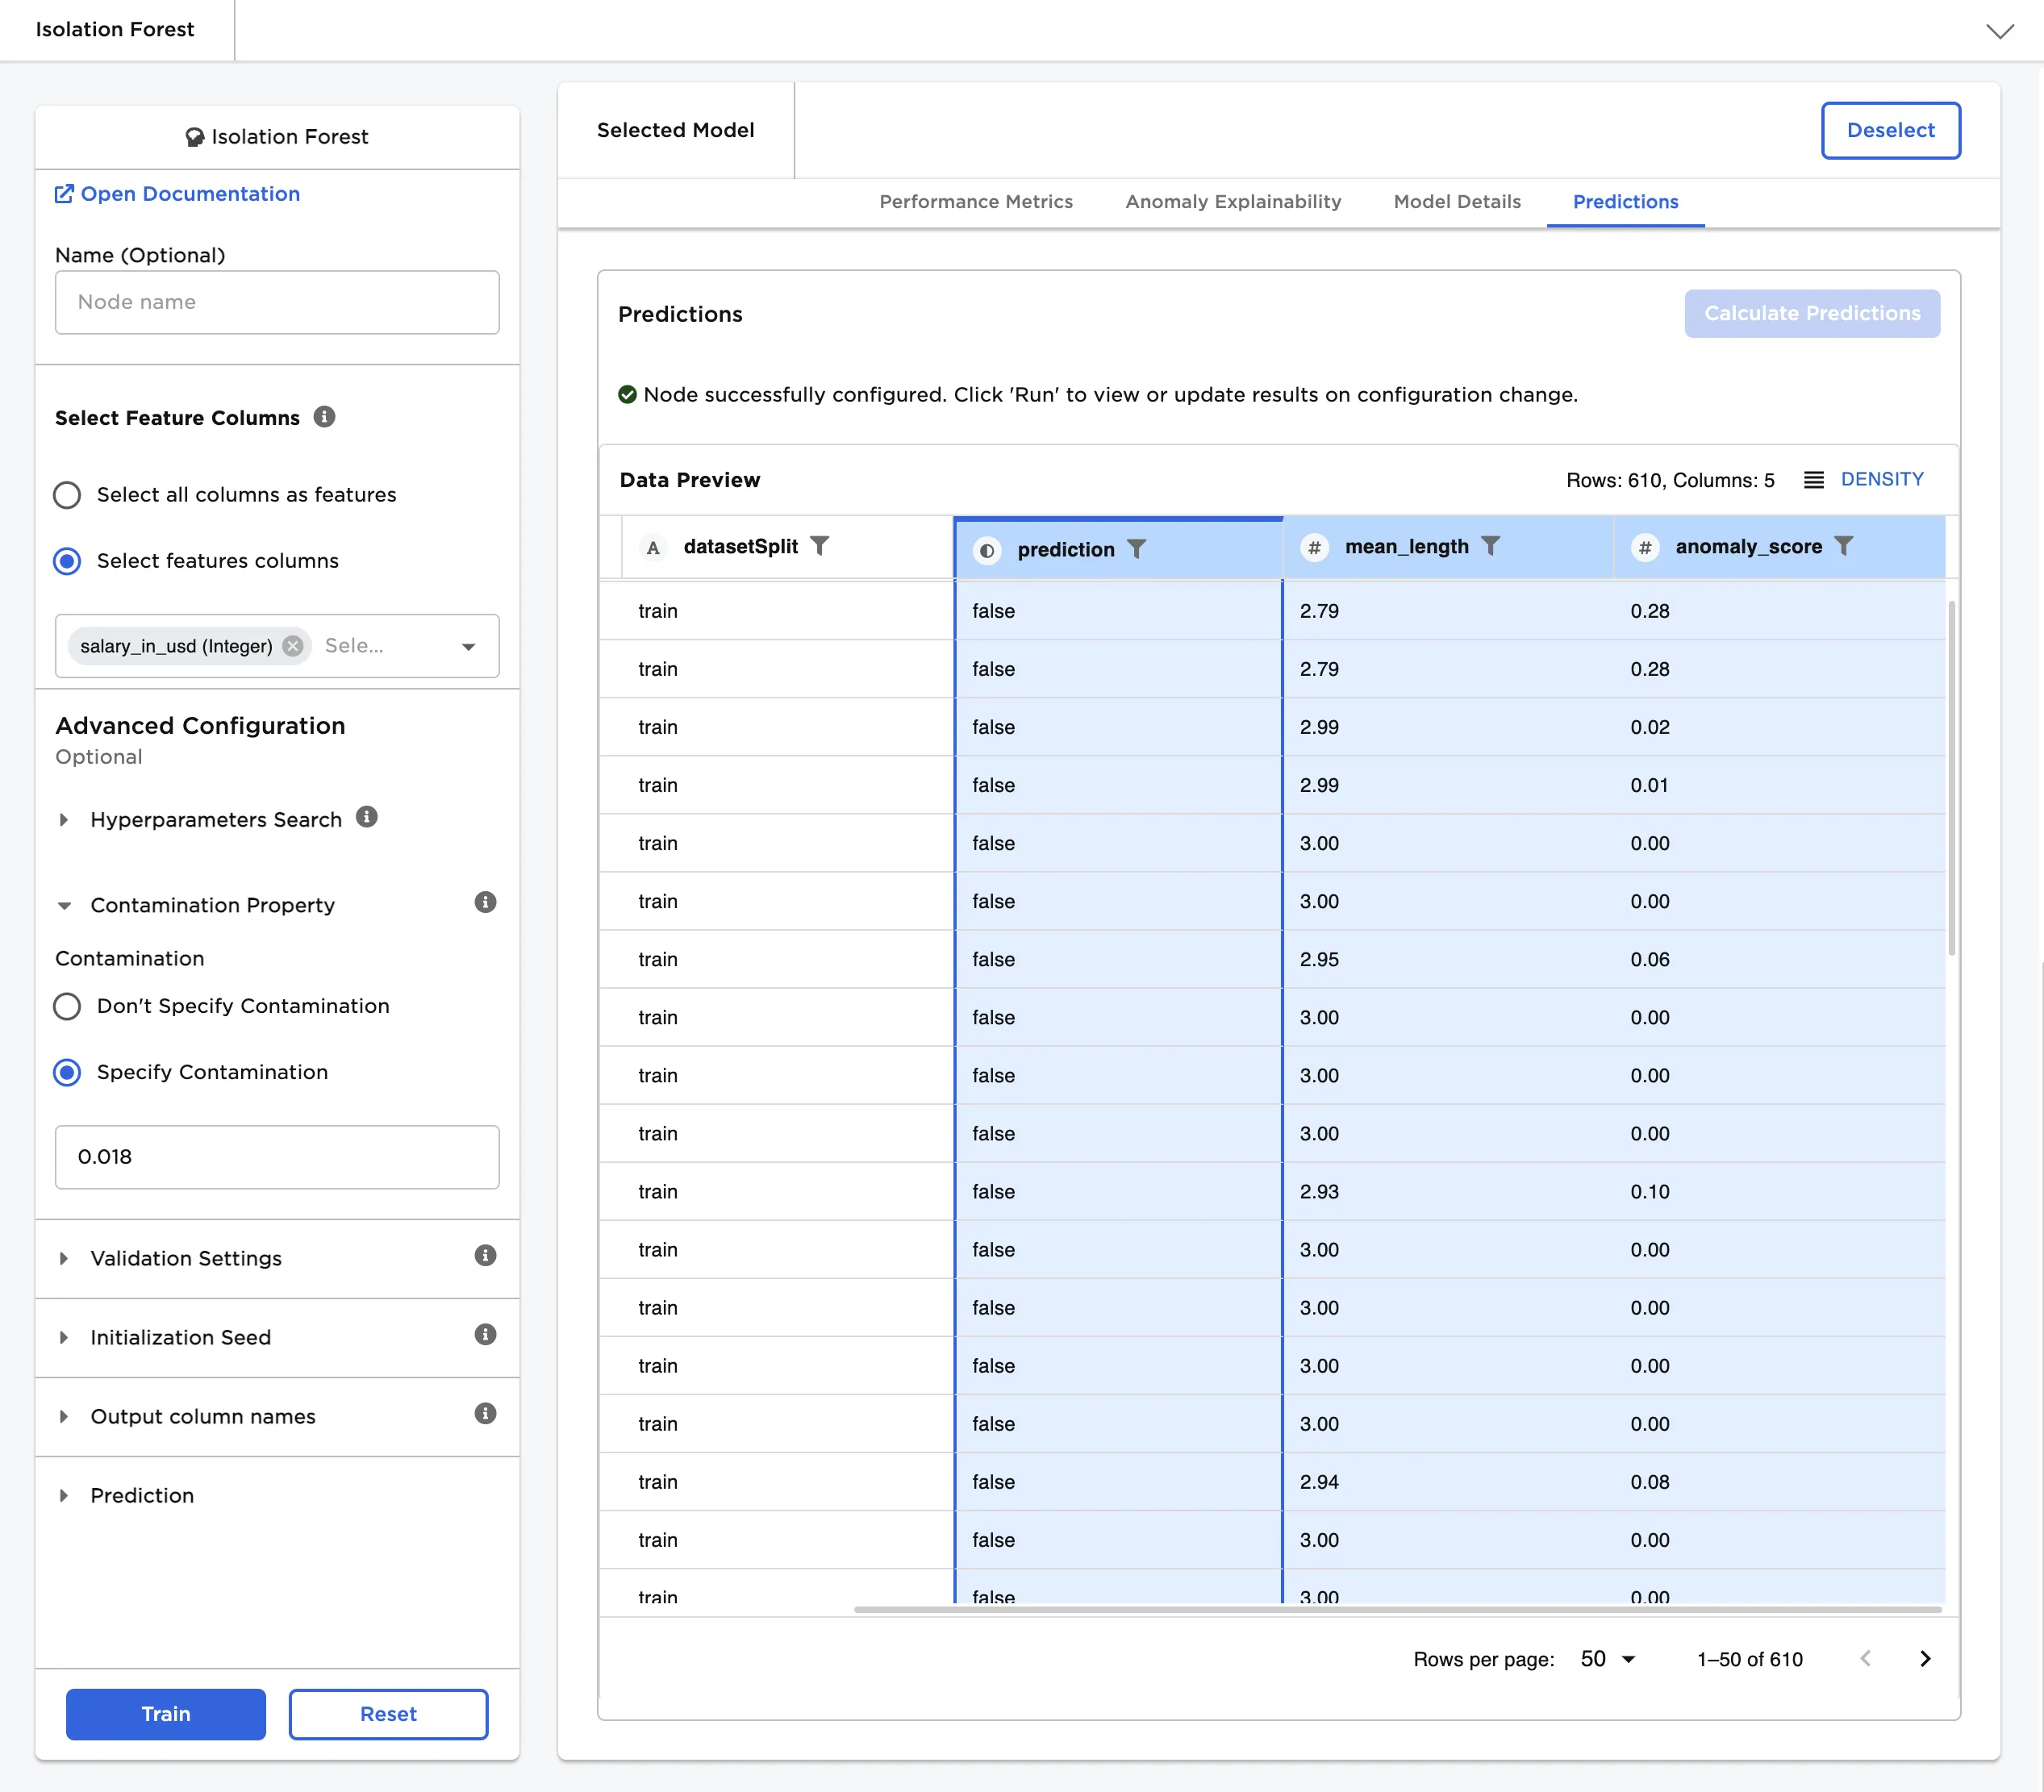
Figure 1: Example output
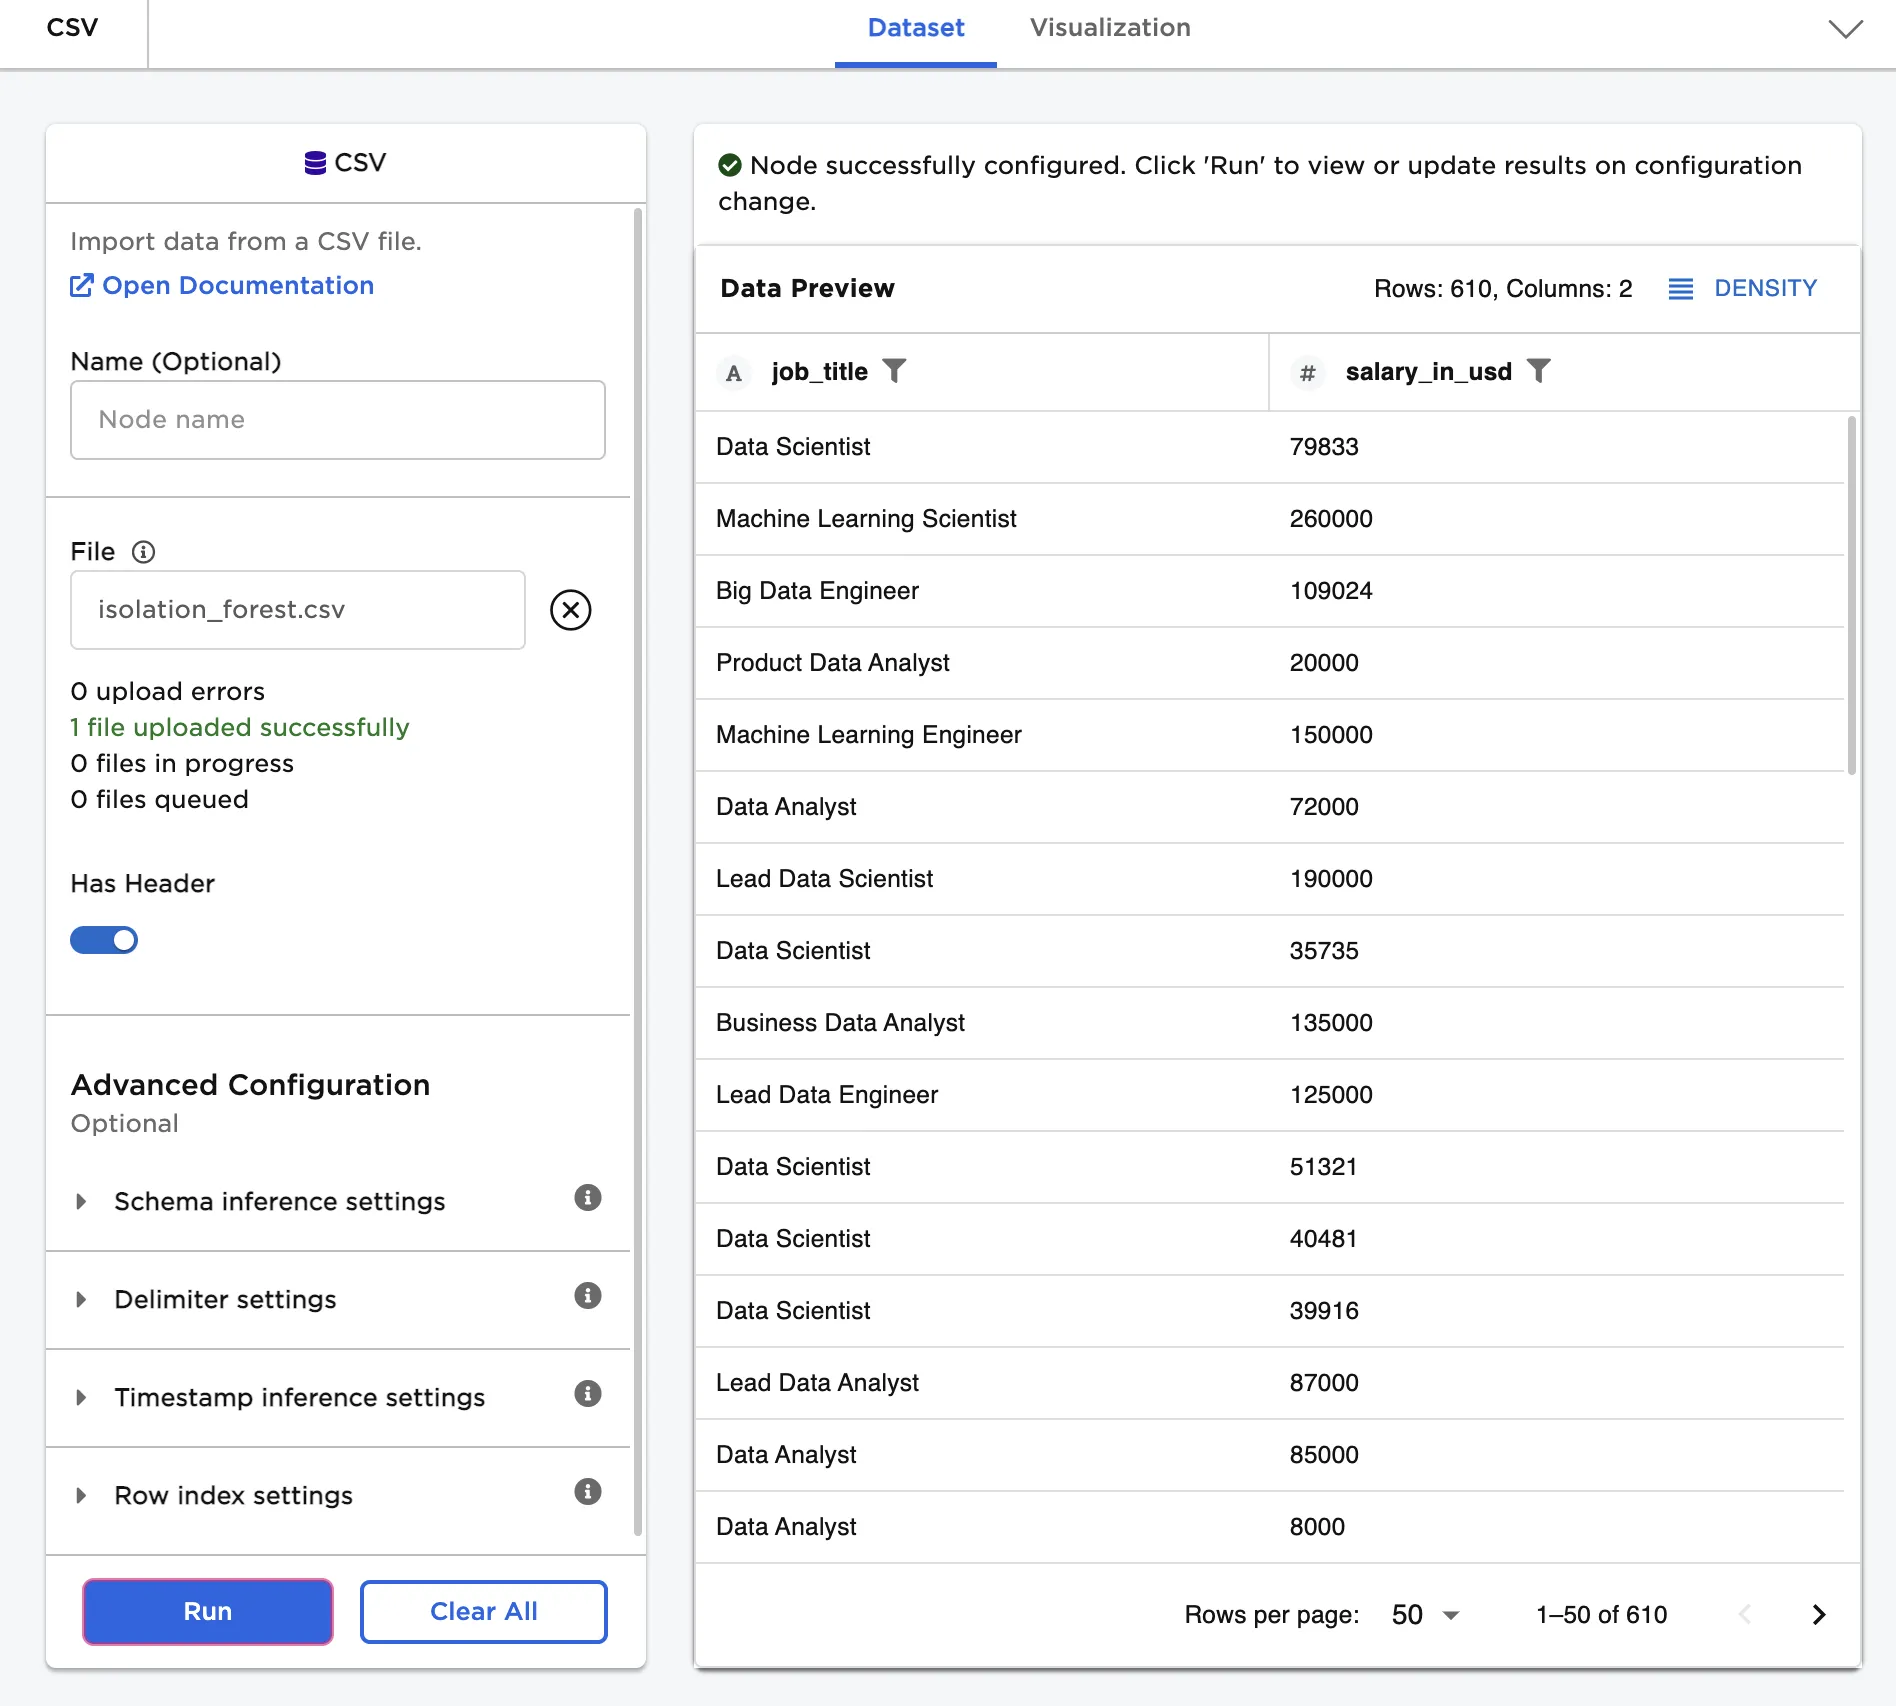
Examples
The dataframe shown in Figure 2 contains the job title and yearly salary of more than 600 data science professionals. Use the Isolation Forest node to find any unusually high or unusually low salaries.