Numeric Missing Data
Use the Numeric Missing Data node in Visual Notebooks to fill in missing numeric values (impute missing values).
Configuration
| Field | Description |
|---|---|
| Name default=none | Name of the node A user-specified node name displayed in the workspace, both on the node and in the dataframe as a tab. |
| Select columns to scale Required | Column selection Select columns with missing values. |
Advanced Configuration-Output Options Keep Original Columns default=Off | Original column handling Toggle on to keep the original column in addition to scaled data, or toggle off to remove original columns. |
Advanced Configuration-Output Options Output column suffix default=_scaled | Column suffix Enter a suffix to append to the scaled columns. The suffix can only contain alphanumeric characters and underscores. |
Advanced Configuration Select Strategy default=Imputation with custom value | Strategy to use for columns with missing values Select what to do with missing values. Options include: Imputation with custom valueImputation using meanImputation using medianImputation using most frequentNone - Drop rows with missing features |
Advanced Configuration Custom Value default=0 | Enter a custom value Select a custom number to fill in if Imputation with custom value is selected for the strategy. |
Node Inputs/Outputs
| Input | A Visual Notebooks dataframe |
|---|---|
| Output | A dataframe with scaled data for missing values |
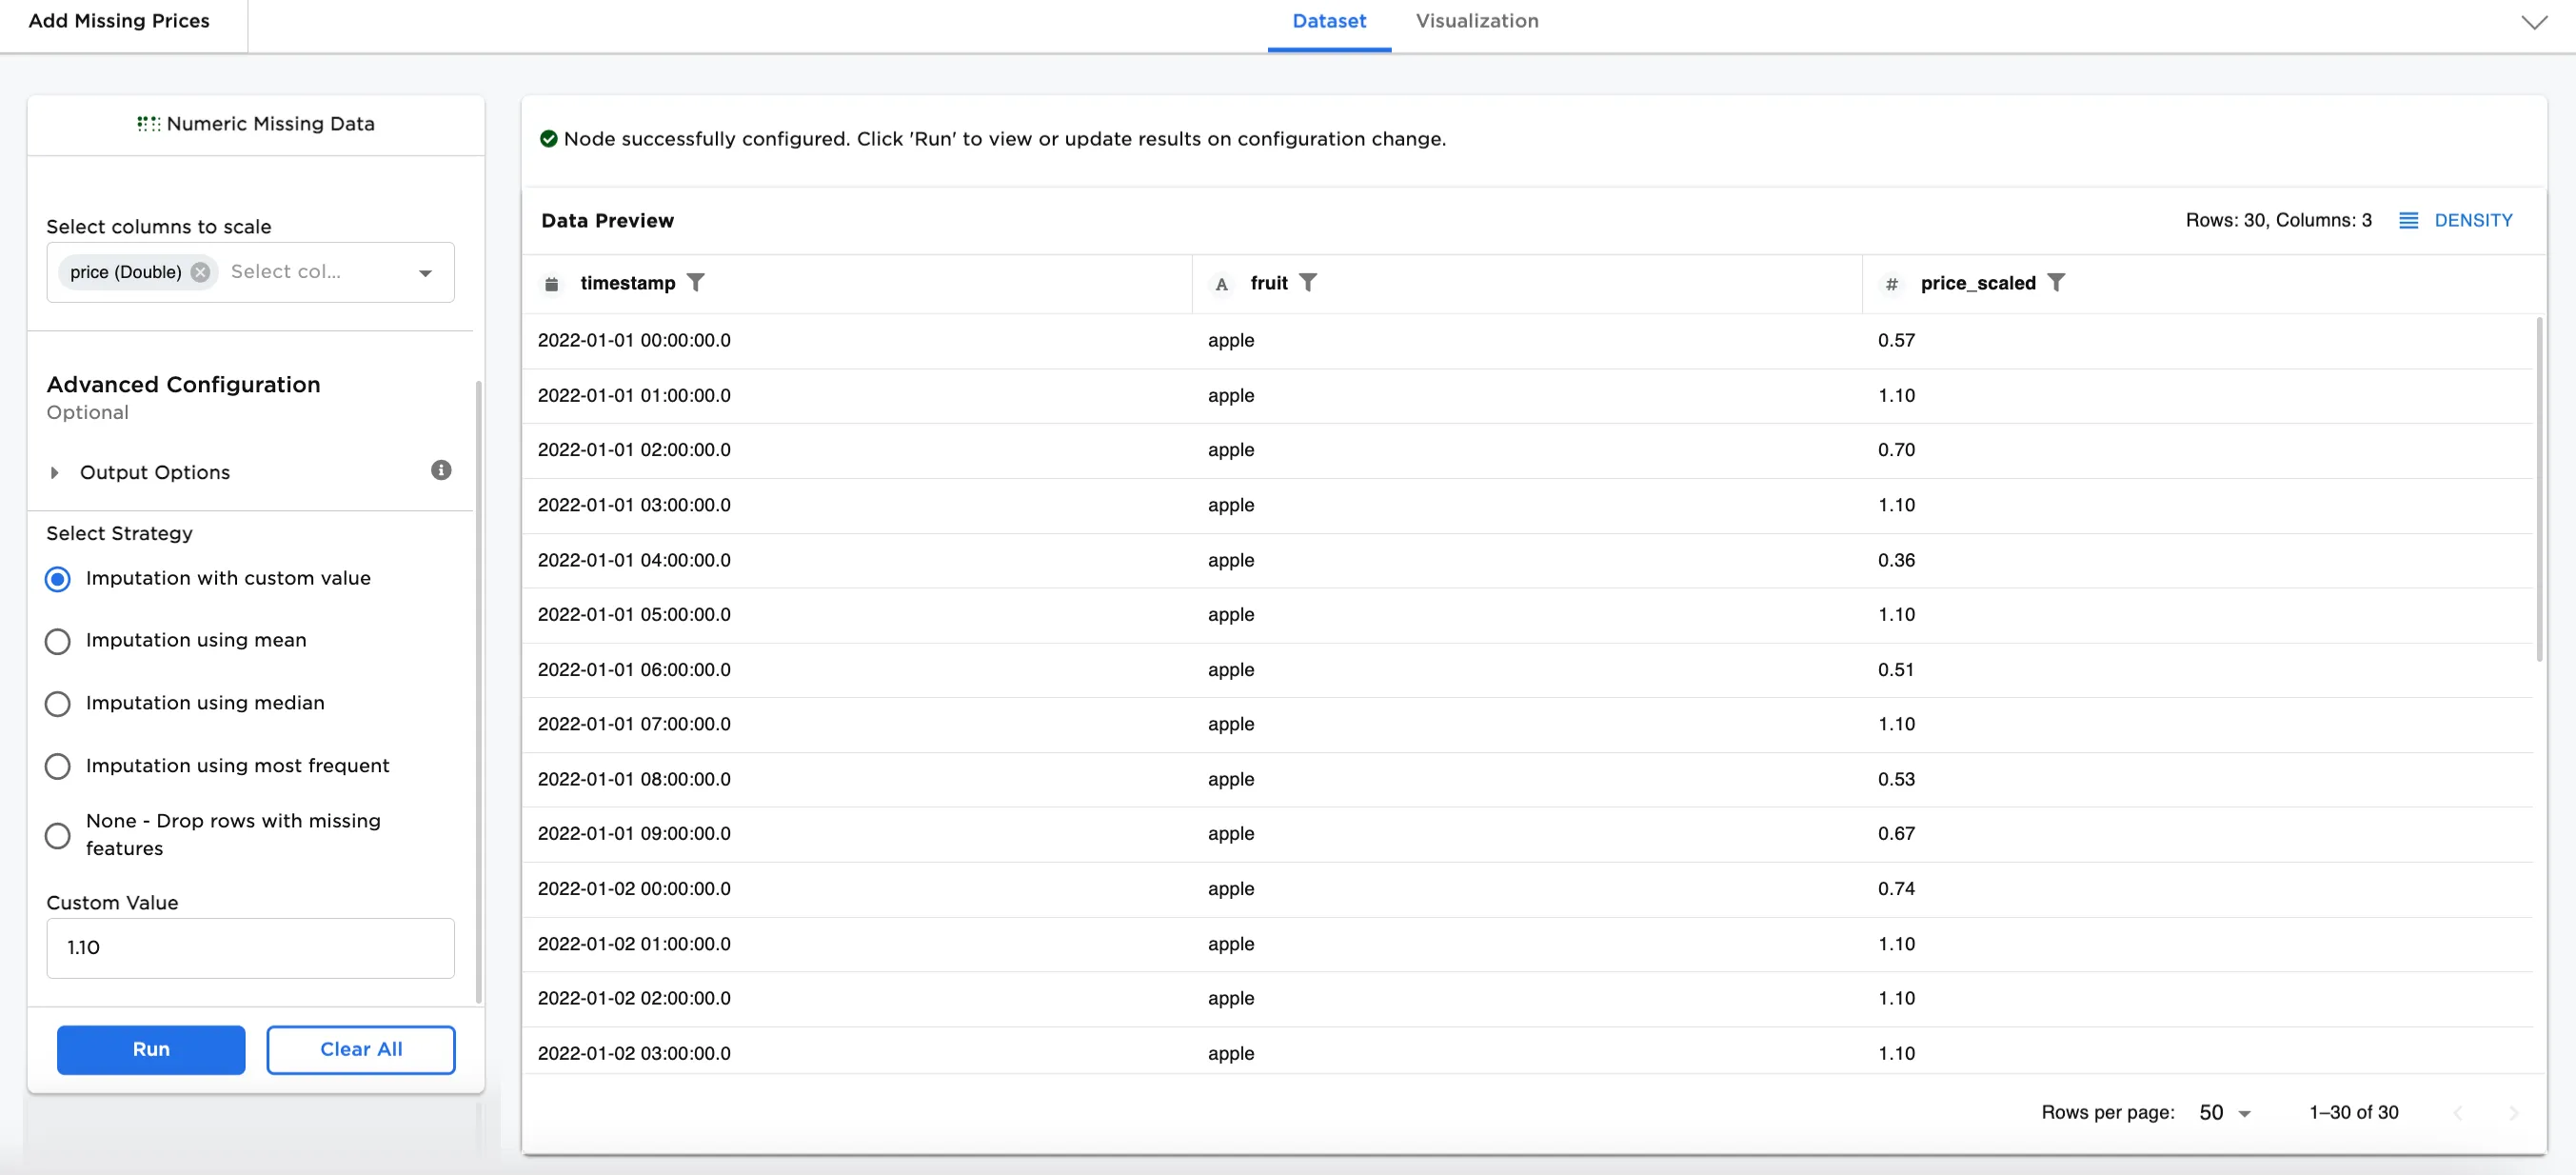
Figure 1: Example dataframe output
Examples
From time to time, you might find your dataset is missing values that are needed for machine learning. In the examples below, we are using a dataset that has missing prices (numeric values) for certain times of day for apples on 01/01/2022, 01/02/2022, and 01/03/2022.
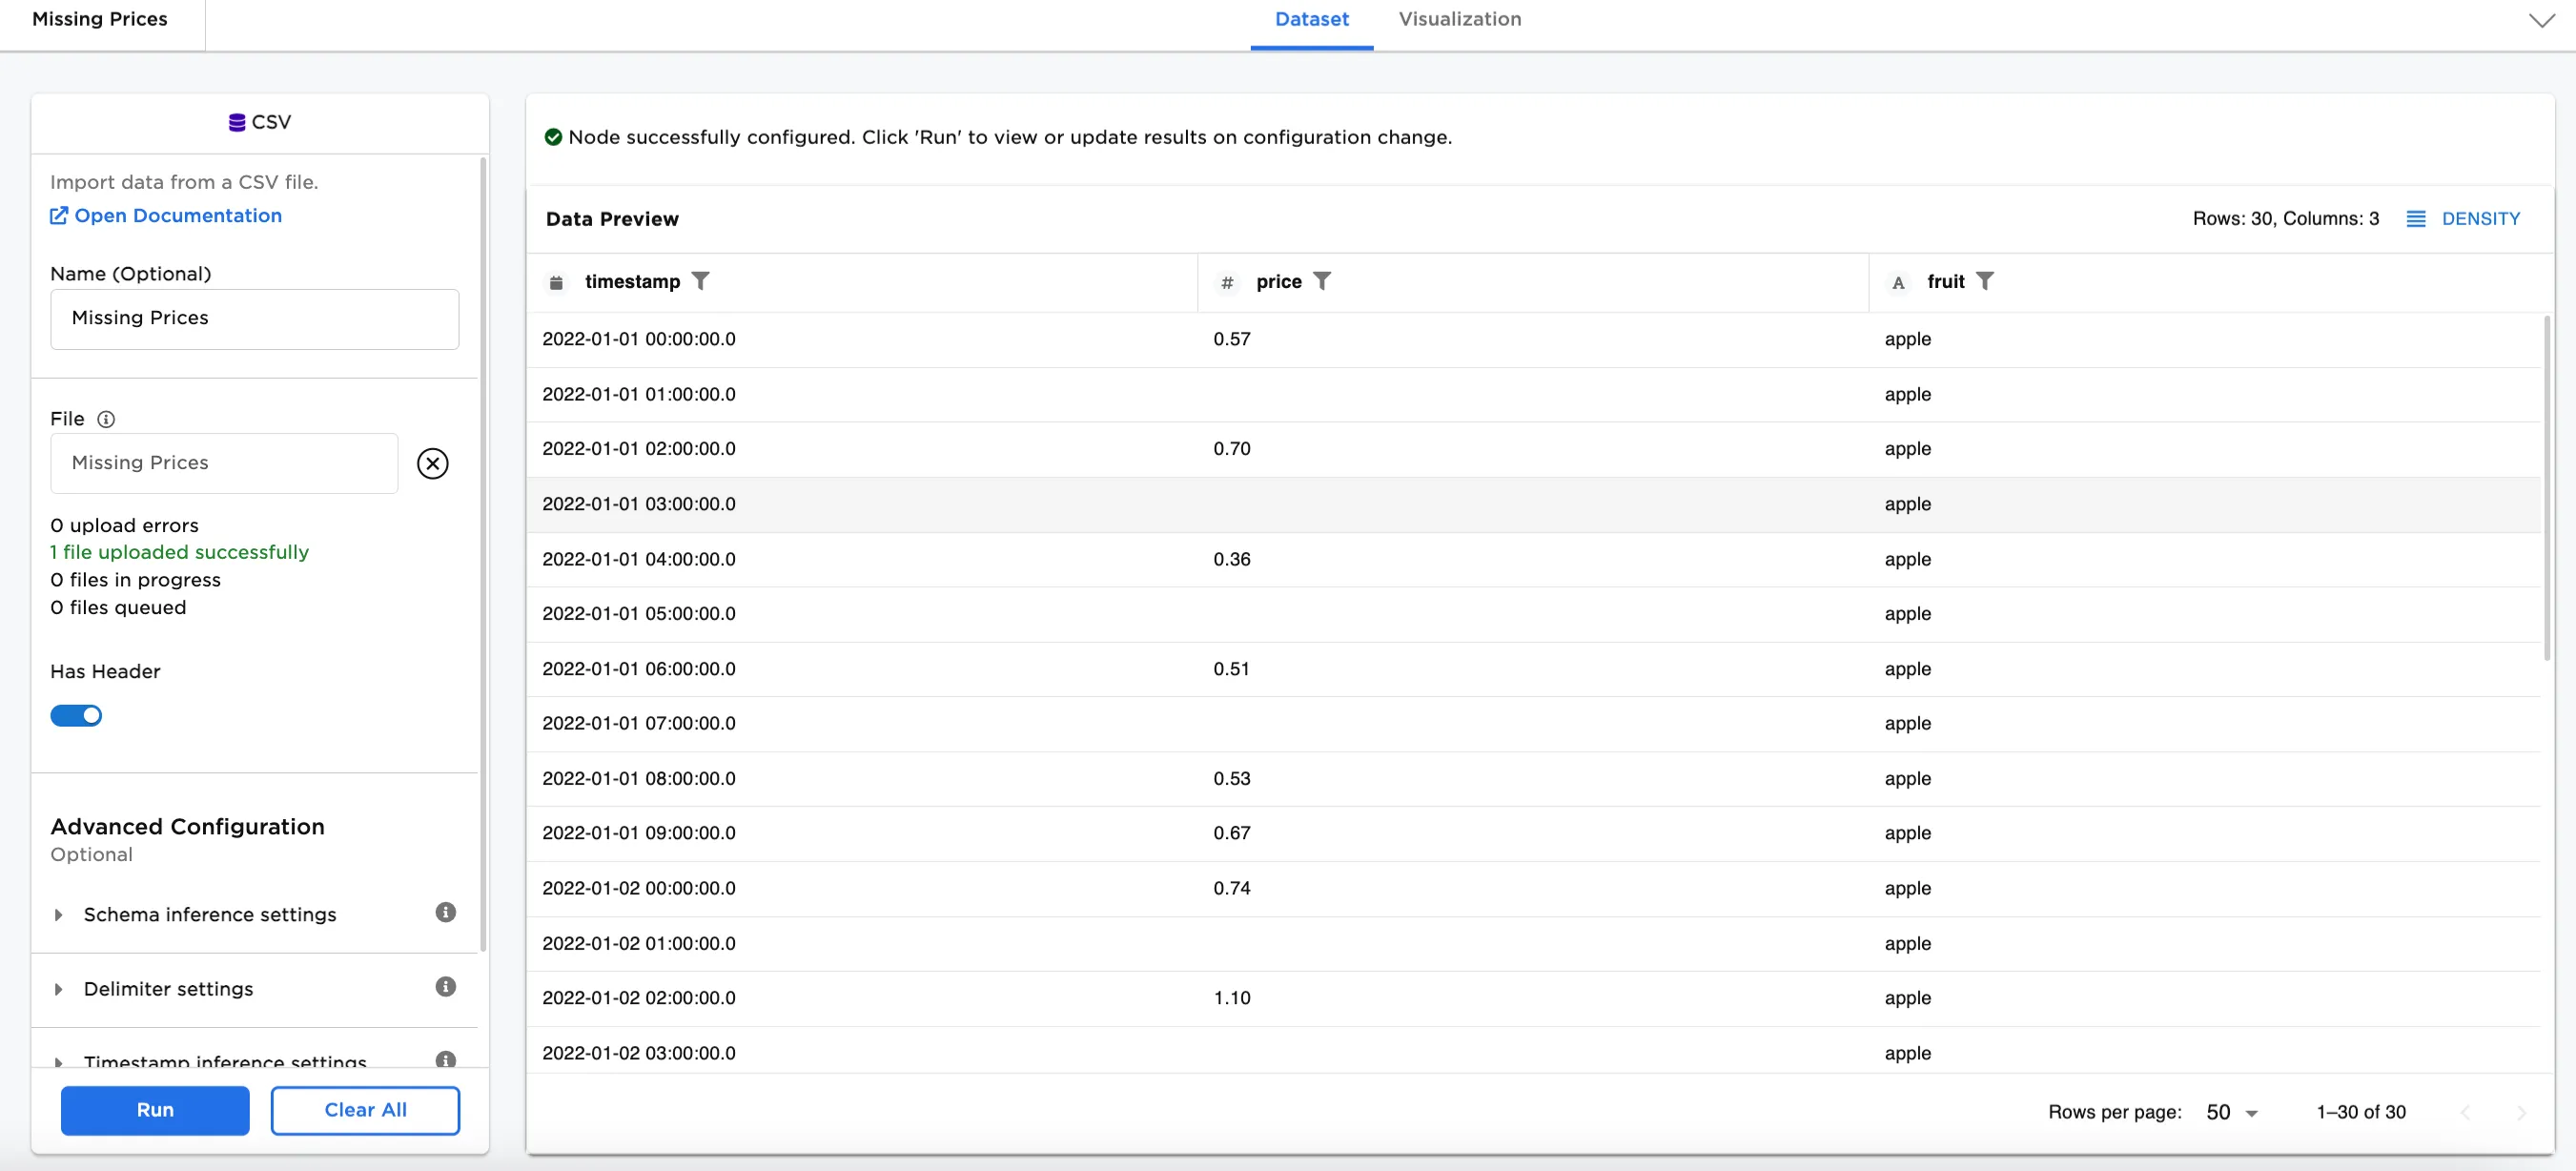 Figure 2: Example input data
- Connect a Numeric Missing Data node to an existing node. In this case, it is connected to a CSV node with the
Missing Pricesfile. - Optionally, name the Numeric Missing Data node. In the example, the node is named,
Add Missing Prices. - Select the column(s) to scale. Figure 3 shows
price (Double)selected for this field. - Select the strategy to use to fill in the missing values. Figure 3 shows Imputation using mean is selected.
- Select Run.
Notice that the original column is replaced with price_scaled (to keep the original column in addition to the new column, toggle Keep Original Columns on). The missing values are filled in with the mean of all the prices.
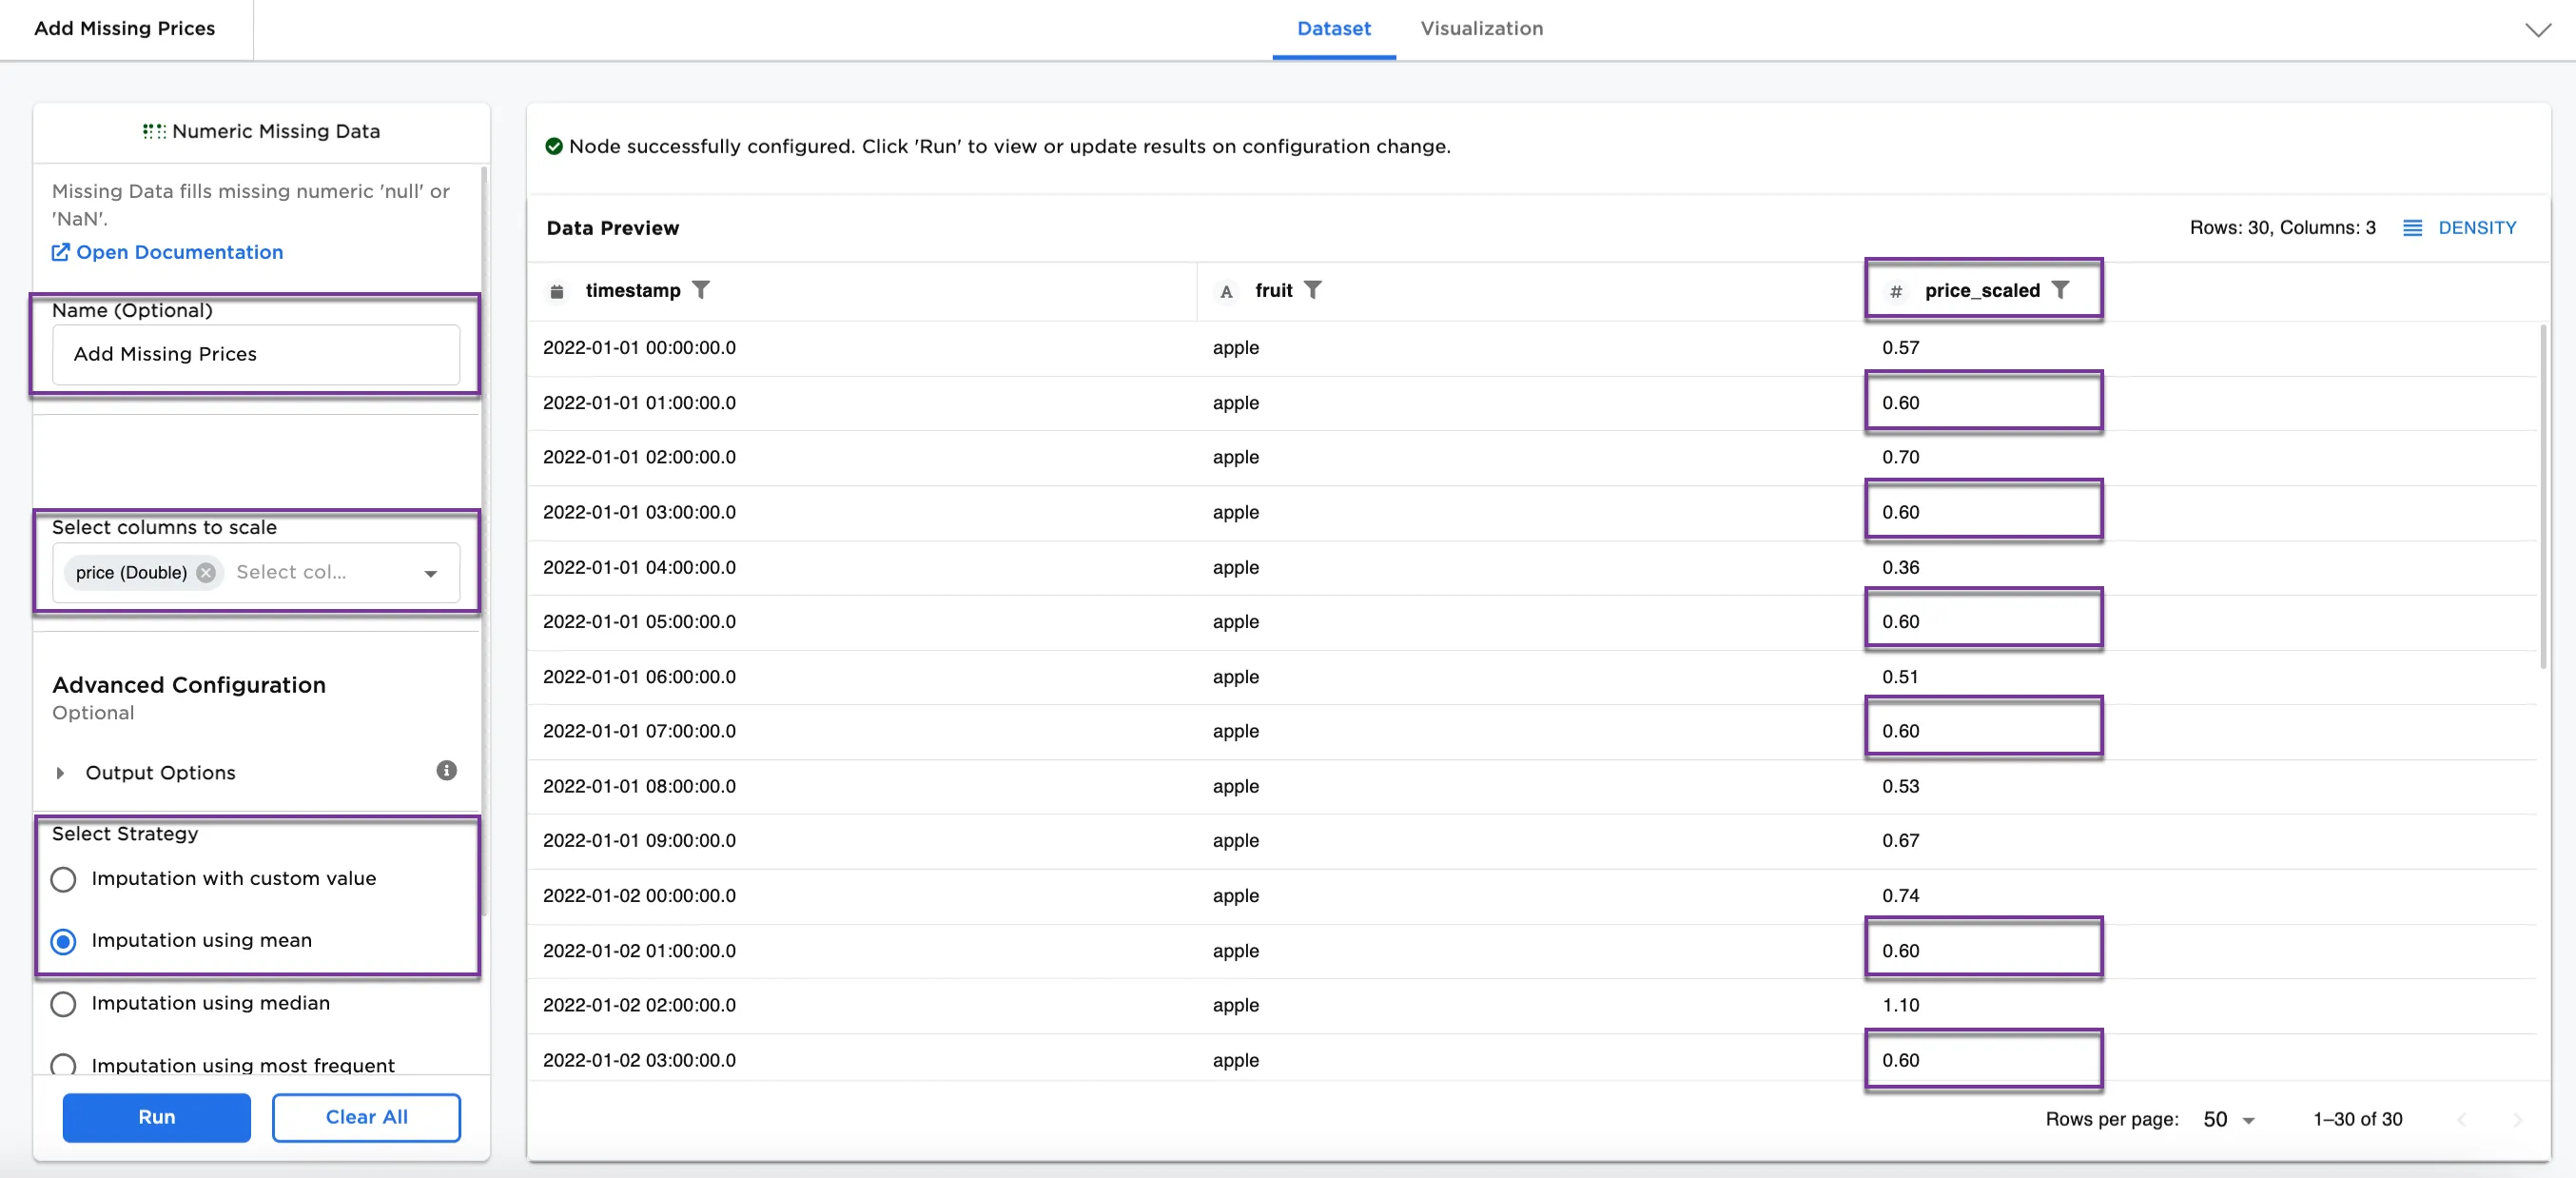
Figure 3: Example with imputation using mean
Optionally, try using a different strategy.
- Select a Imputation using mean for the strategy to use to fill in the missing values.
- Select Run.
Notice Figure 4, shows different values. The mean in Figure 3 is 0.60 and the median in Figure 4 is 0.55.
Other strategy options to try are Imputation with custom value, Imputation using most frequent, and None - Drop rows with missing features.
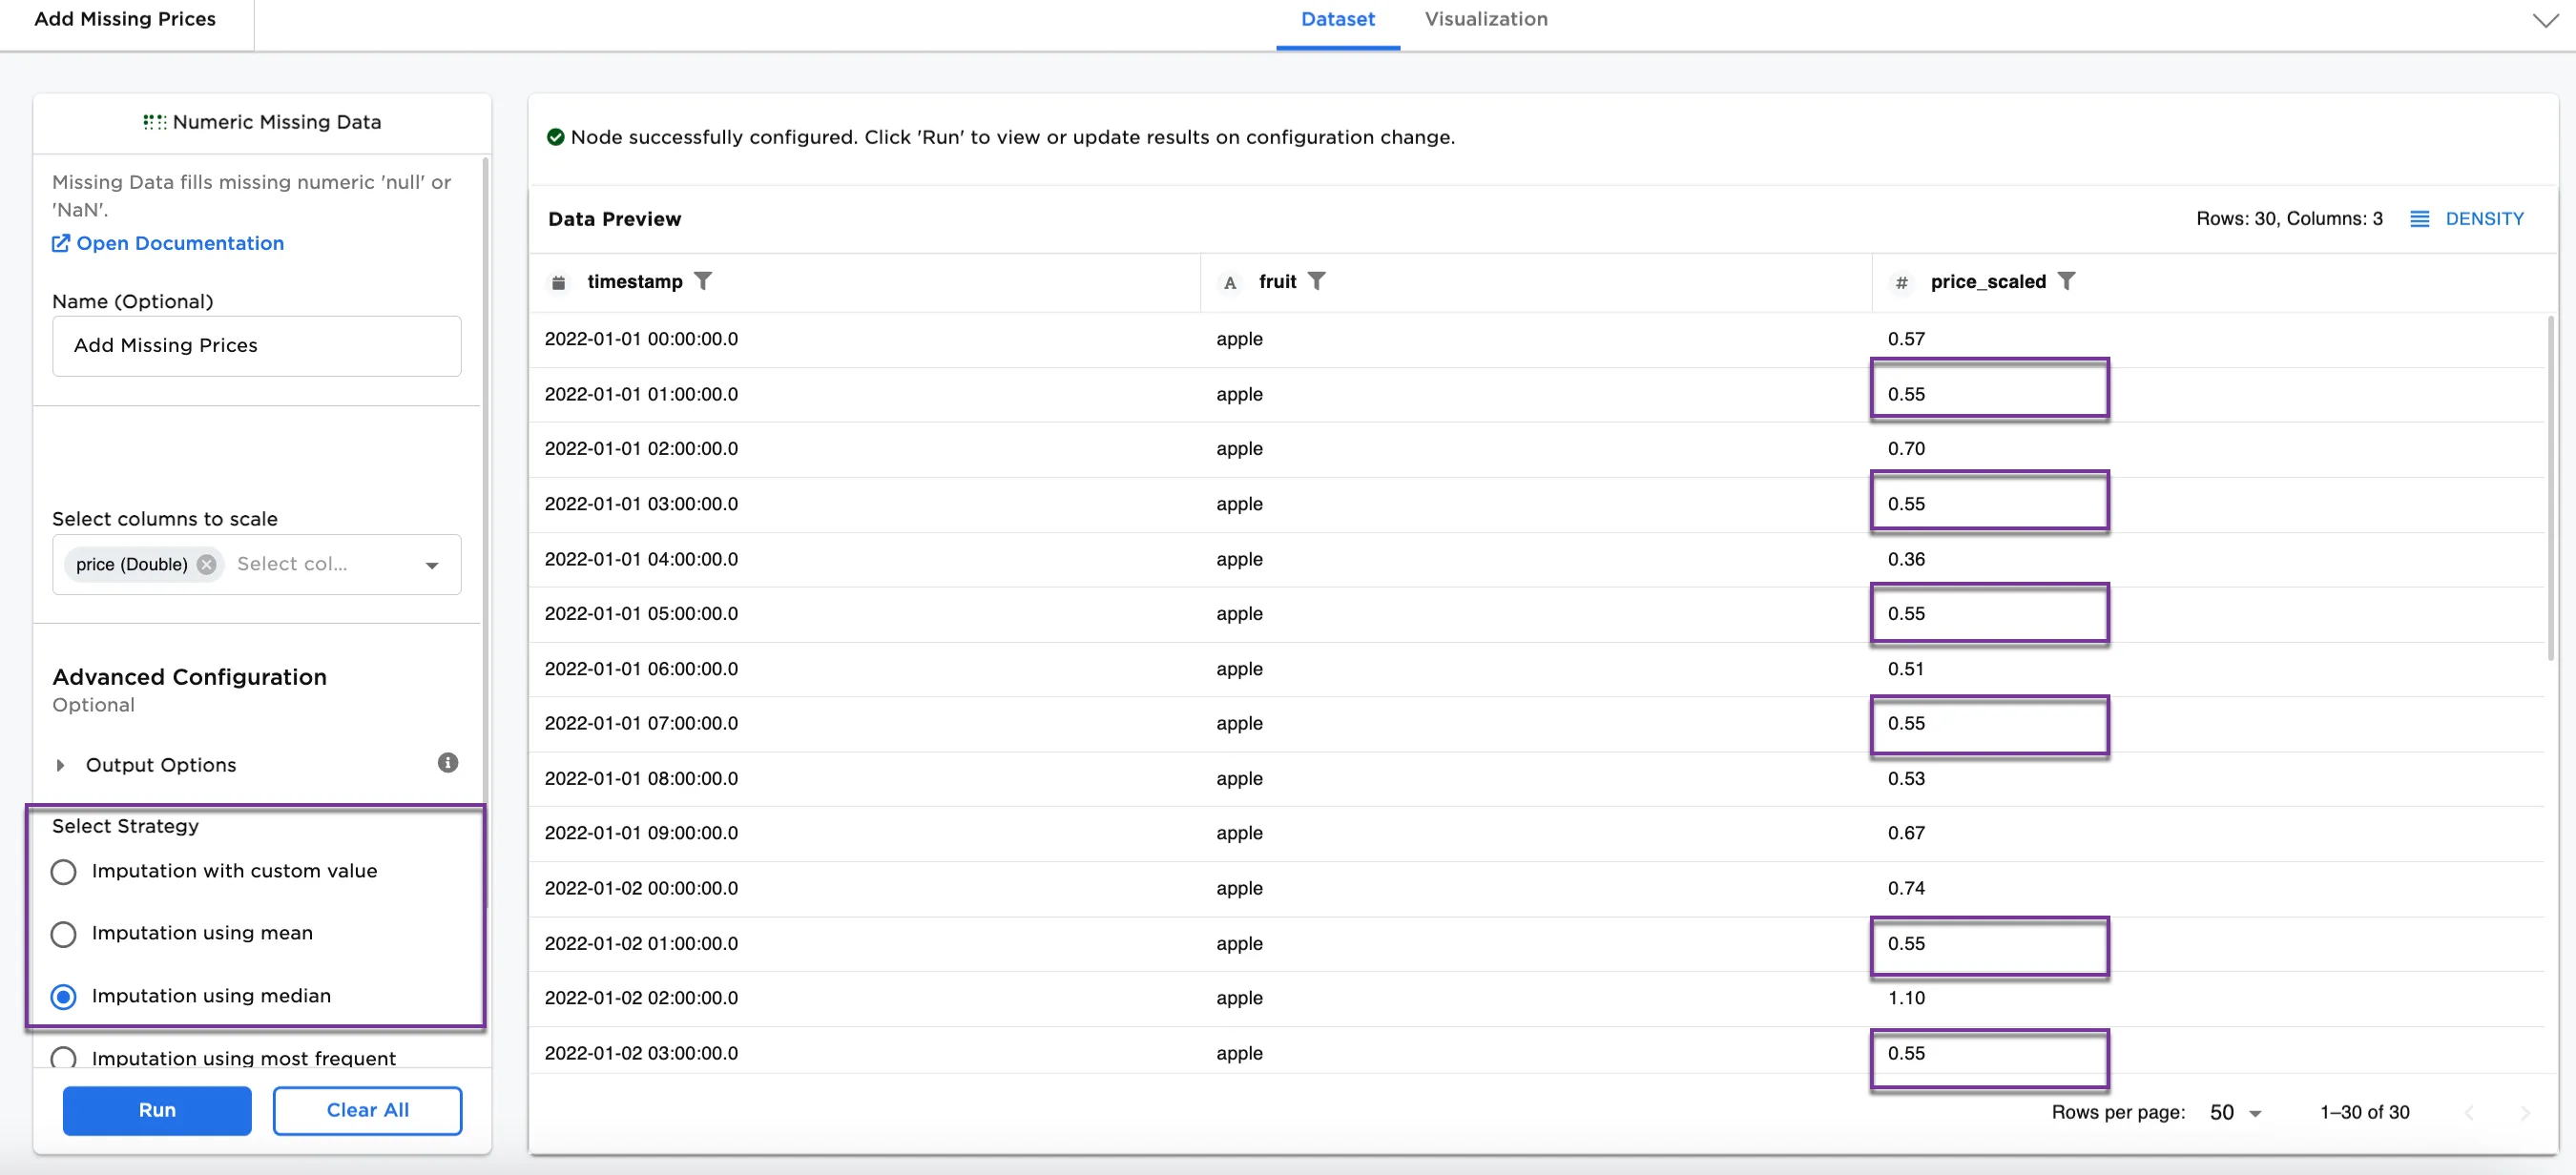
Figure 4: Example with imputation using median