Threshold Binarizer
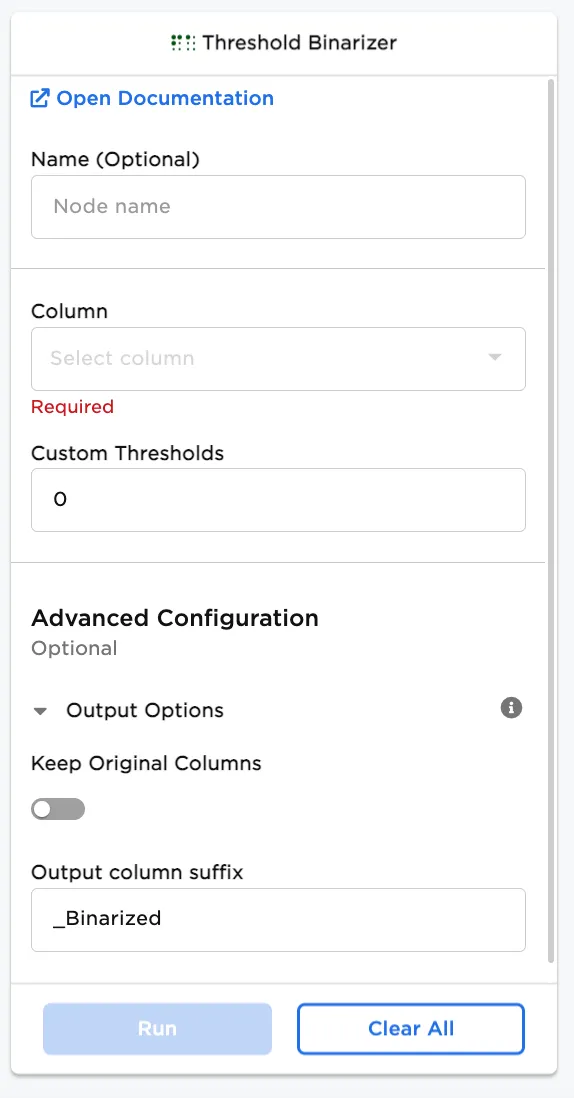
Use the Threshold Binarizer node in Visual Notebooks to set a threshold on a value column and create a binary column, which is one option for preprocessing your data for machine learning. A threshold binarizer assigns a binary column of 0s or 1s per specified value.
Configuration
| Field | Description |
|---|---|
| Name | Field to name the node An optional user-specified node name displayed in the workspace, both on the node and in the dataframe as a tab. |
| Column | Add a column from your dataset Select a value column (integer or double) from your dataset to binarize. |
| Keep Original Columns | Keep or delete original column Toggle the button on to keep original columns, or off (default) to remove original columns. |
| Output column suffix | Add suffix to binarized column Select what suffix to add to the new binarized column. |
Node Inputs/Outputs
| Input | A Visual Notebooks dataframe |
|---|---|
| Output | A dataframe with a threshold binarized value column |
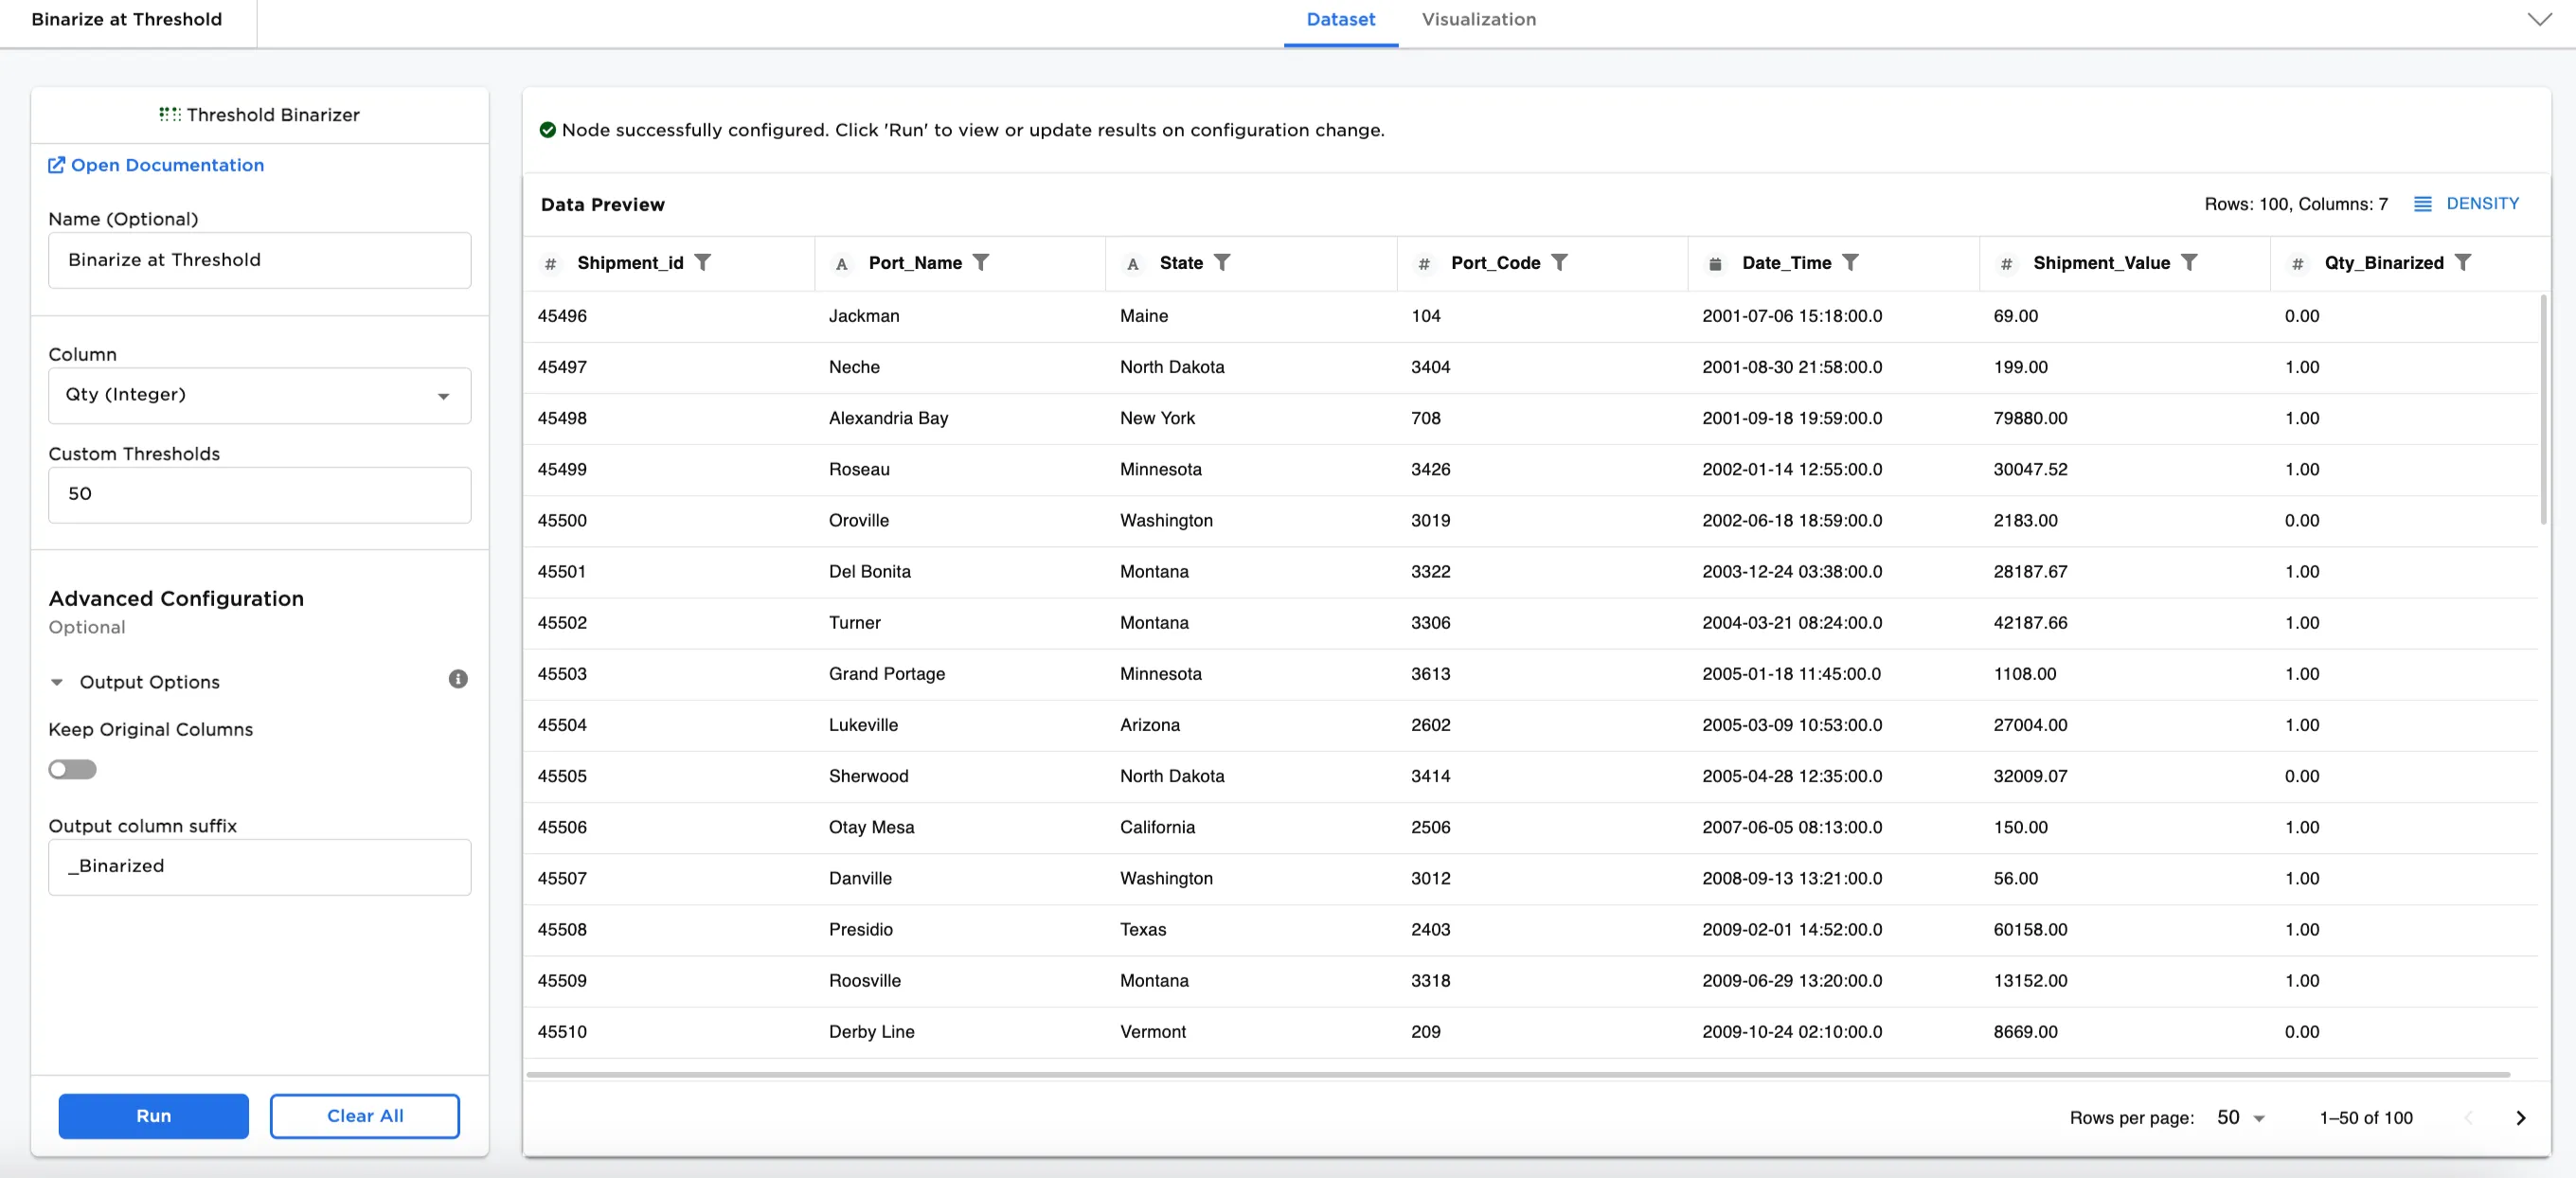
Figure 1: Example output dataframe
Examples
In this example, we have a dataset representing shipments within the United States. There are 100 rows of data. When selecting the integer column for thresholds, it is better to select a value instead of an index or numbering system.
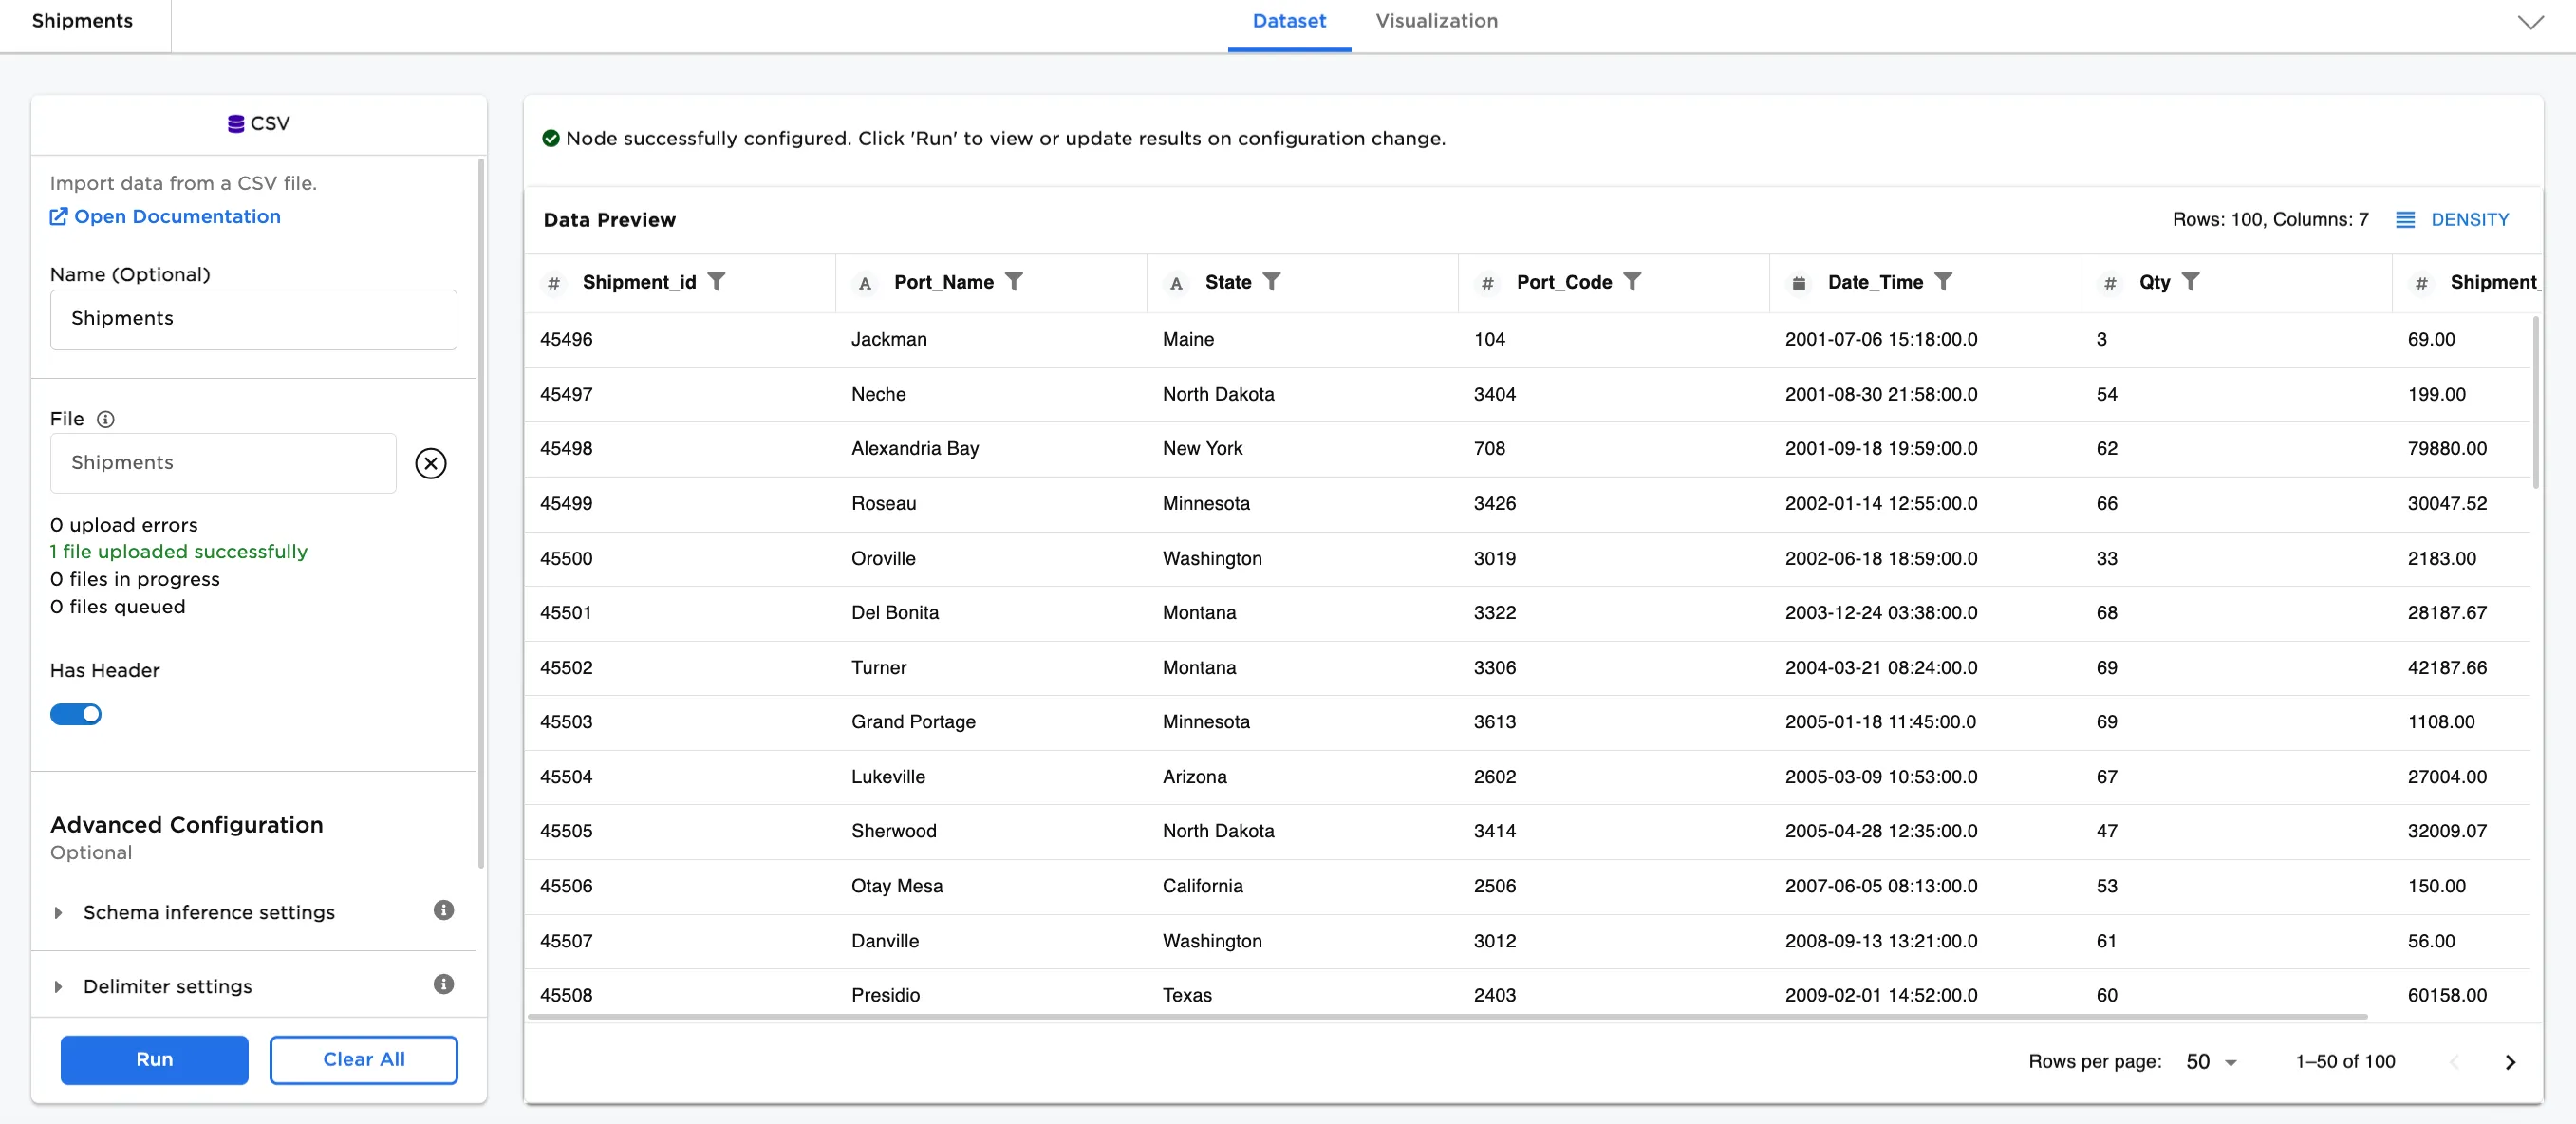
Figure 2: Example input data
- Connect a Threshold Binarizer node to an existing node. In this case, it is connected to the Shipments CSV file.
- Optionally, name the Threshold Binarizer node. In the example, the node is named,
Binarize at 20k Threshold. - Select the Column to binarize. In Figure 3a, the
Shipment_Value (Double)column is selected. - Select the Custom Thresholds. In the example,
20000is entered. - Select Run.
Notice that Figure 3a has binary columns (0 for false, 1 for true for that row and column) added to the end of the dataset. If the value in the Shipment_Value (Double) column is greater than 20000, a 1 is entered in that row and column instead of a 0.
To view the metrics on the Shipment_Value_Binarized column, select the header. Looking at the metrics in Figure 3b, there are 88 1s and 12 0s.
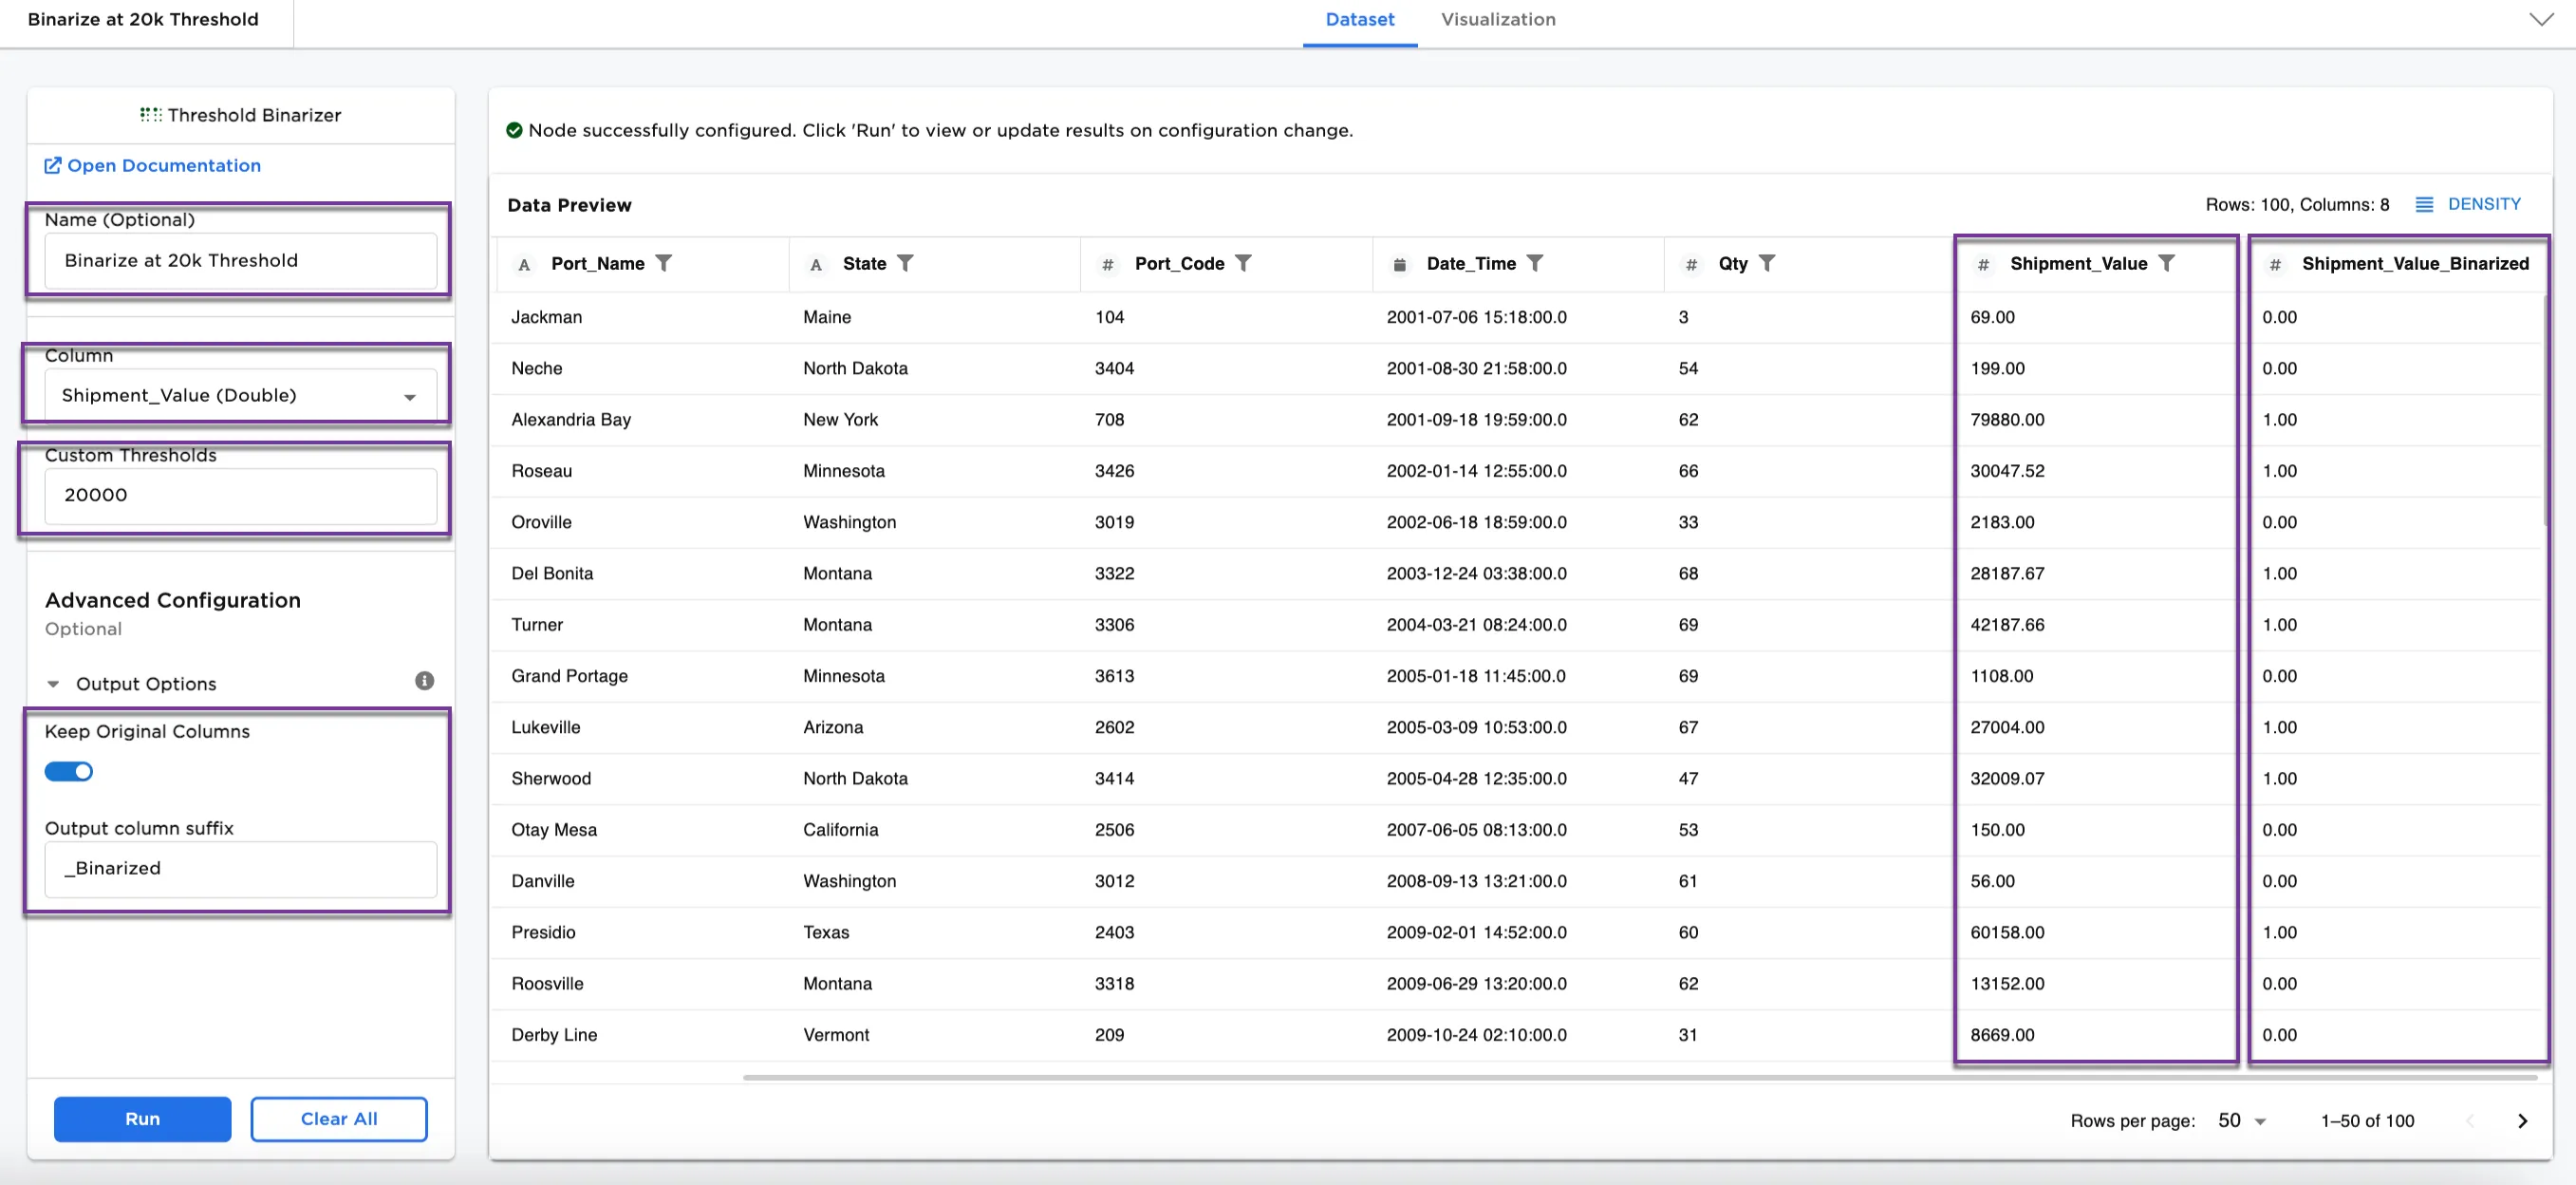
Figure 3a: Example dataframe with shipment values binarized
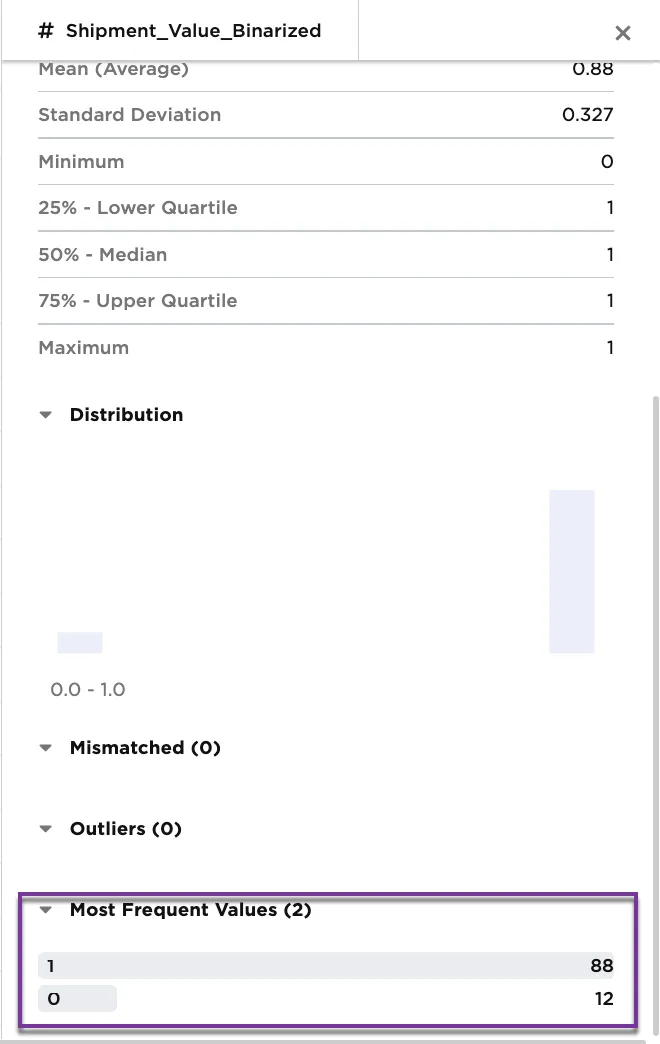
Figure 3b: Example metrics on Shipment_Value_Binarized column
Optionally, try binarizing a different column. Select Qty (integer) for the Column and 40 for Custom Thresholds.
Figure 4a shows a new column added to the end with the binary values. Figure 4b shows the metrics for the new Qty_Binarized column. There are 67 rows with 1s and 33 rows with 0s.
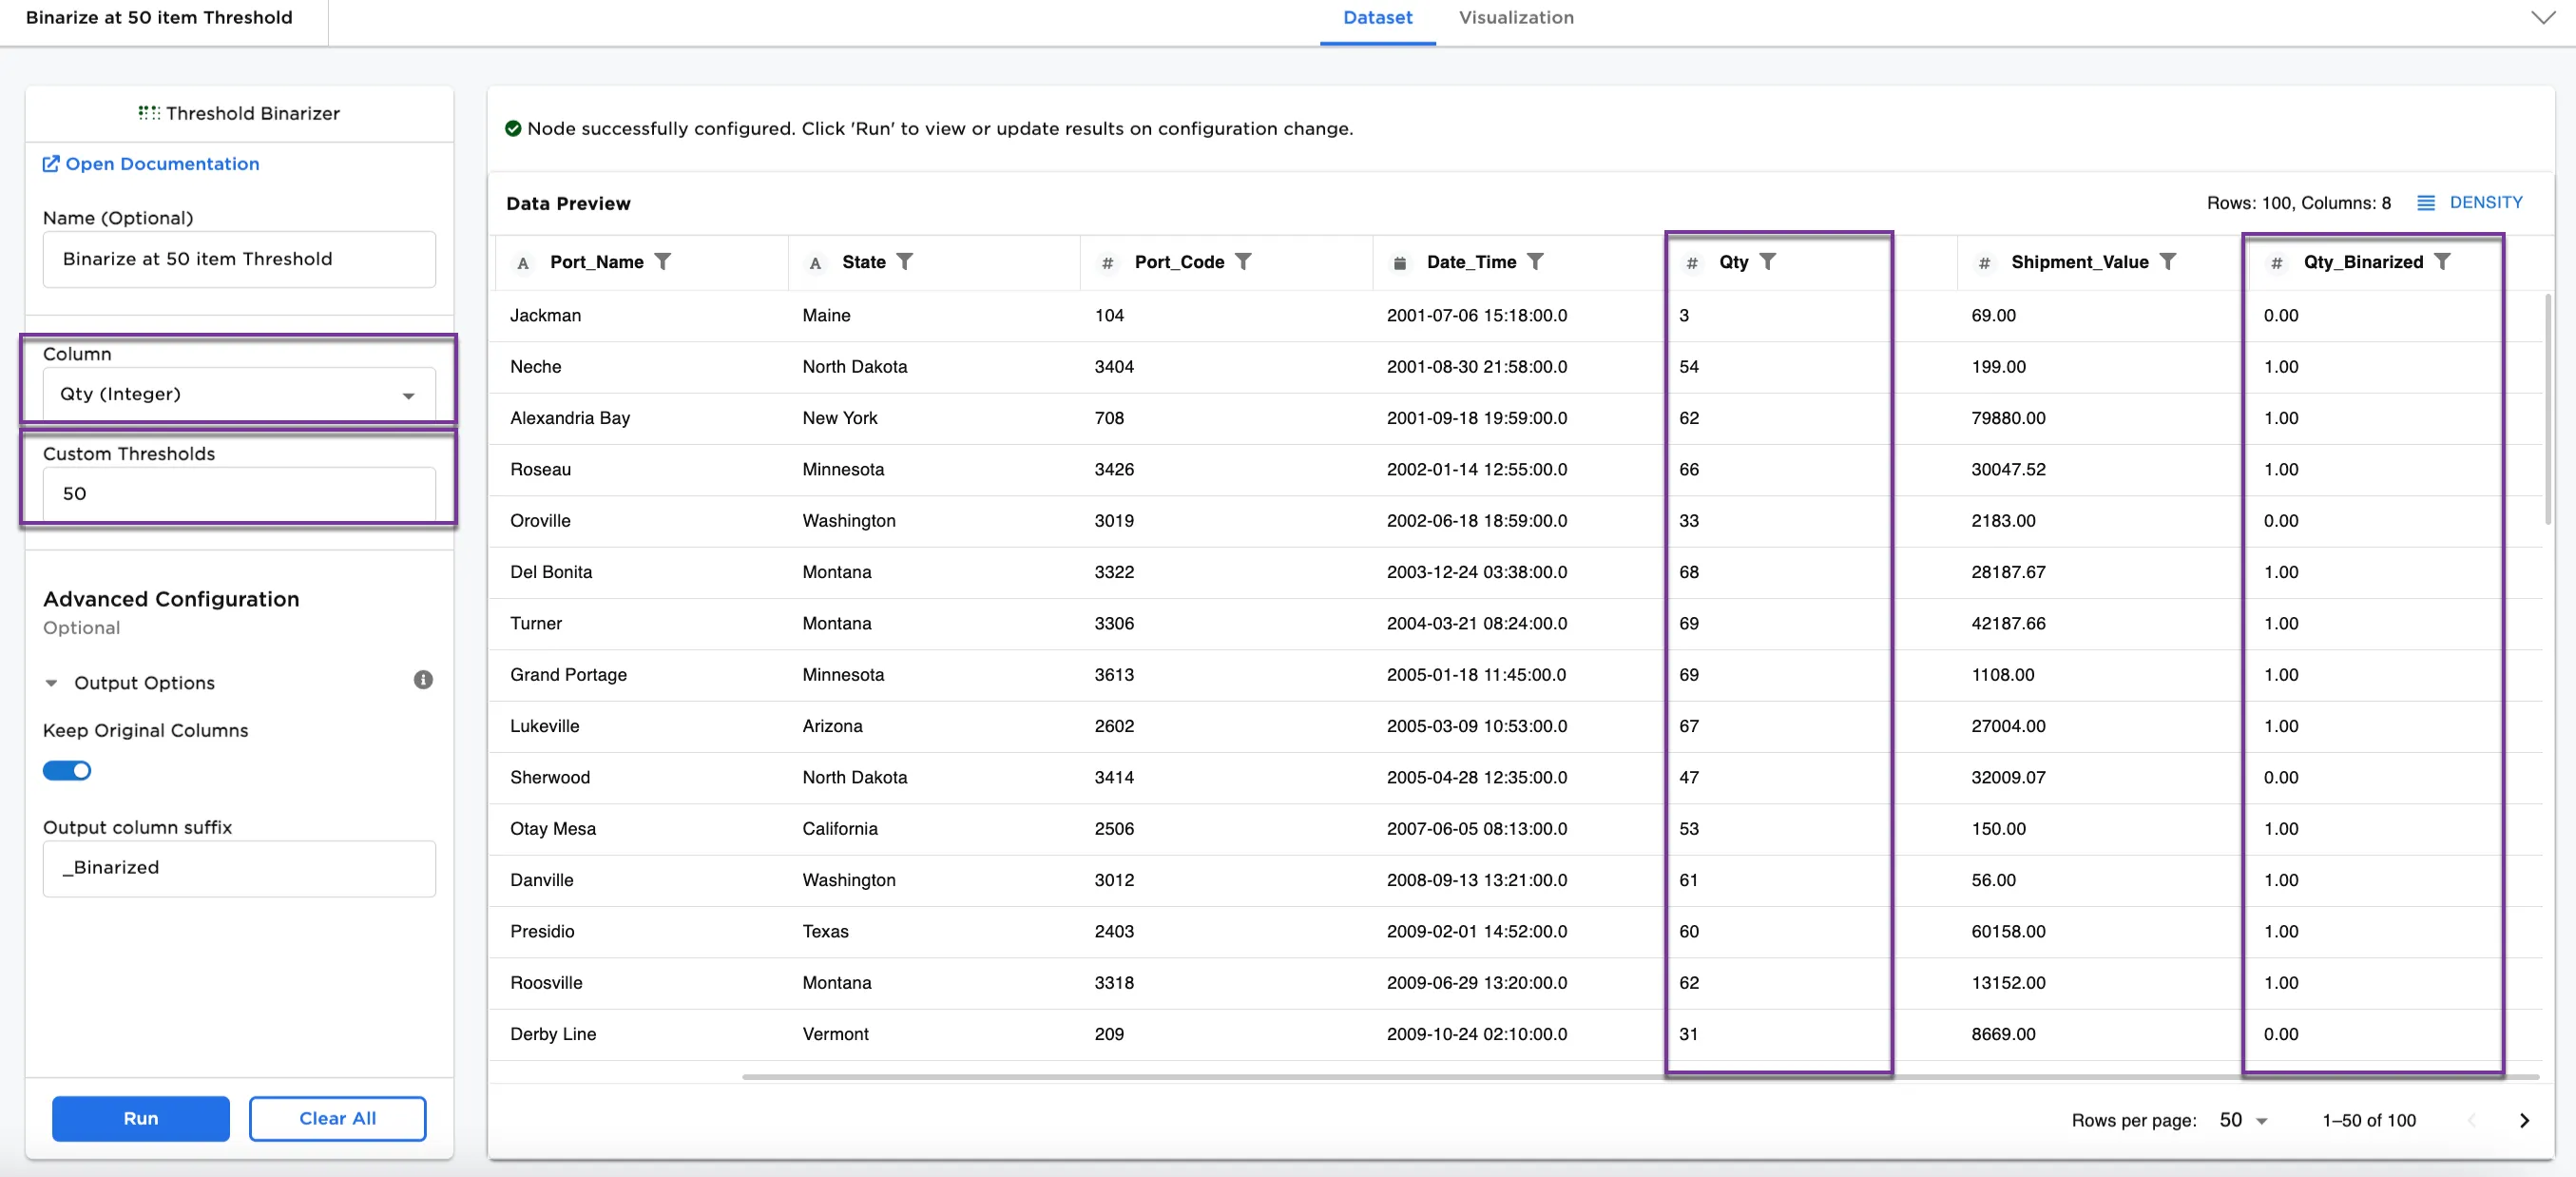
Figure 4a: Example dataframe with quantity values binarized
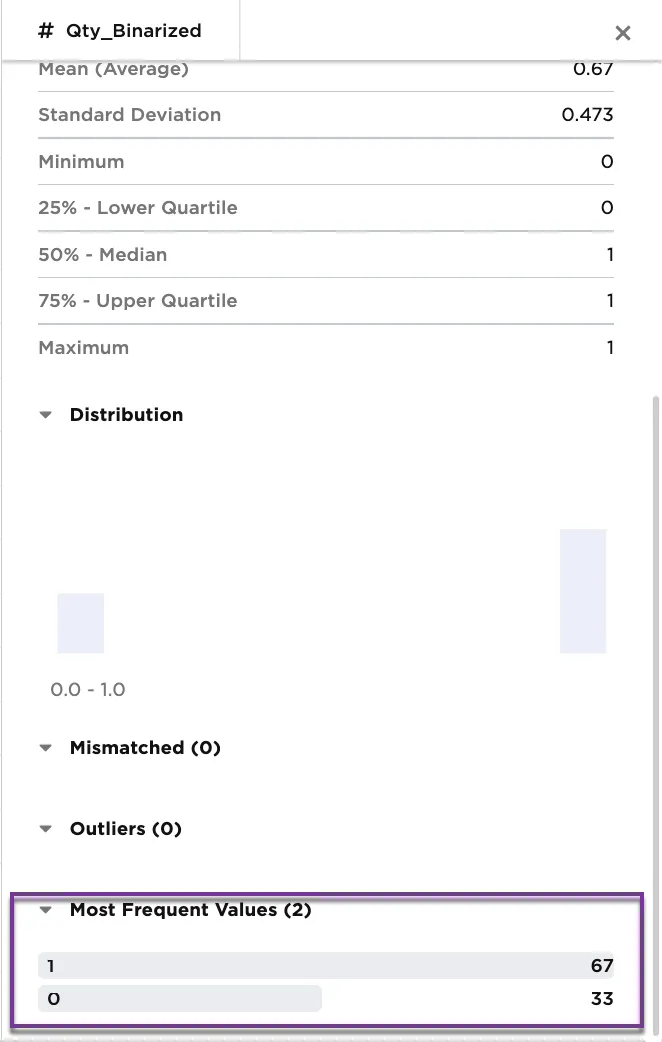
Figure 4b: Example metrics on Qty_Binarized column