Power Transform
Normalize your data in Visual Notebooks by applying a power transform. Normalizing your data before training a model can result in better performance. A power transform is the most common way to normalize your data.
Configuration
| Field | Description |
|---|---|
| Name default=none | A user-specified node name displayed in the workspace |
| Select columns to transform Required | Numeric columns to transform Select columns from the dropdown menu with continuous, numerical data to transform. |
Advanced Configuration
| Field | Description |
|---|---|
| Transform type | Specify the transform type yeo-johnson: works with negative and positive values.box-cox: works with strictly positive, nonzero values. |
Standardize default=On | Standardizing the data Specify whether to standardize output to zero-mean and unit variance. |
Estimate Optimal Lambda default=On | Applying the optimal lambda value Specify whether you want Visual Notebooks to find the optimal lambda to normalize your data. Visual Notebooks will figure out the best way to normalize your data. |
| Lambda | Using a lambda of your choice Specify the lambda value you would like the power transform to use. If you already know the transform you would like to use then enter the lambda value for that transform here. |
Keep Original Columns default=Off | Keeping the original columns Specify whether to keep the original column(s). |
Output column suffix default=_scaled | Column suffix Enter a suffix to append to the transformed columns. The suffix can only contain alphanumeric characters and underscores. |
Node Inputs/Outputs
| Input | A Visual Notebooks dataframe |
|---|---|
| Output | A dataframe with power transformed data |
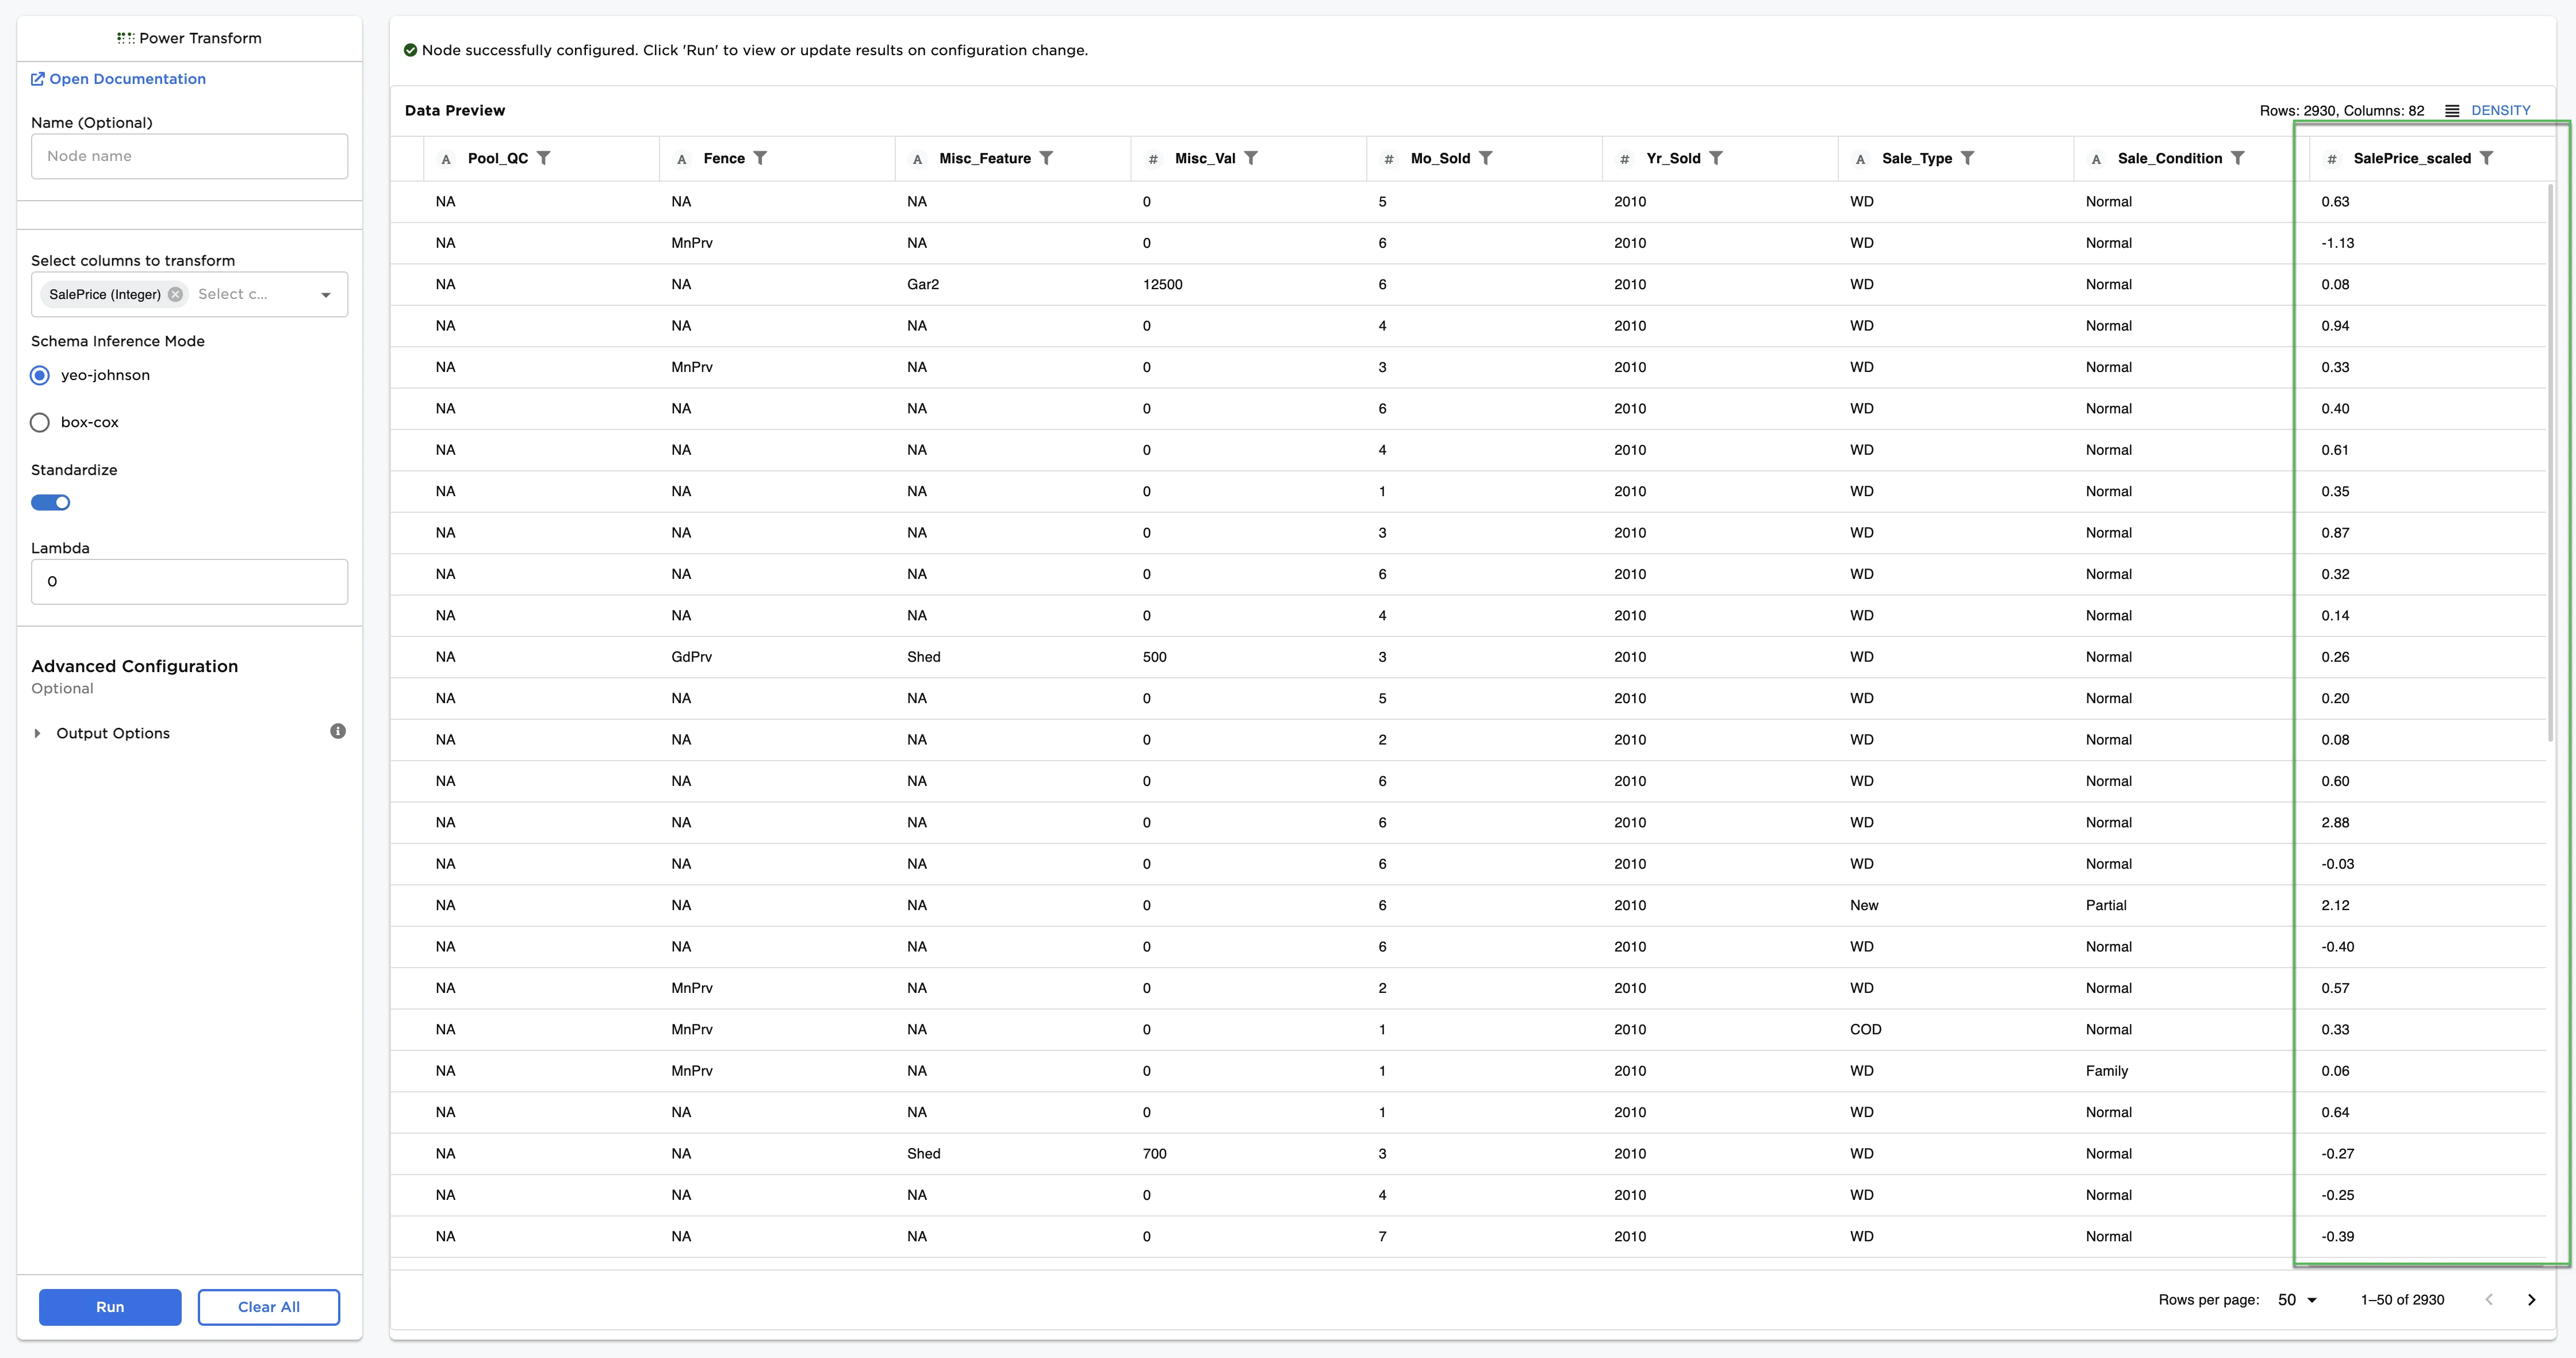
Figure 1: Example dataframe output
Examples
The data shown in Figure 2 is used in this example. It contains the sale price and other key information about houses. Eventually, we plan to train a model to predict the sale price of a house. Since models often perform better on normalized data, we first use the Power Transform node to normalize this data.
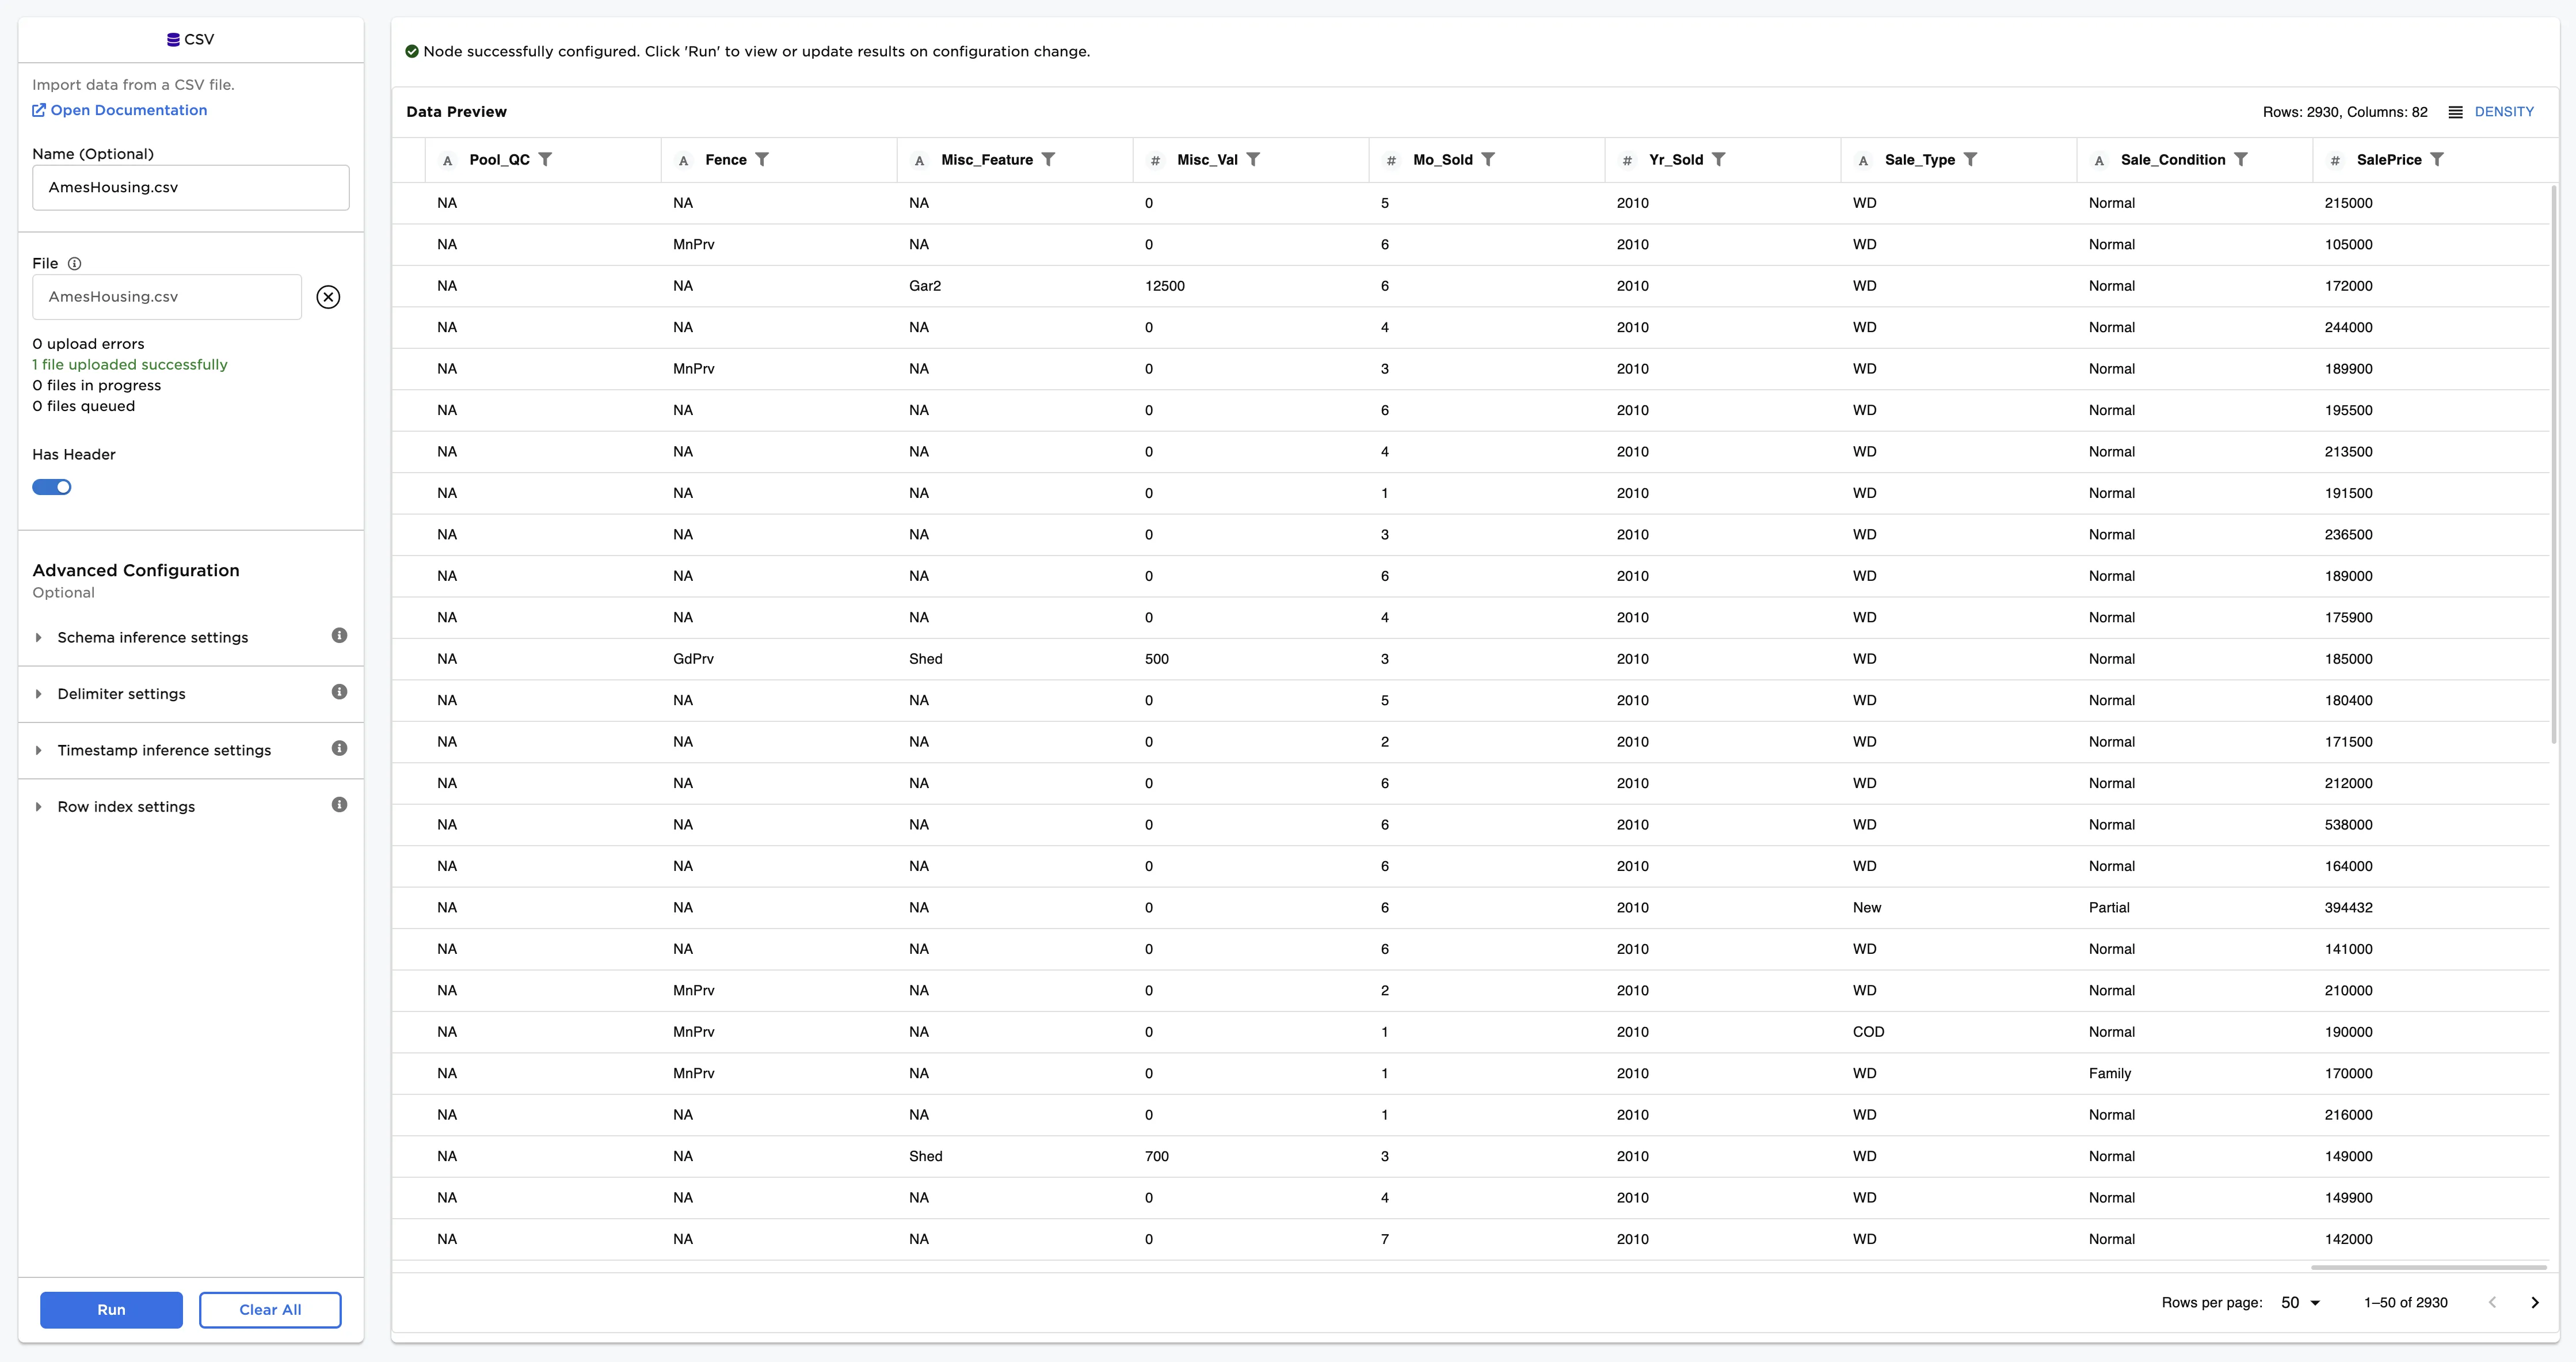
Figure 2: Example input data
- Connect this node to the node containing your dataset (in this case, the house price data).
- For the Select columns to transform field, select the column on which you would like to apply a power transform (in this case, "SalePrice").
- Press Run to run the node with the default settings.
Now, you have a dataframe with a new column with a "_scaled" suffix. This is the column that contains the power transformed version of the column you selected.
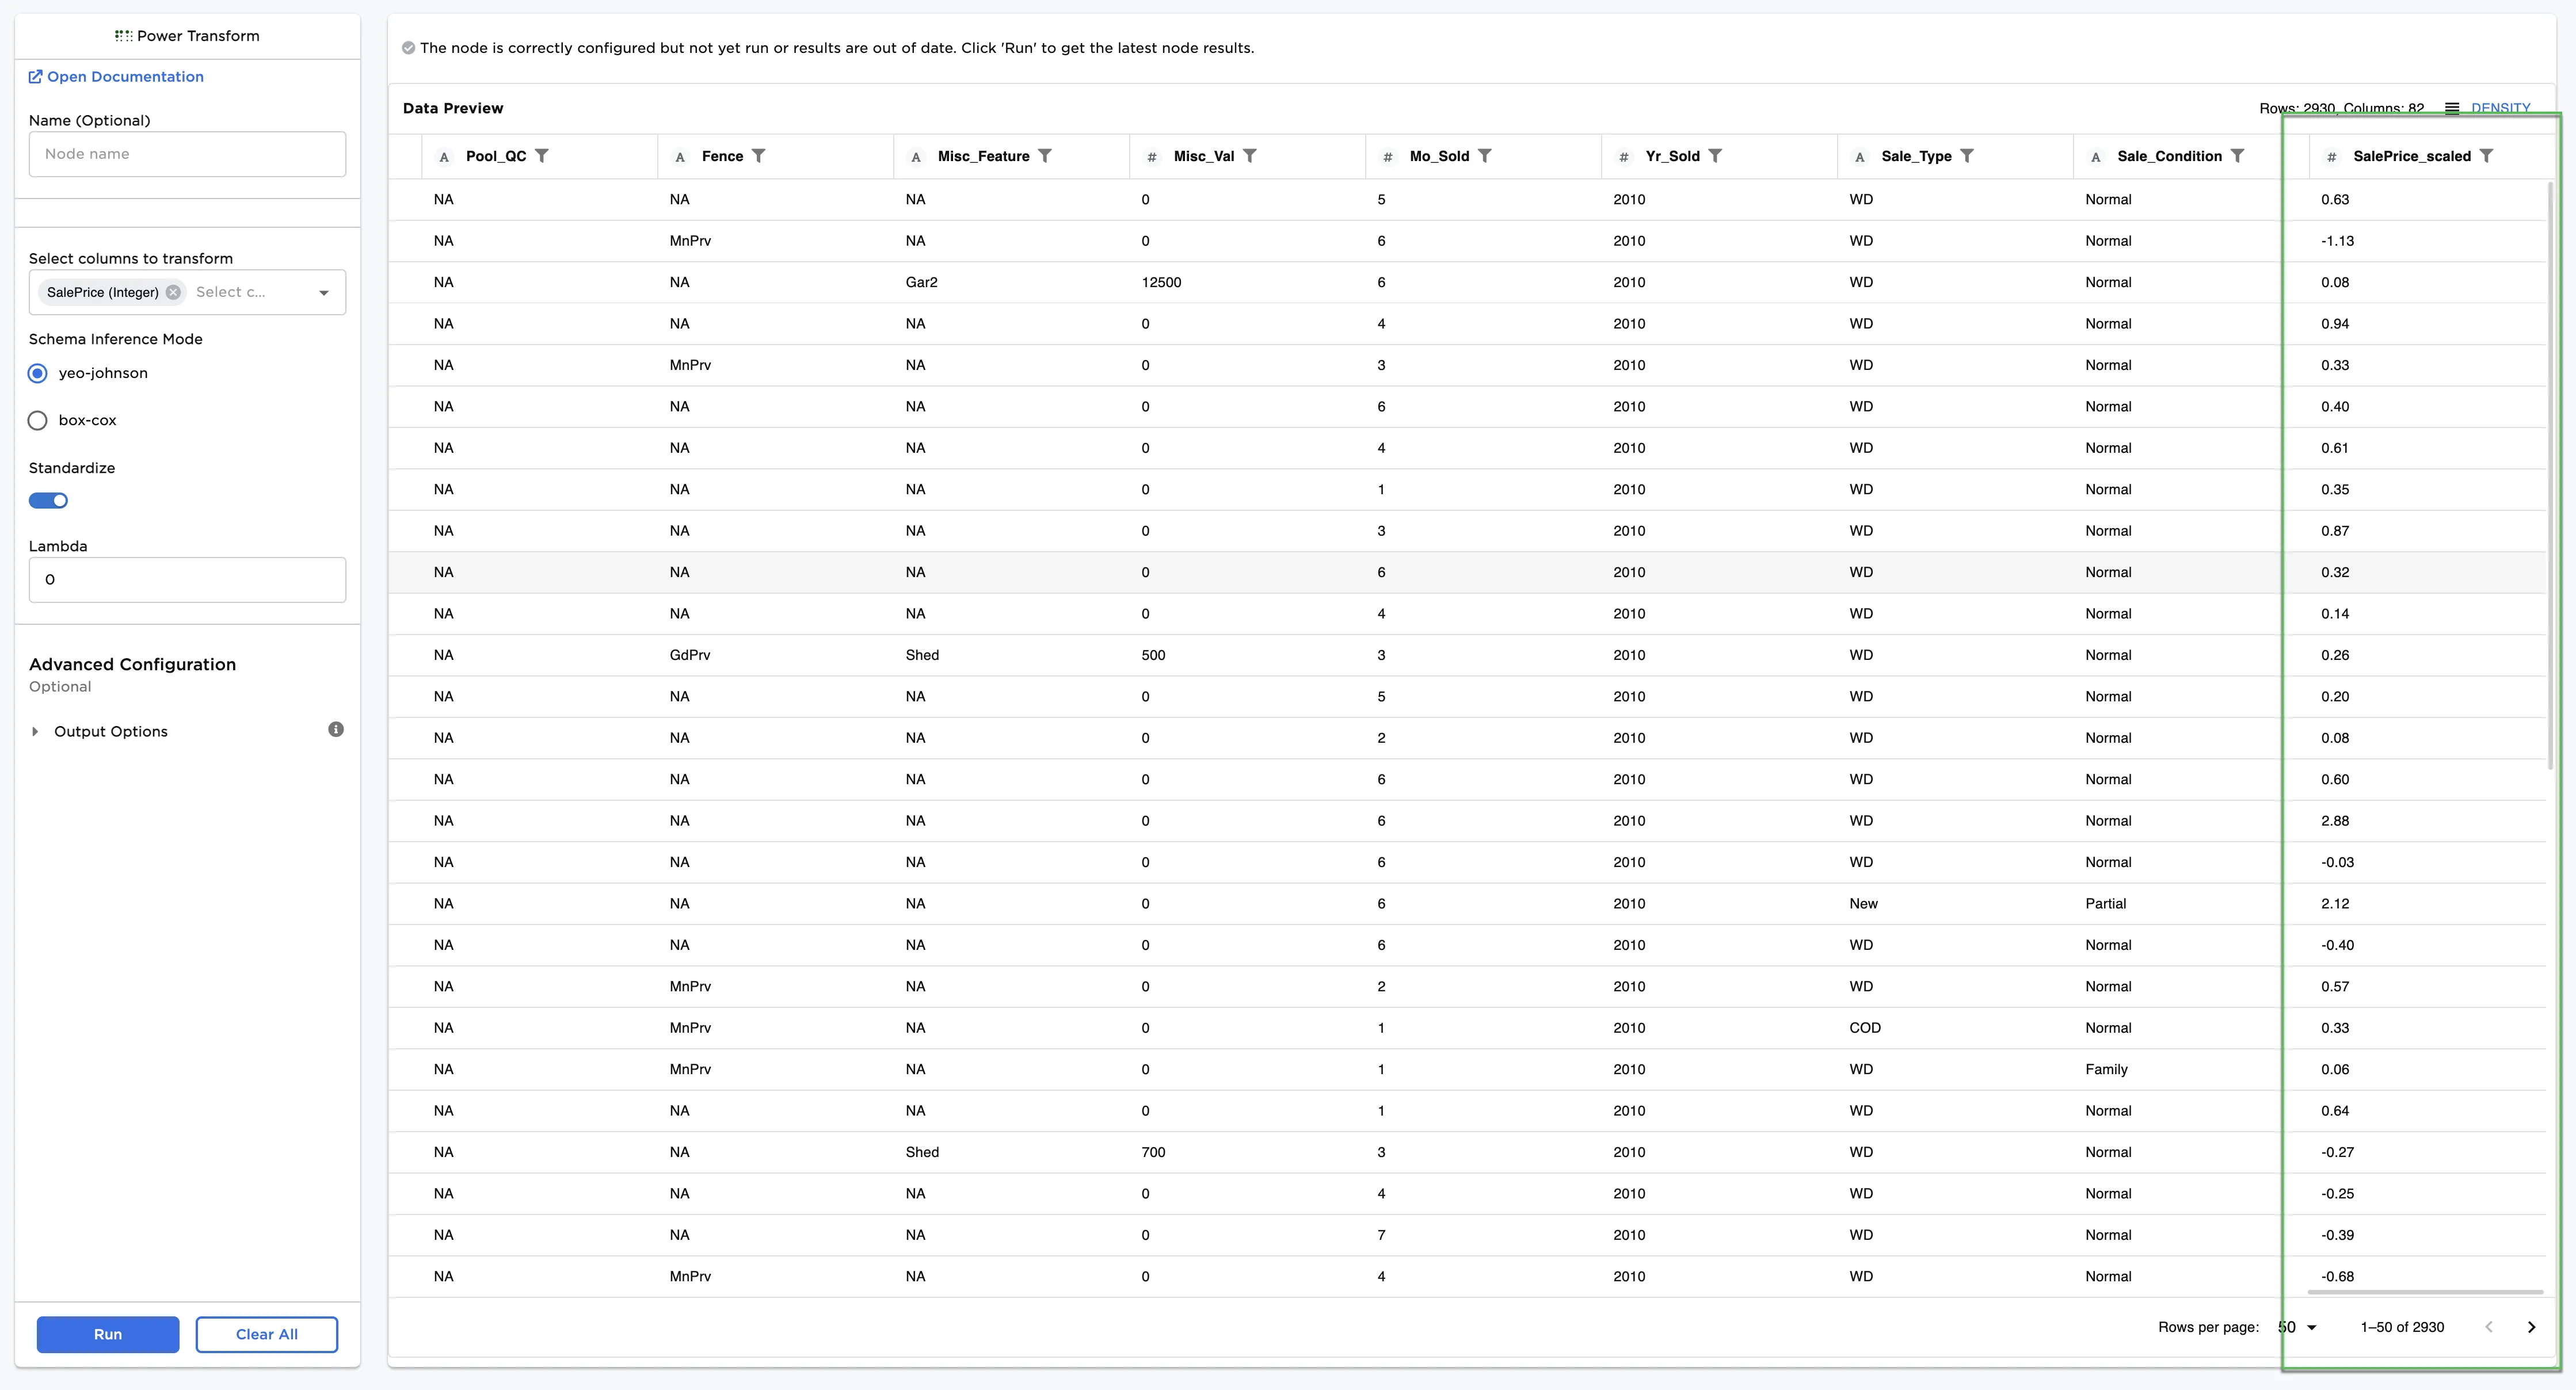
Figure 3: Example dataframe with default settings
Background
When met with skewed datasets, we often use a power transform to make the data more normal. We do this because some models trained on normalized data often perform better than models trained without normalizing the data first. Power transforms generally transform the data by applying some exponent. For example, a common transform is the square root transform, which essentially applies a square root to the training data.
The Box-Cox Transformation
The most common method to find a normalizing power transformation includes using the one-parameter Box-Cox transformation, which is defined as
for some $\lambda$. The typical process uses maximum likelihood estimation to find an optimal lambda, which when applied to the data using the above transformation, results in the best approximation of a normal distribution.
The Box-Cox transformation works only on strictly positive data.
The Yeo-Johnson Transformation
The Yeo-Johnson Transformation works without restrictions on the data, i.e., it works for positive and negative data. The transformation is defined as
If $y$ is strictly positive, then this transformation is the same as the Box-Cox power transformation of $(y+1)$. If $y$ is strictly negative, then this transformation is the Box-Cox transformation of $(-y+1)$, but with power $2-\lambda$. With both negative and positive values, the transformation is a mixture of these two, so different powers are used for positive and negative values. This makes interpretation of the parameter difficult.