Pivot
Create pivot tables in Visual Notebooks.
Configuration
| Field | Description |
|---|---|
| Name (Optional) default=none | A user-specified node name displayed in the workspace |
Filter Fields default=none | Filter to limit the data processed Optionally choose a field and a qualifier on that field, to limit the amount of data processed. |
| Column Fields default=none | Value of the column headers Specify the column headers of your pivot table with this field. Each column is named after one value of this field. |
| Row Fields default=none | Column header for the first column Optionally specify the column header for the first column of your pivot table. |
| Value Fields Required | Data to process Choose which data to be processed and displayed in the pivot table. |
Node Inputs/Outputs
| Input | A Visual Notebooks dataframe |
|---|---|
| Output | A dataframe reordered as a pivot table |
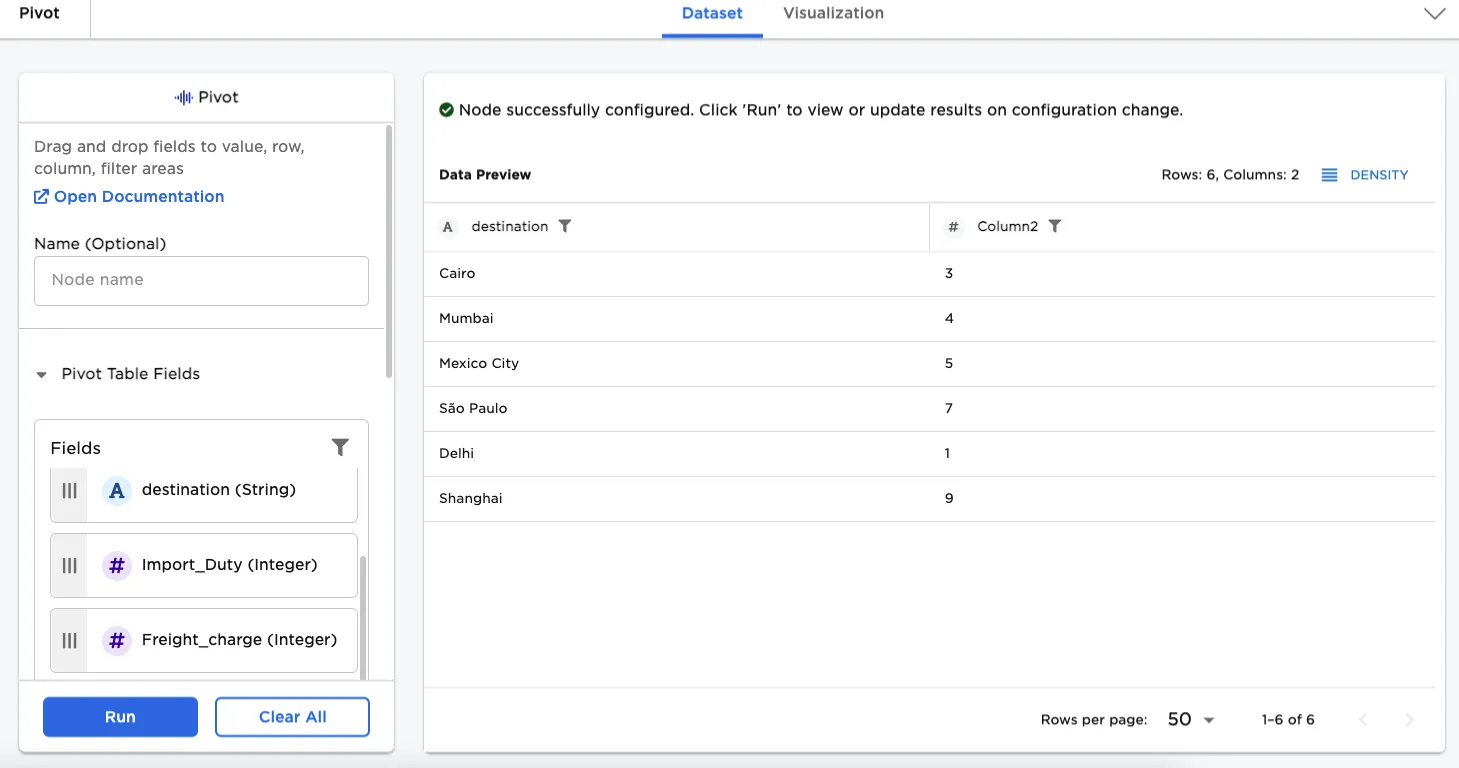
Figure 1: Example pivot node output
Example
For the examples, we will use an input node that contains shipping data for individual orders. Each row represents one shipping order, and contains an order number, a destination for the shipment, freight charge, the price of the order, and the payment method for the order. The data is shown in the figure that follows.
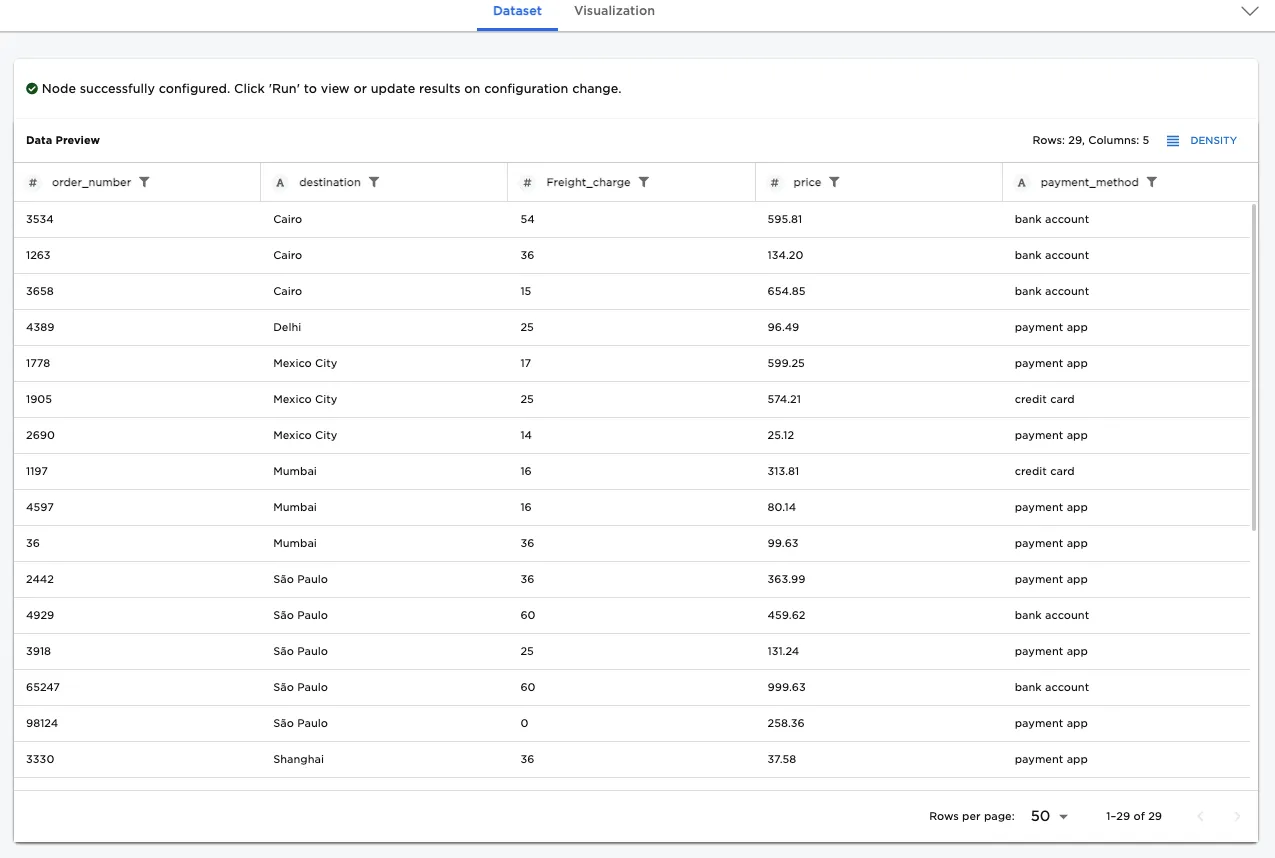
Figure 2: Example input data
For the first example, we will generate a pivot table that shows how many shipments went to each destination. Construct the table by doing the following:
- Connect a Pivot node to an existing node.
- From the Fields section, drag "destination" to Row Fields.
- Drag "order numbers" to Value Fields.
- From within Value Fields, choose "Count".
- Select Run.
The pivot table generated indicates that Mexico City received five shipments.
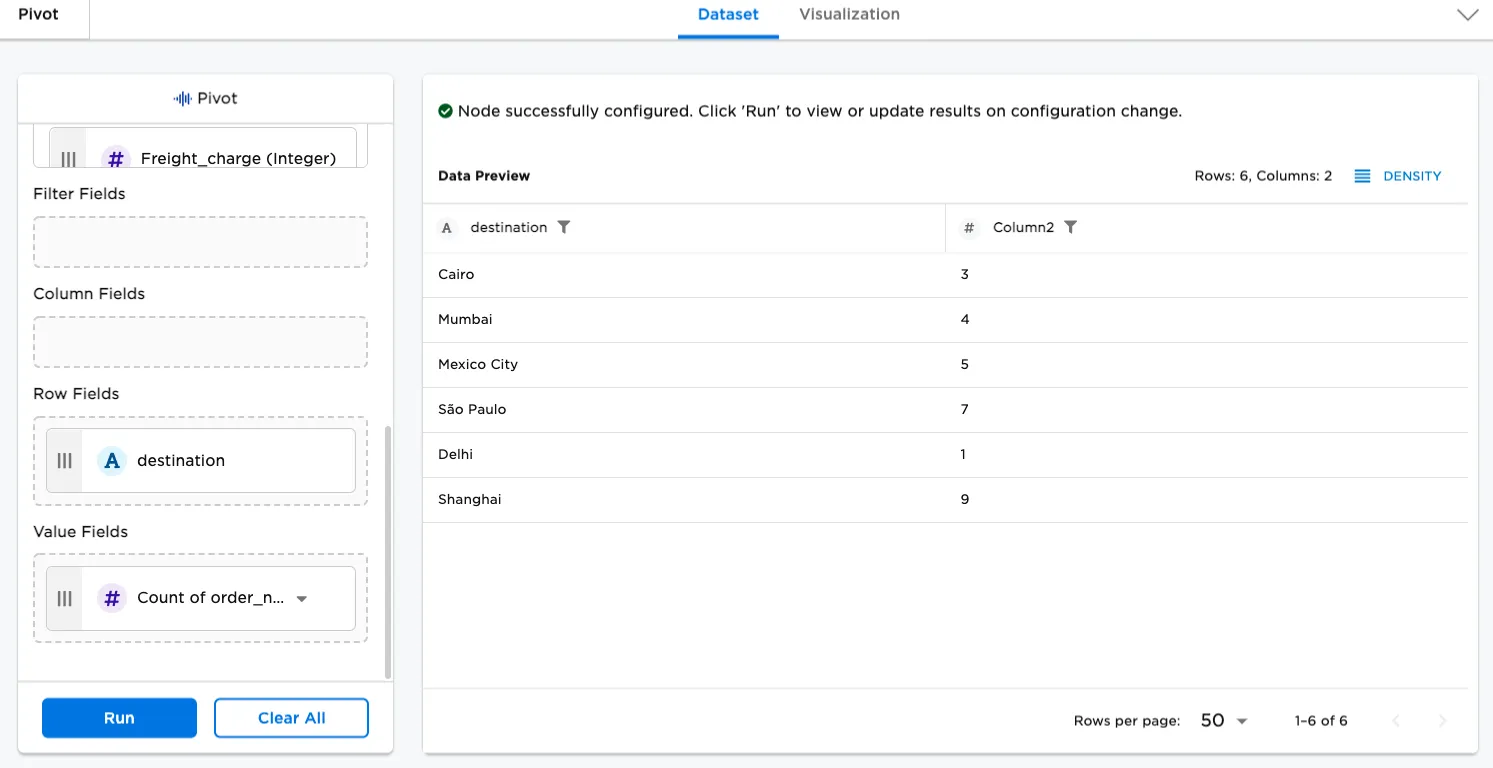
Figure 3: Pivot table showing order counts for each destination
For the next example, we will use the same pivot table used in the previous example, but we will put a data filter on it so that the table only counts orders where the price of the order is greater than $500. Construct the table by doing the following:
- Drag "price" to Filter Fields.
- Select the filter icon in Filter Fields. (The filter icon becomes visible when hovering over the field.)
- For the Filter by condition dialog, specify Is greater than and "500". Then select OK.
- Select Run.
The table has fewer rows, since Mumbai and Delhi did not have any orders priced over $500. The order count for the remaining countries is diminished, as expected.
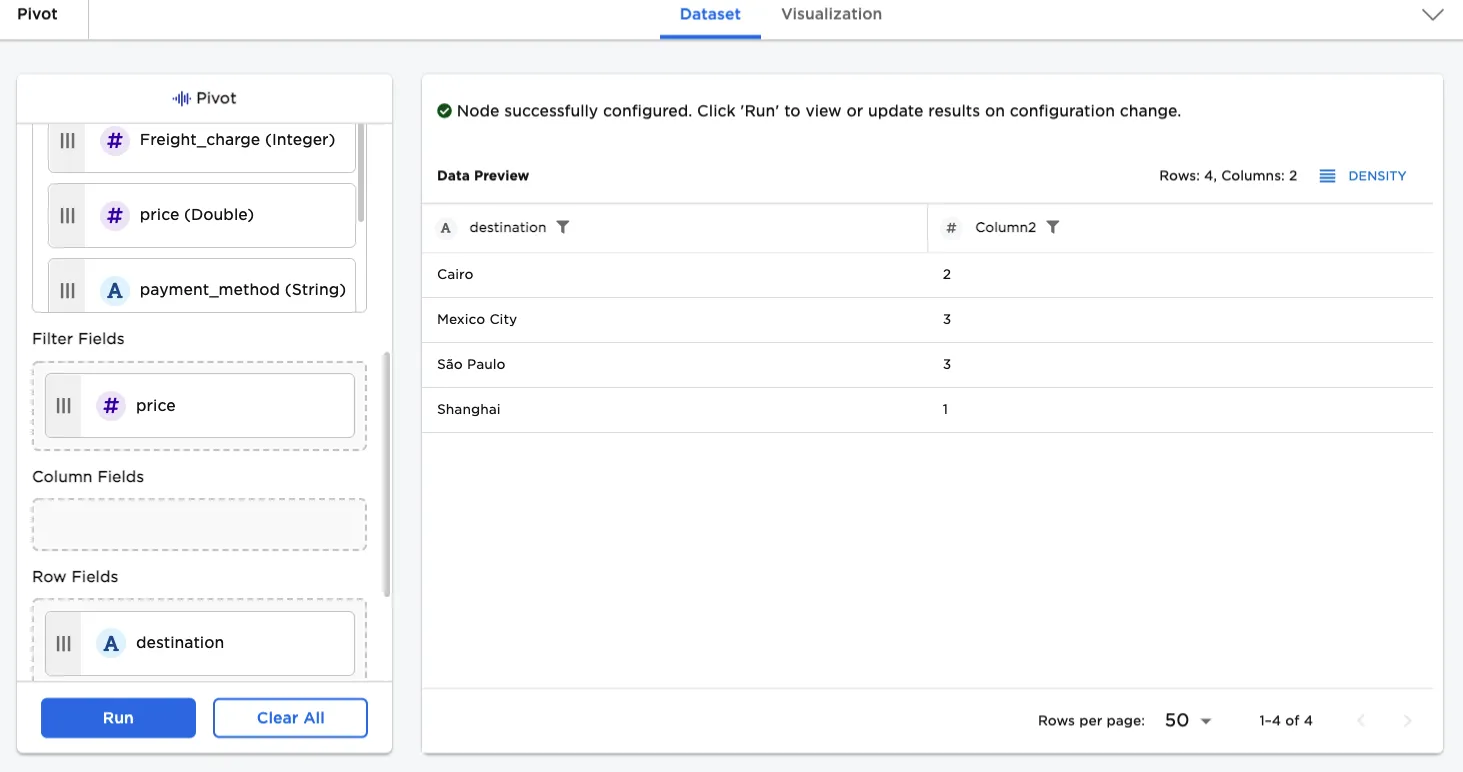
Figure 4: Table showing order counts subject to a price threshold condition
A pivot table can answer more advanced questions, too. You know how many orders valued over $500 were shipped to each destination, but your data also has information on payment methods. The next example modifies the table to show how many of each of the orders over $500 were paid for by credit card, how many were paid for by payment app, and how many were paid for using a bank account. To generate the table, do the following:
- Using the previous table, drag "payment_method" to Column Fields.
- Select Run.
This more granular look at the data indicates that there were two shipments valued over $500 paid for by bank accounts, that were shipped to Cairo. Additionally, there were no shipments to Shanghai paid for by bank account or credit card.
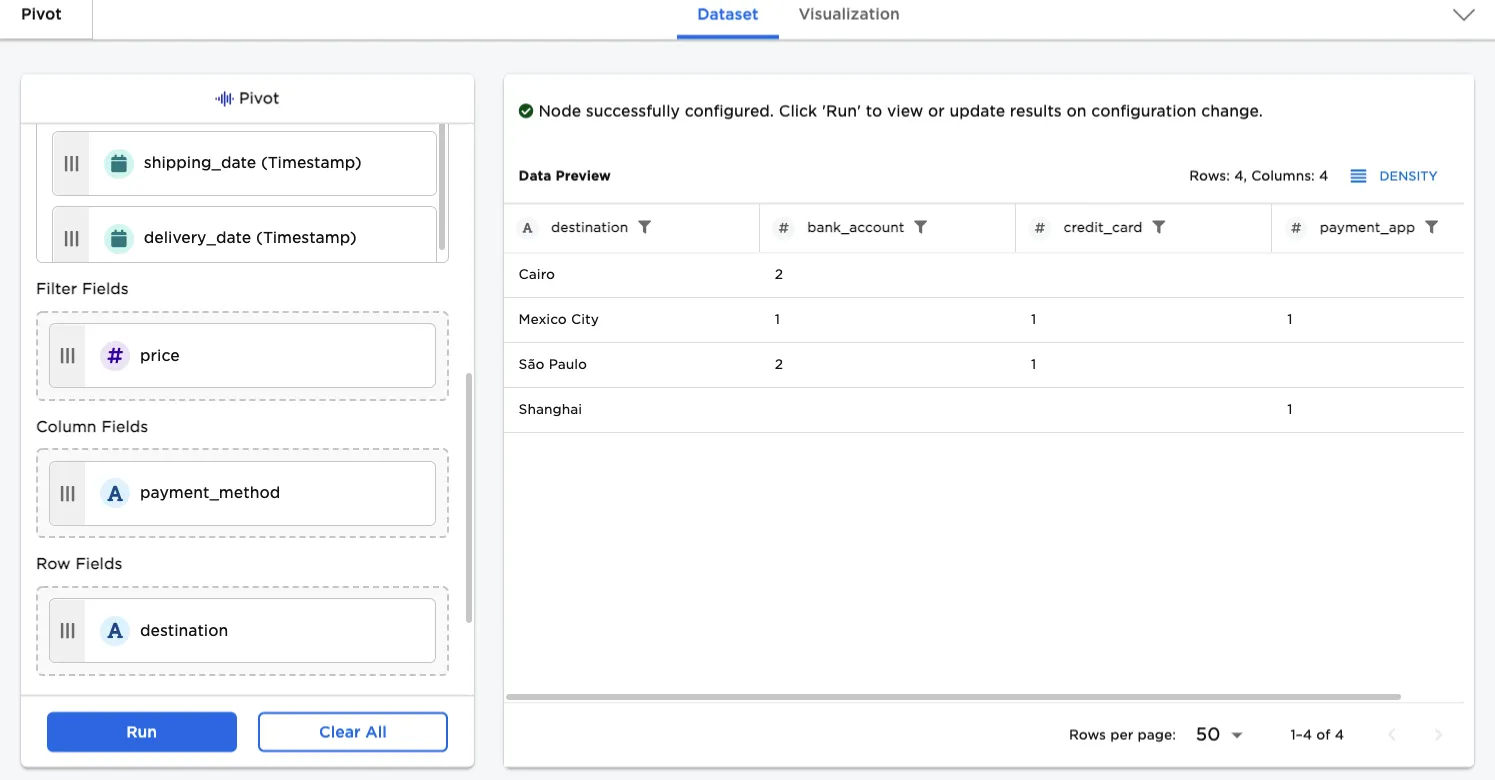
Figure 5: Orders broken out according to payment method
So far, we have counted orders, but we can also process numerical data with one of the other functions provided. In the next example, the table is modified to present the sum of freight charges, broken out by payment method, for all orders valued over $500. Construct the table by doing the following:
- From Value Fields, remove "order_number".
- Drag "Freight_charge" into this field.
- Hover over Value Fields, and when the filter icon becomes visible, select it, and specify Sum as the function.
- Select Run.
The resulting table indicates that the sum of freight charges for orders over $500 to Mexico City paid for by bank account is $54.
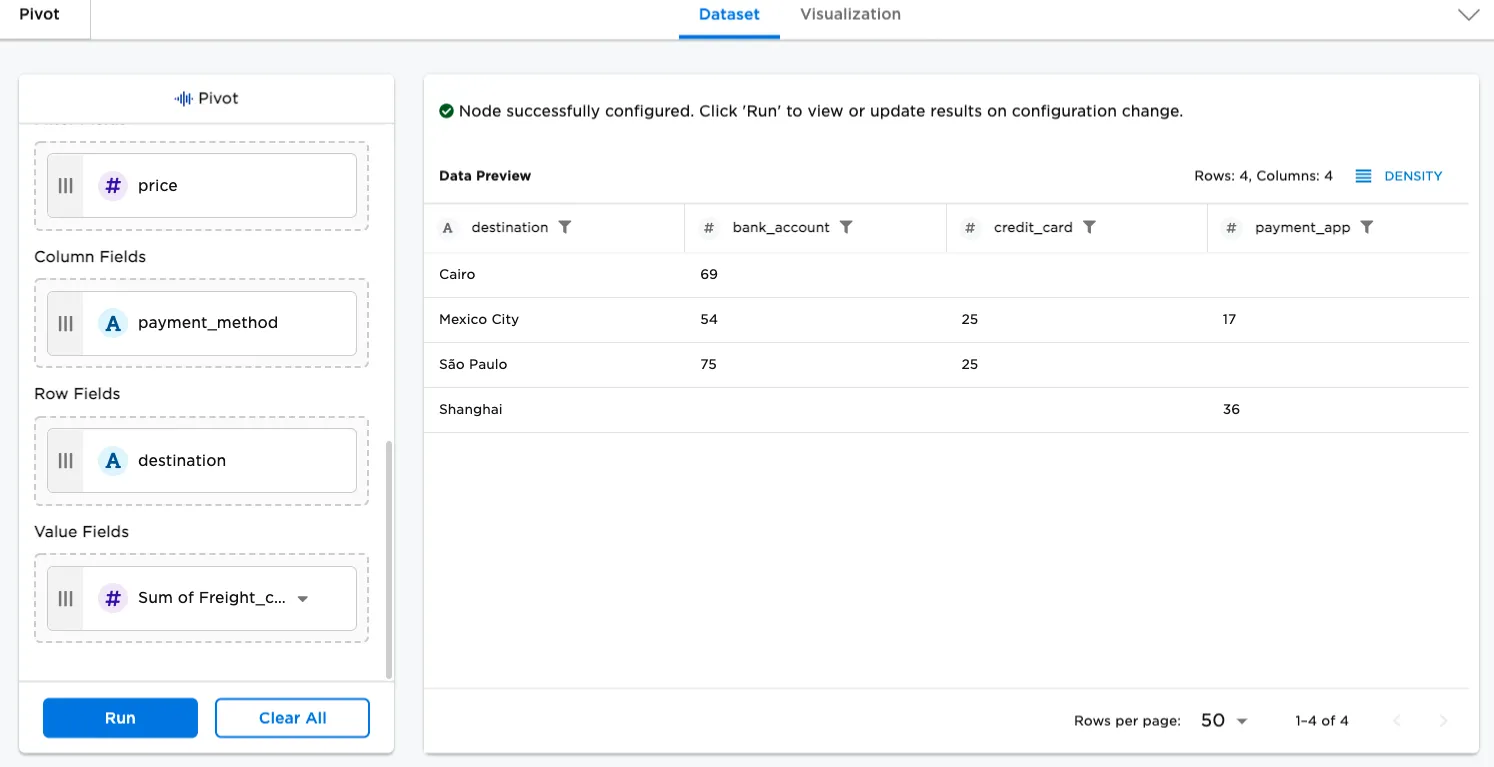
Figure 6: Sum of freight charges broken out by payment method