Robust Scaler
Normalize data in Visual Notebooks by, for each feature, removing the median and scaling to a quantile range. This scaler is a good choice when your data contains many outliers.
Normalization can be useful, and even required in some machine learning algorithms, when your data has input values and features with differing measurements and dimensions. The goal is to change the values of numeric columns in the dataset to use a common scale, without distorting differences in the ranges of values or losing information.
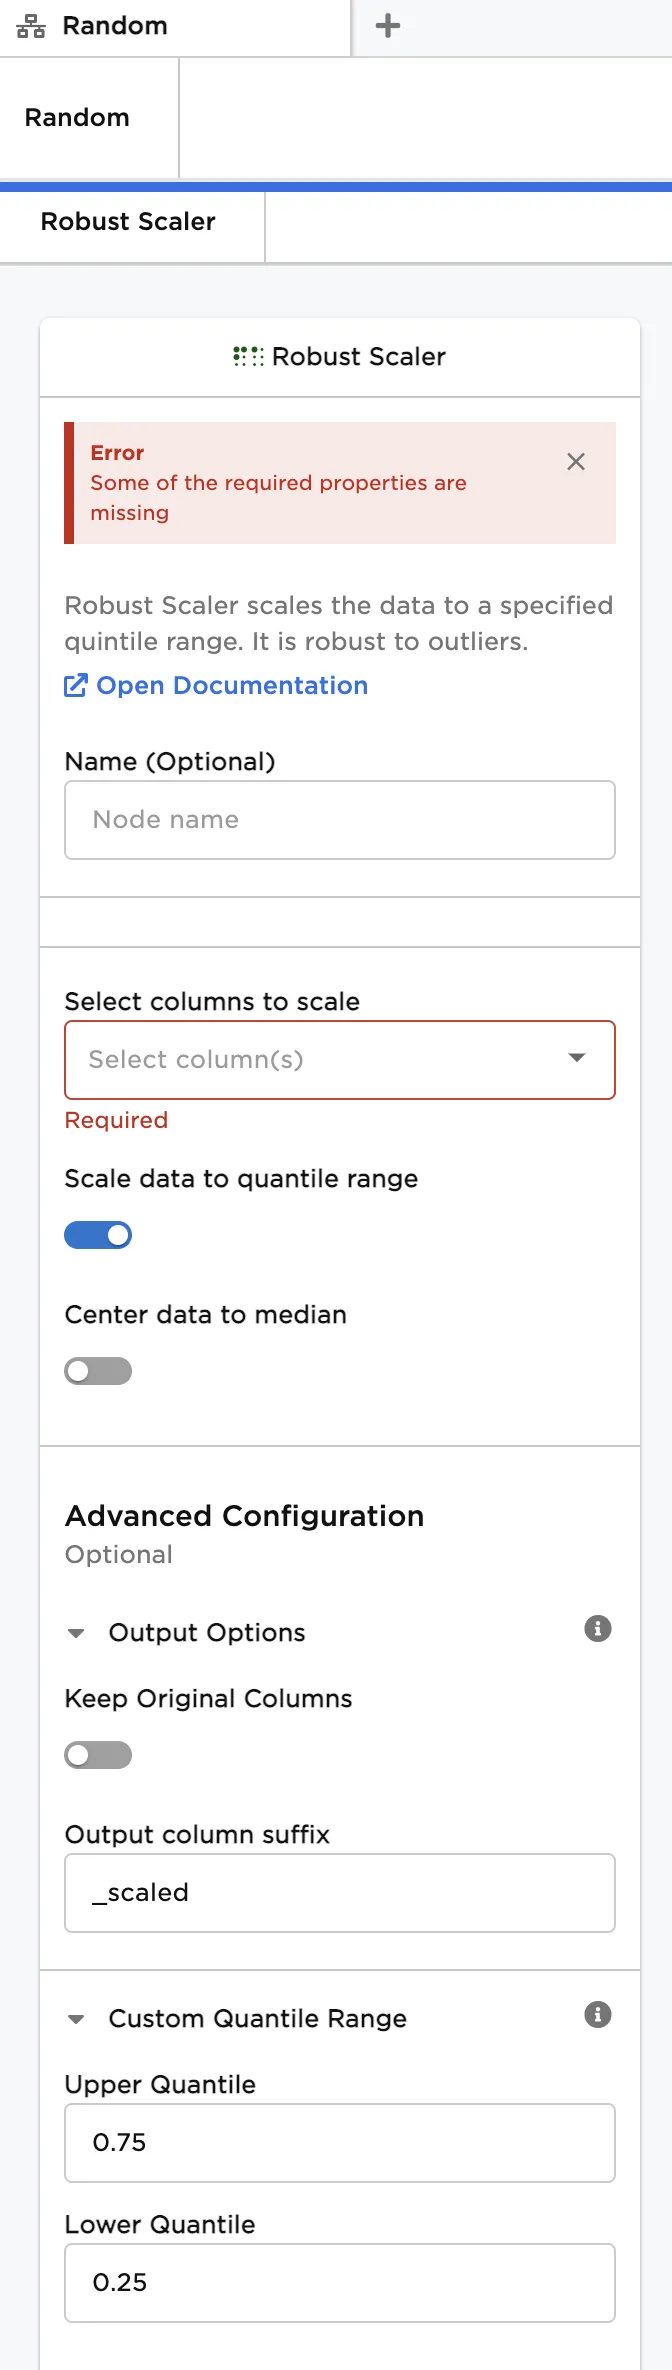
Configuration
| Field | Description |
|---|---|
| Name | Name of the node A user-specified node name, displayed in the canvas and in the dataframe as a tab. |
| Select columns to scale | Columns to transform with the scaling operation Select one or more numerical columns to scale. Values in each column are scaled by the quantile range of the column. |
| Scale data to quantile range | Incorporate quantile range into scaling calculation Leave this switch on to divide values in each column by the quantile range (i.e., Upper Quantile - Lower Quantile) of the column. Toggle the switch off to prevent scaling by the quantile range. |
| Center data to median | Incorporate median into scaling calculation Toggle this switch on to subtract values in each column by the median of the column. This results in a column median of zero. Leave the switch off to prevent centering by the median. |
| Keep Original Columns | Keep columns with unscaled data Toggle this switch on to keep the unscaled columns and create a new column with the scaled data. Keep the switch on to replace the unscaled columns with scaled data. |
| Upper Quantile | Upper limit for quantile range Enter a value between 0.0 and 1.0 to set the upper quantile. |
| Lower Quantile | Lower limit for quantile range Enter a value between 0.0 and 1.0 to set the lower quantile. |
Node Inputs/Outputs
| Input | A Visual Notebooks dataframe |
|---|---|
| Output | A dataframe with scaled data |
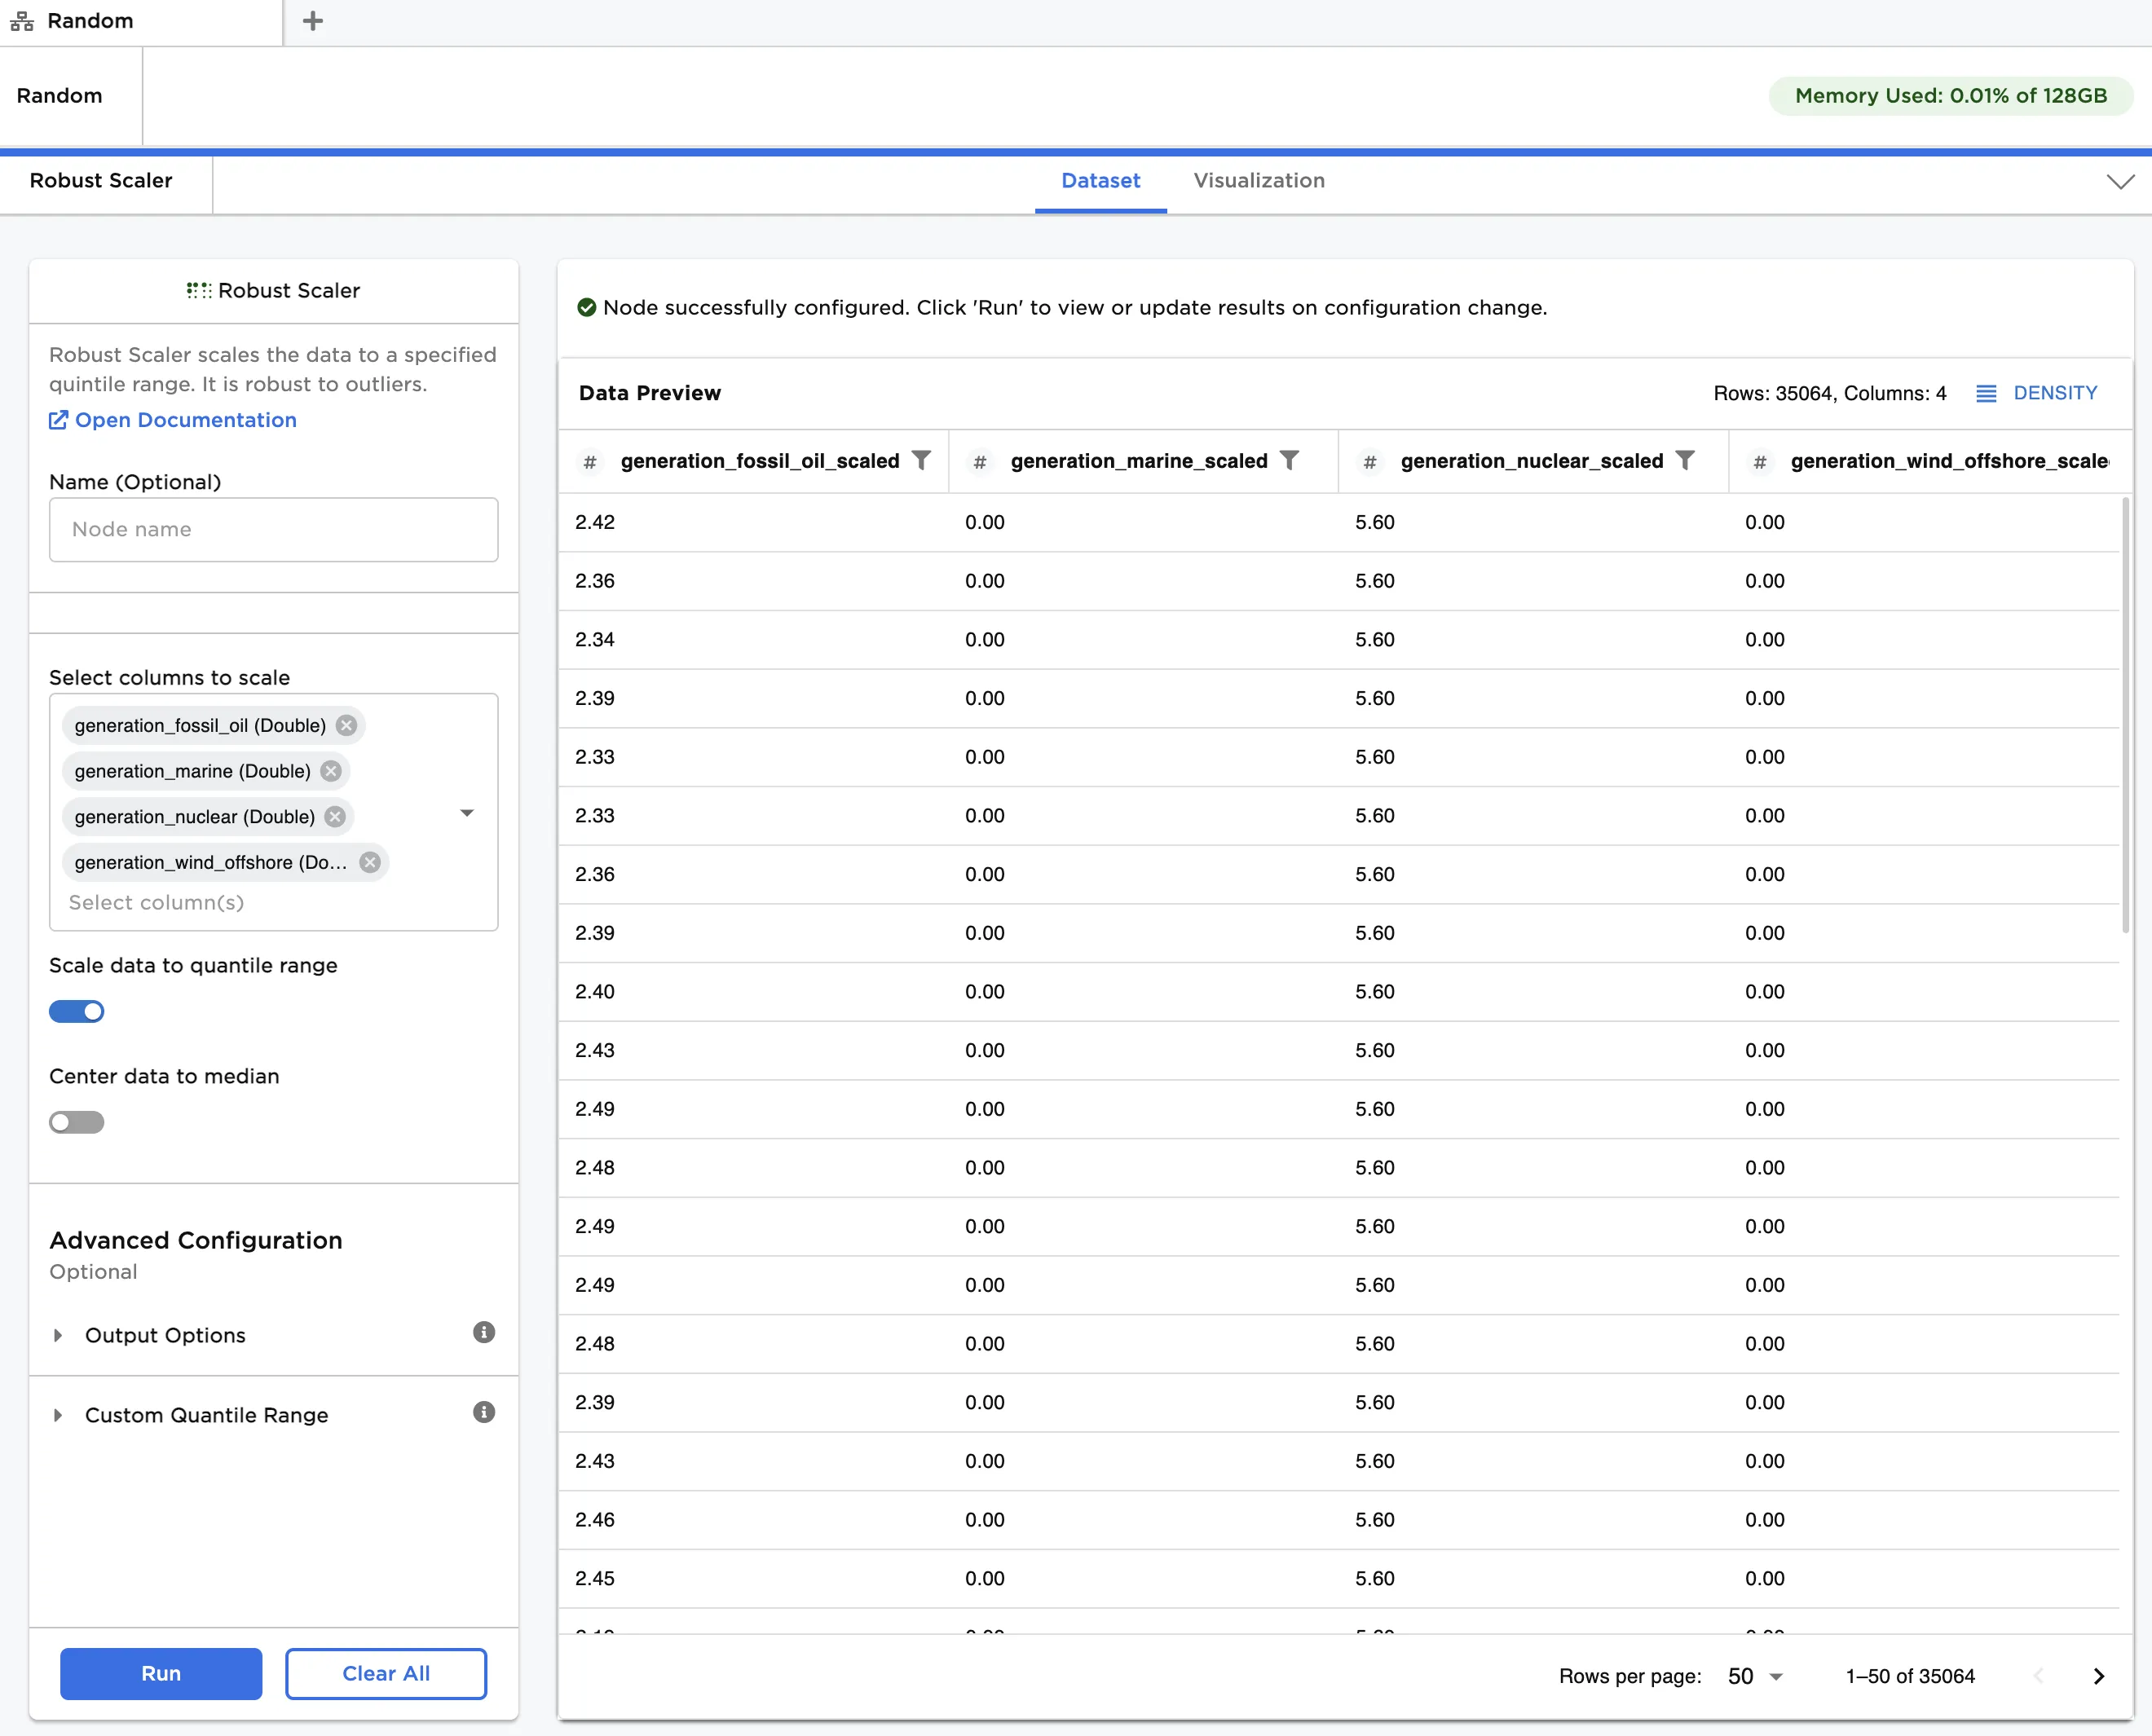
Figure 1: Example dataframe output
Examples
The hypothetical data shown in Figure 2 is used in this example. It contains personal lifestyle and financial data recorded at age 40, along with the age at death. We would like to use this data to predict life expectancy for other people at age 40. Given that there are several outliers in each feature, we will first normalize all data using the Robust Scaler node.
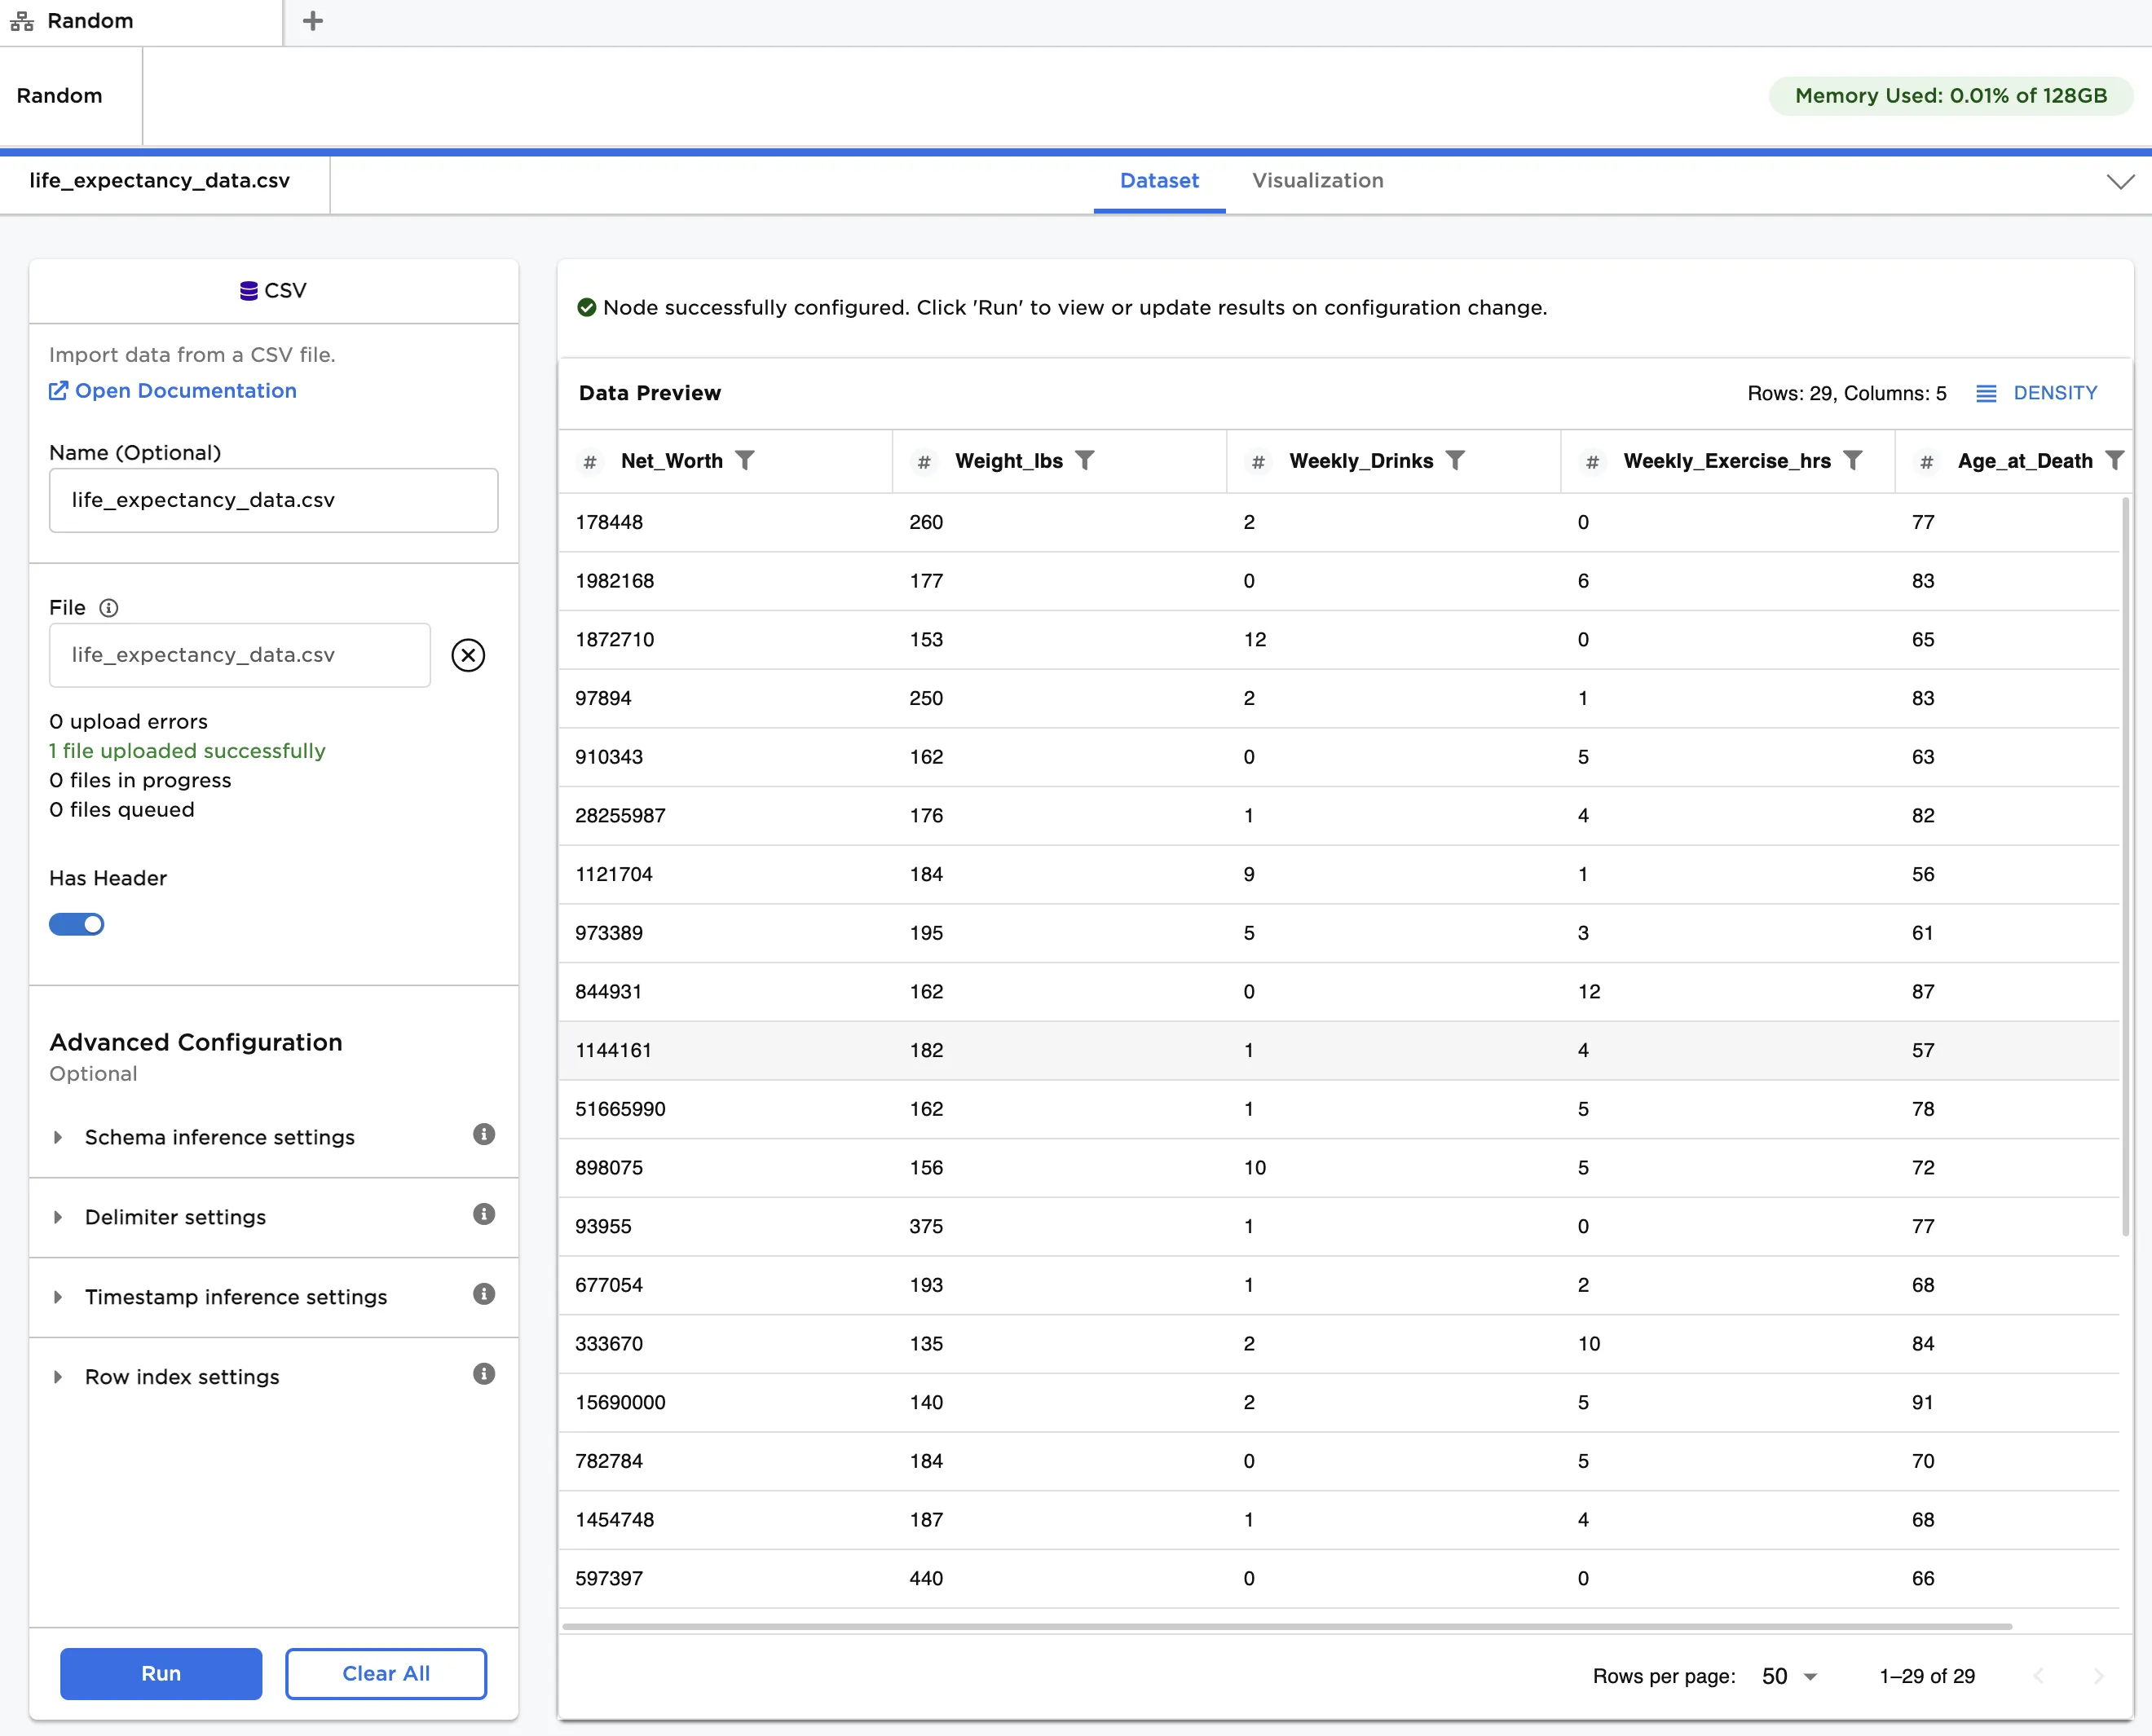
Figure 2: Example input data
Follow the steps below to normalize the input features:
- Connect a Robust Scaler node to an existing node
- In Select columns to scale, select all columns except Age_at_Death.
- Click Run to create a dataframe with the default settings. Observe that the original data is replaced with the scaled data. Each entry has been modified according to the following formula:
[ x_{scaled} = x/(Q_{upper} - Q_{lower}) ]
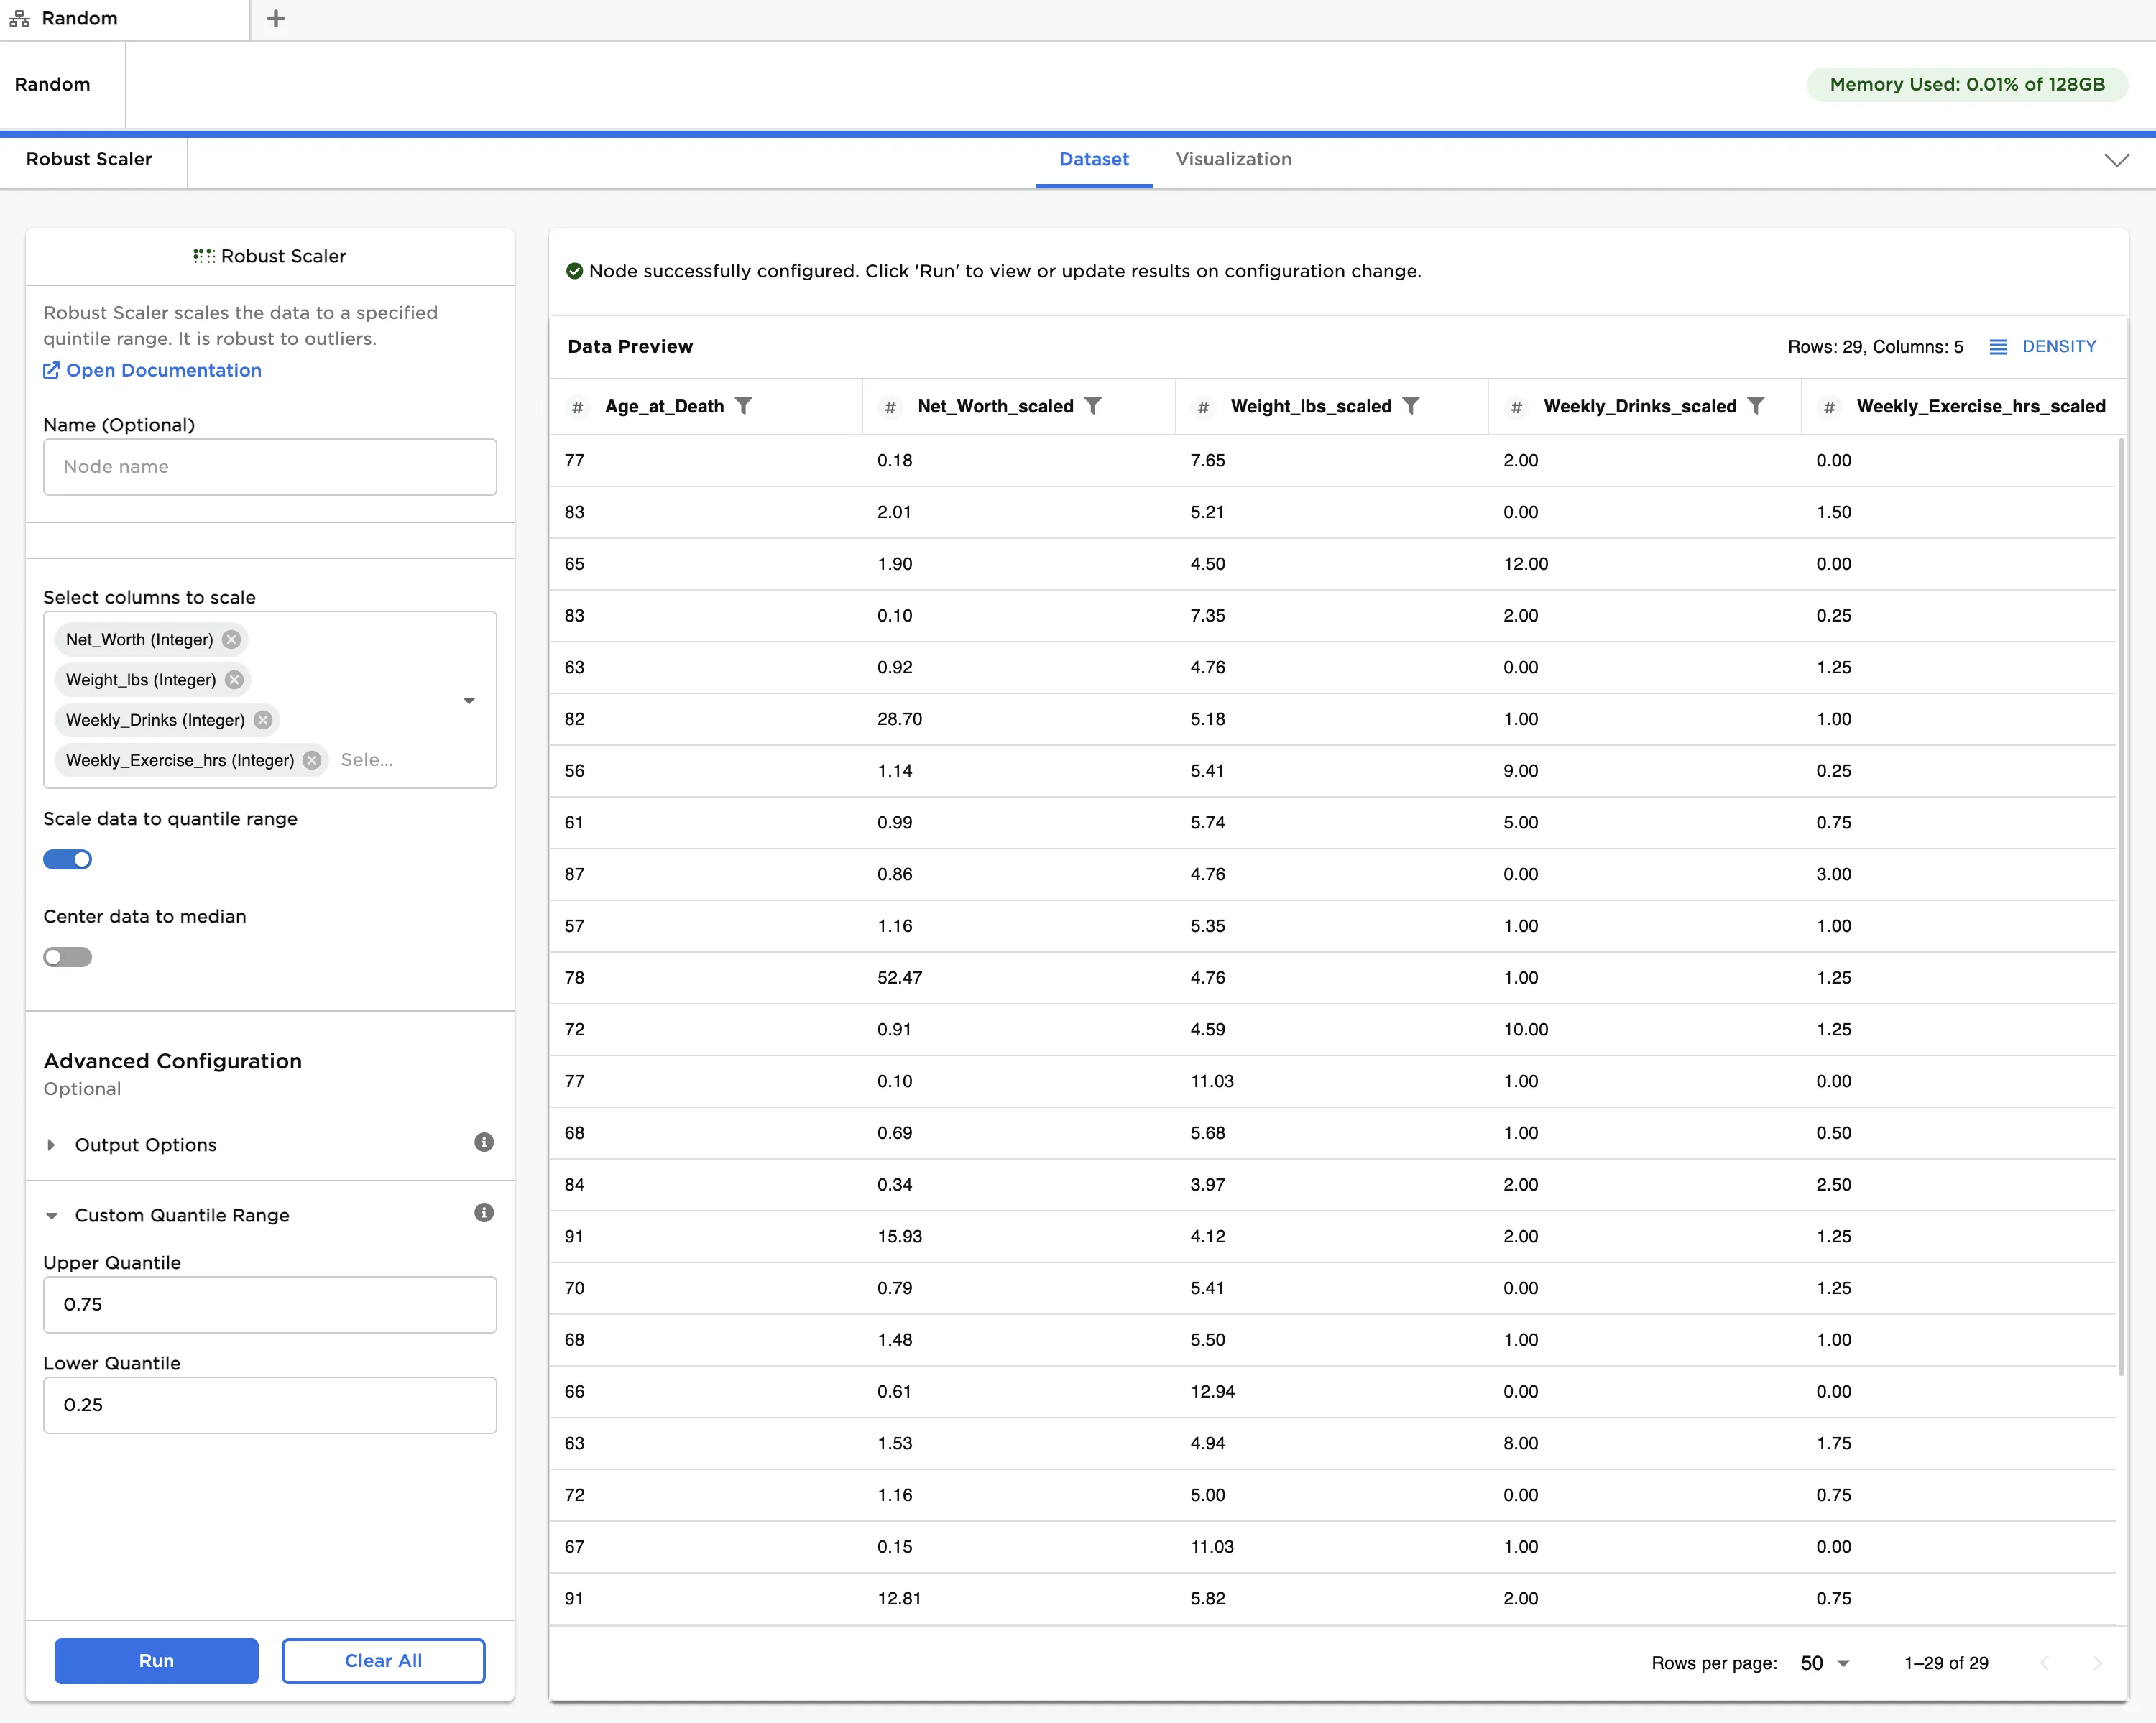
Figure 3: Example dataframe with default settings
- Toggle the Center data to median and Keep Original Columns switches on.
- Click Run to create a dataframe. Observe that the scaled data is now centered around a zero median. Each entry has been modified according to the following formula:
[ x' = (x - x_{med})/(Q_{upper} - Q_{lower}) ]
Additionally, both the original data and the scaled data, which uses the "_scaled" suffix, are displayed in the output
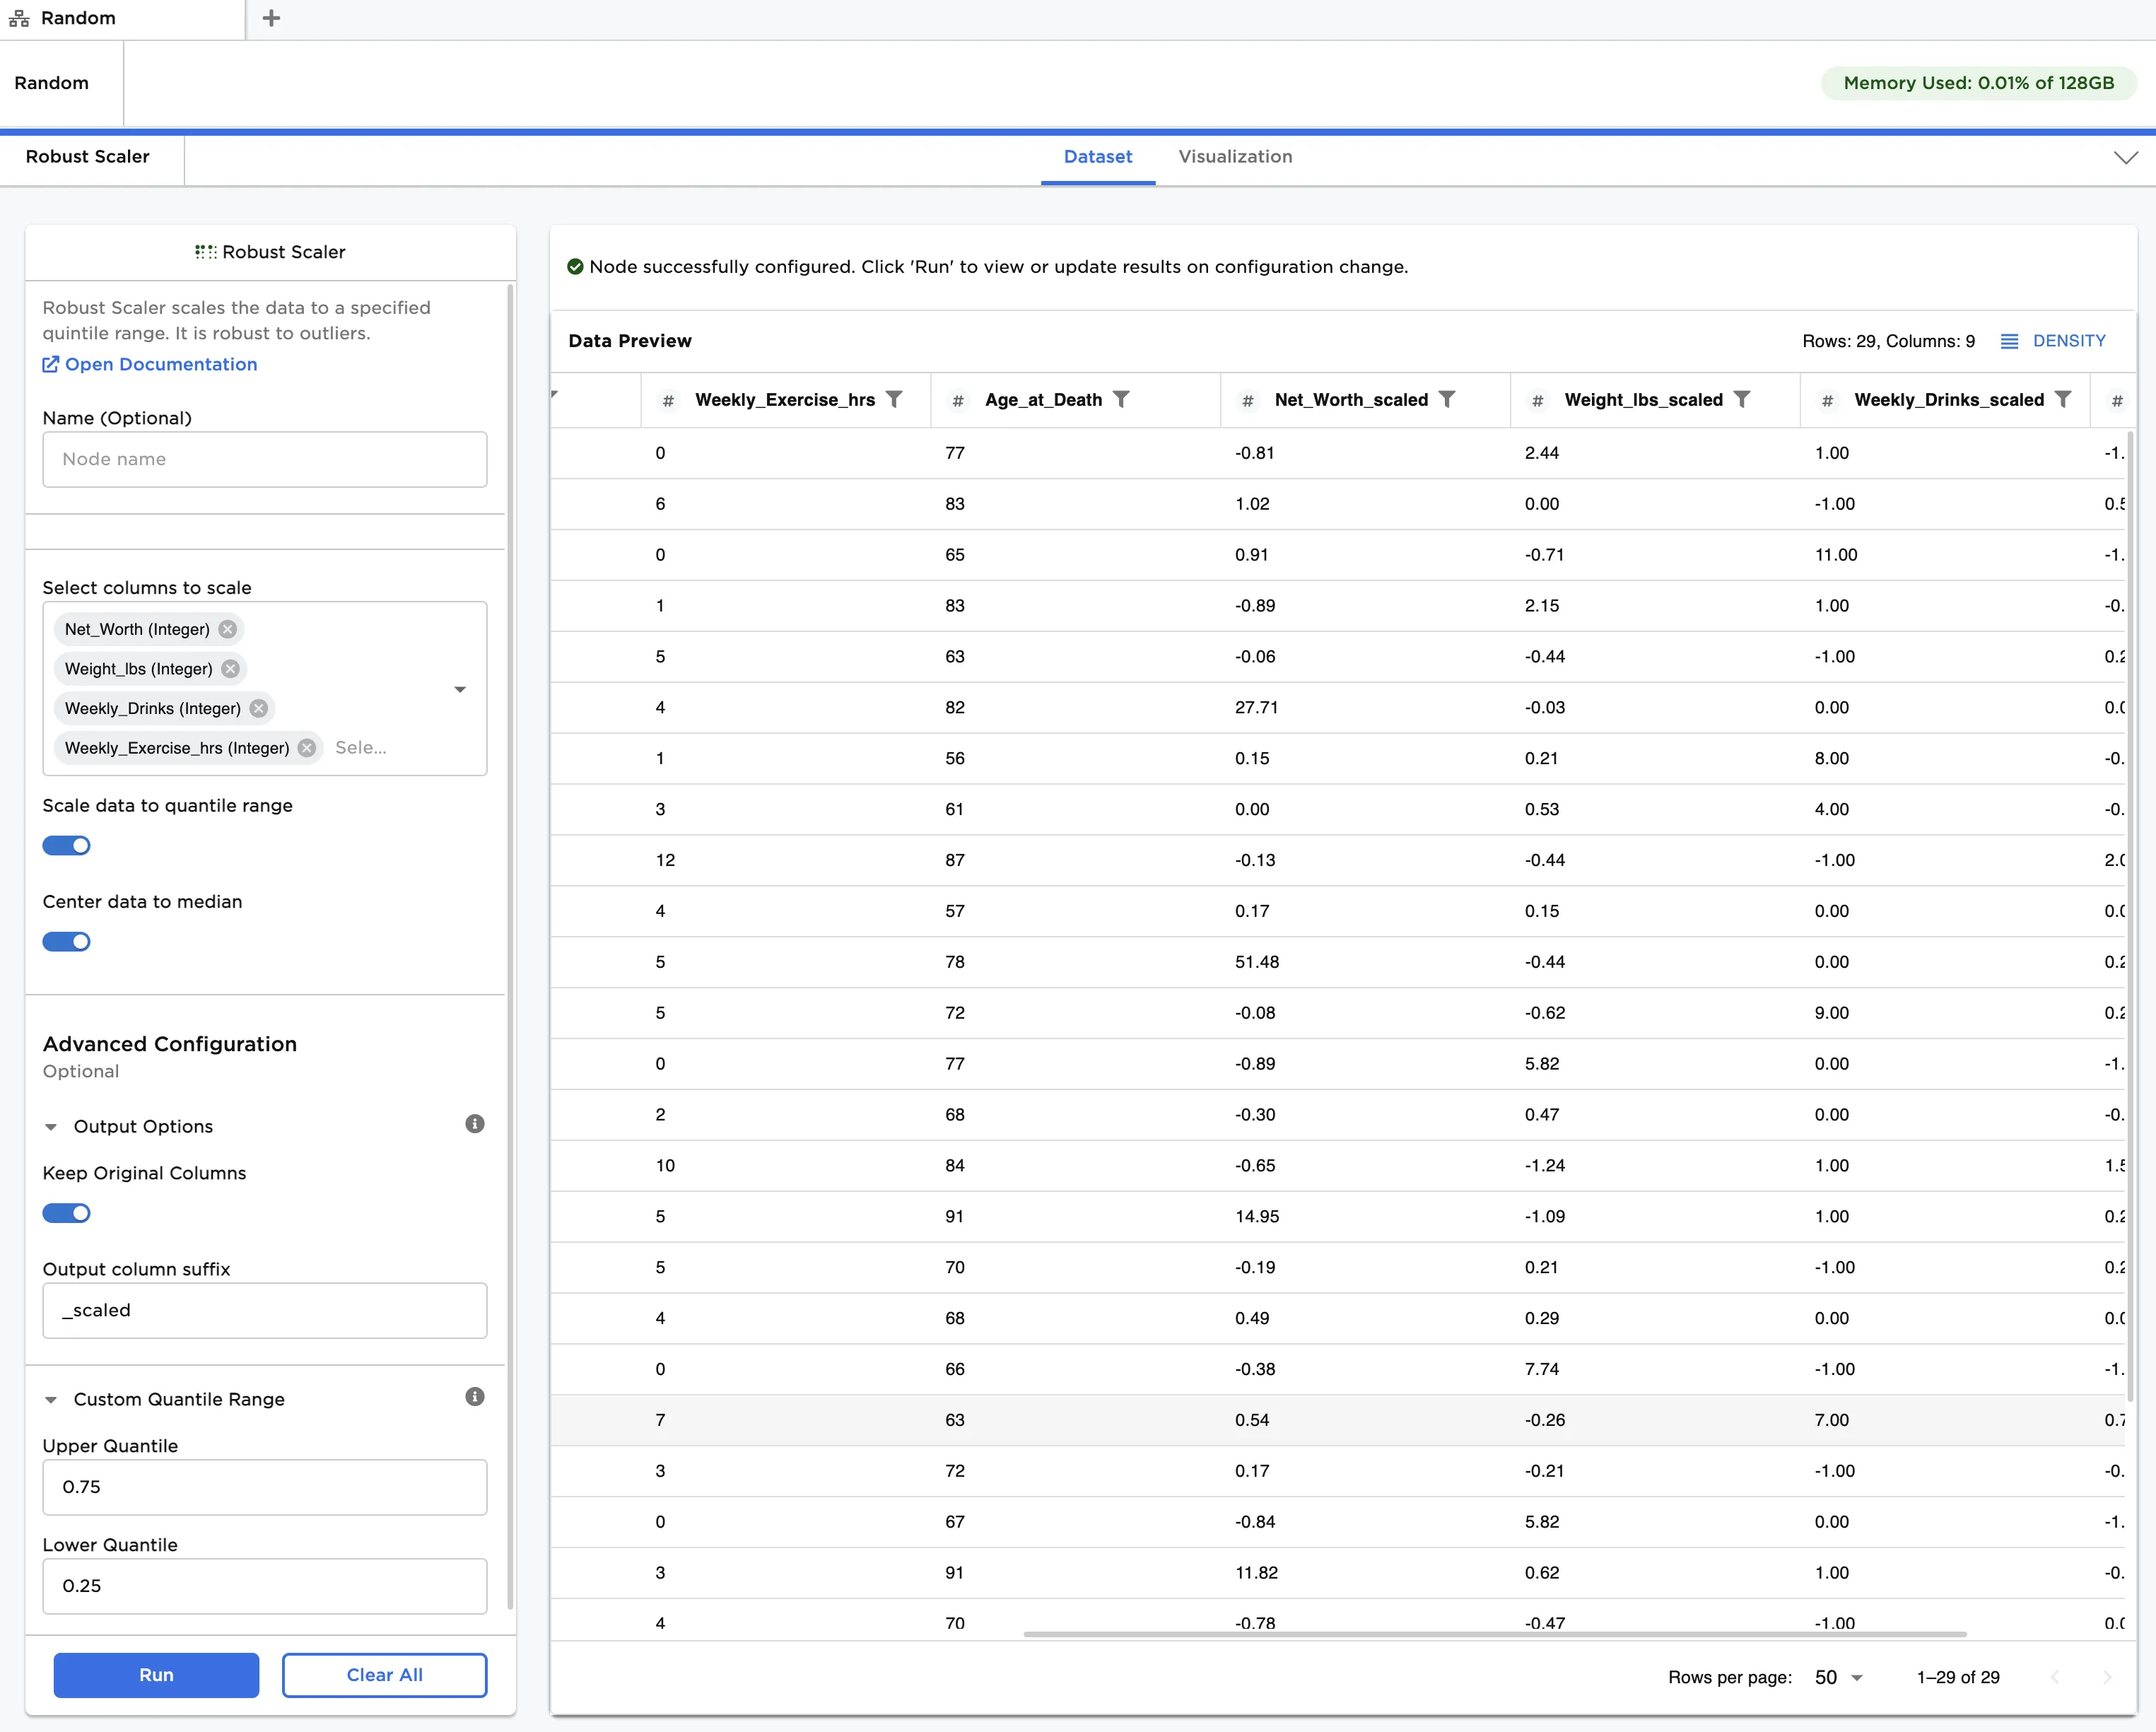
Figure 4: Example dataframe with scaled and median-centered data