Rolling Window
Perform operations over a specified period of time.
Configuration
| Field | Description |
|---|---|
| Name | A user-specified node name displayed in the workspace |
| Time Column | The column with timestamps Select the column with timestamps from the auto-populated dropdown menu. If all of the columns in the menu appear dimmed, use a "Columns - Type Converter" node to convert the time column to the timestamp data type. |
| Group by | Timeseries grouping Select "group data by column" to group timeseries data by another column. This is useful if you have timeseries data that corresponds to multiple items. |
| Select column to partition with: | The column to group by If "group data by column" is selected in the field above, select a column to group by from the auto-populated dropdown menu. |
| Select Window Column(s) | The column to perform functions on Select a numerical column from the auto-populated dropdown menu. If all of the columns in the menu appear dimmed, use a "Columns - Type Converter" node to convert the desired column to a numerical data type. |
| Select Function(s) | The function to perform on the selected column Select any combination of average, sum, difference, maximum, minimum, standard-deviation, or variance. A new column is created with the results of each selected function. |
| Select Window(s) | The amount of rows to use when performing functions Enter a positive integer to use each row and the specified number of rows above it in the given calculation. Enter a negative integer to use each row and the specified number of rows below it in the given calculation. If you enter a positive number, the output column is prefixed with "lag". If you enter a negative number, the output column is prefixed with "lead". |
Node Inputs/Outputs
| Input | A Visual Notebooks dataframe |
|---|---|
| Output | A dataframe with the selected functions performed on the given window. Results are in a new column that is prefixed with the word lead or lag, the window, and the function name. |
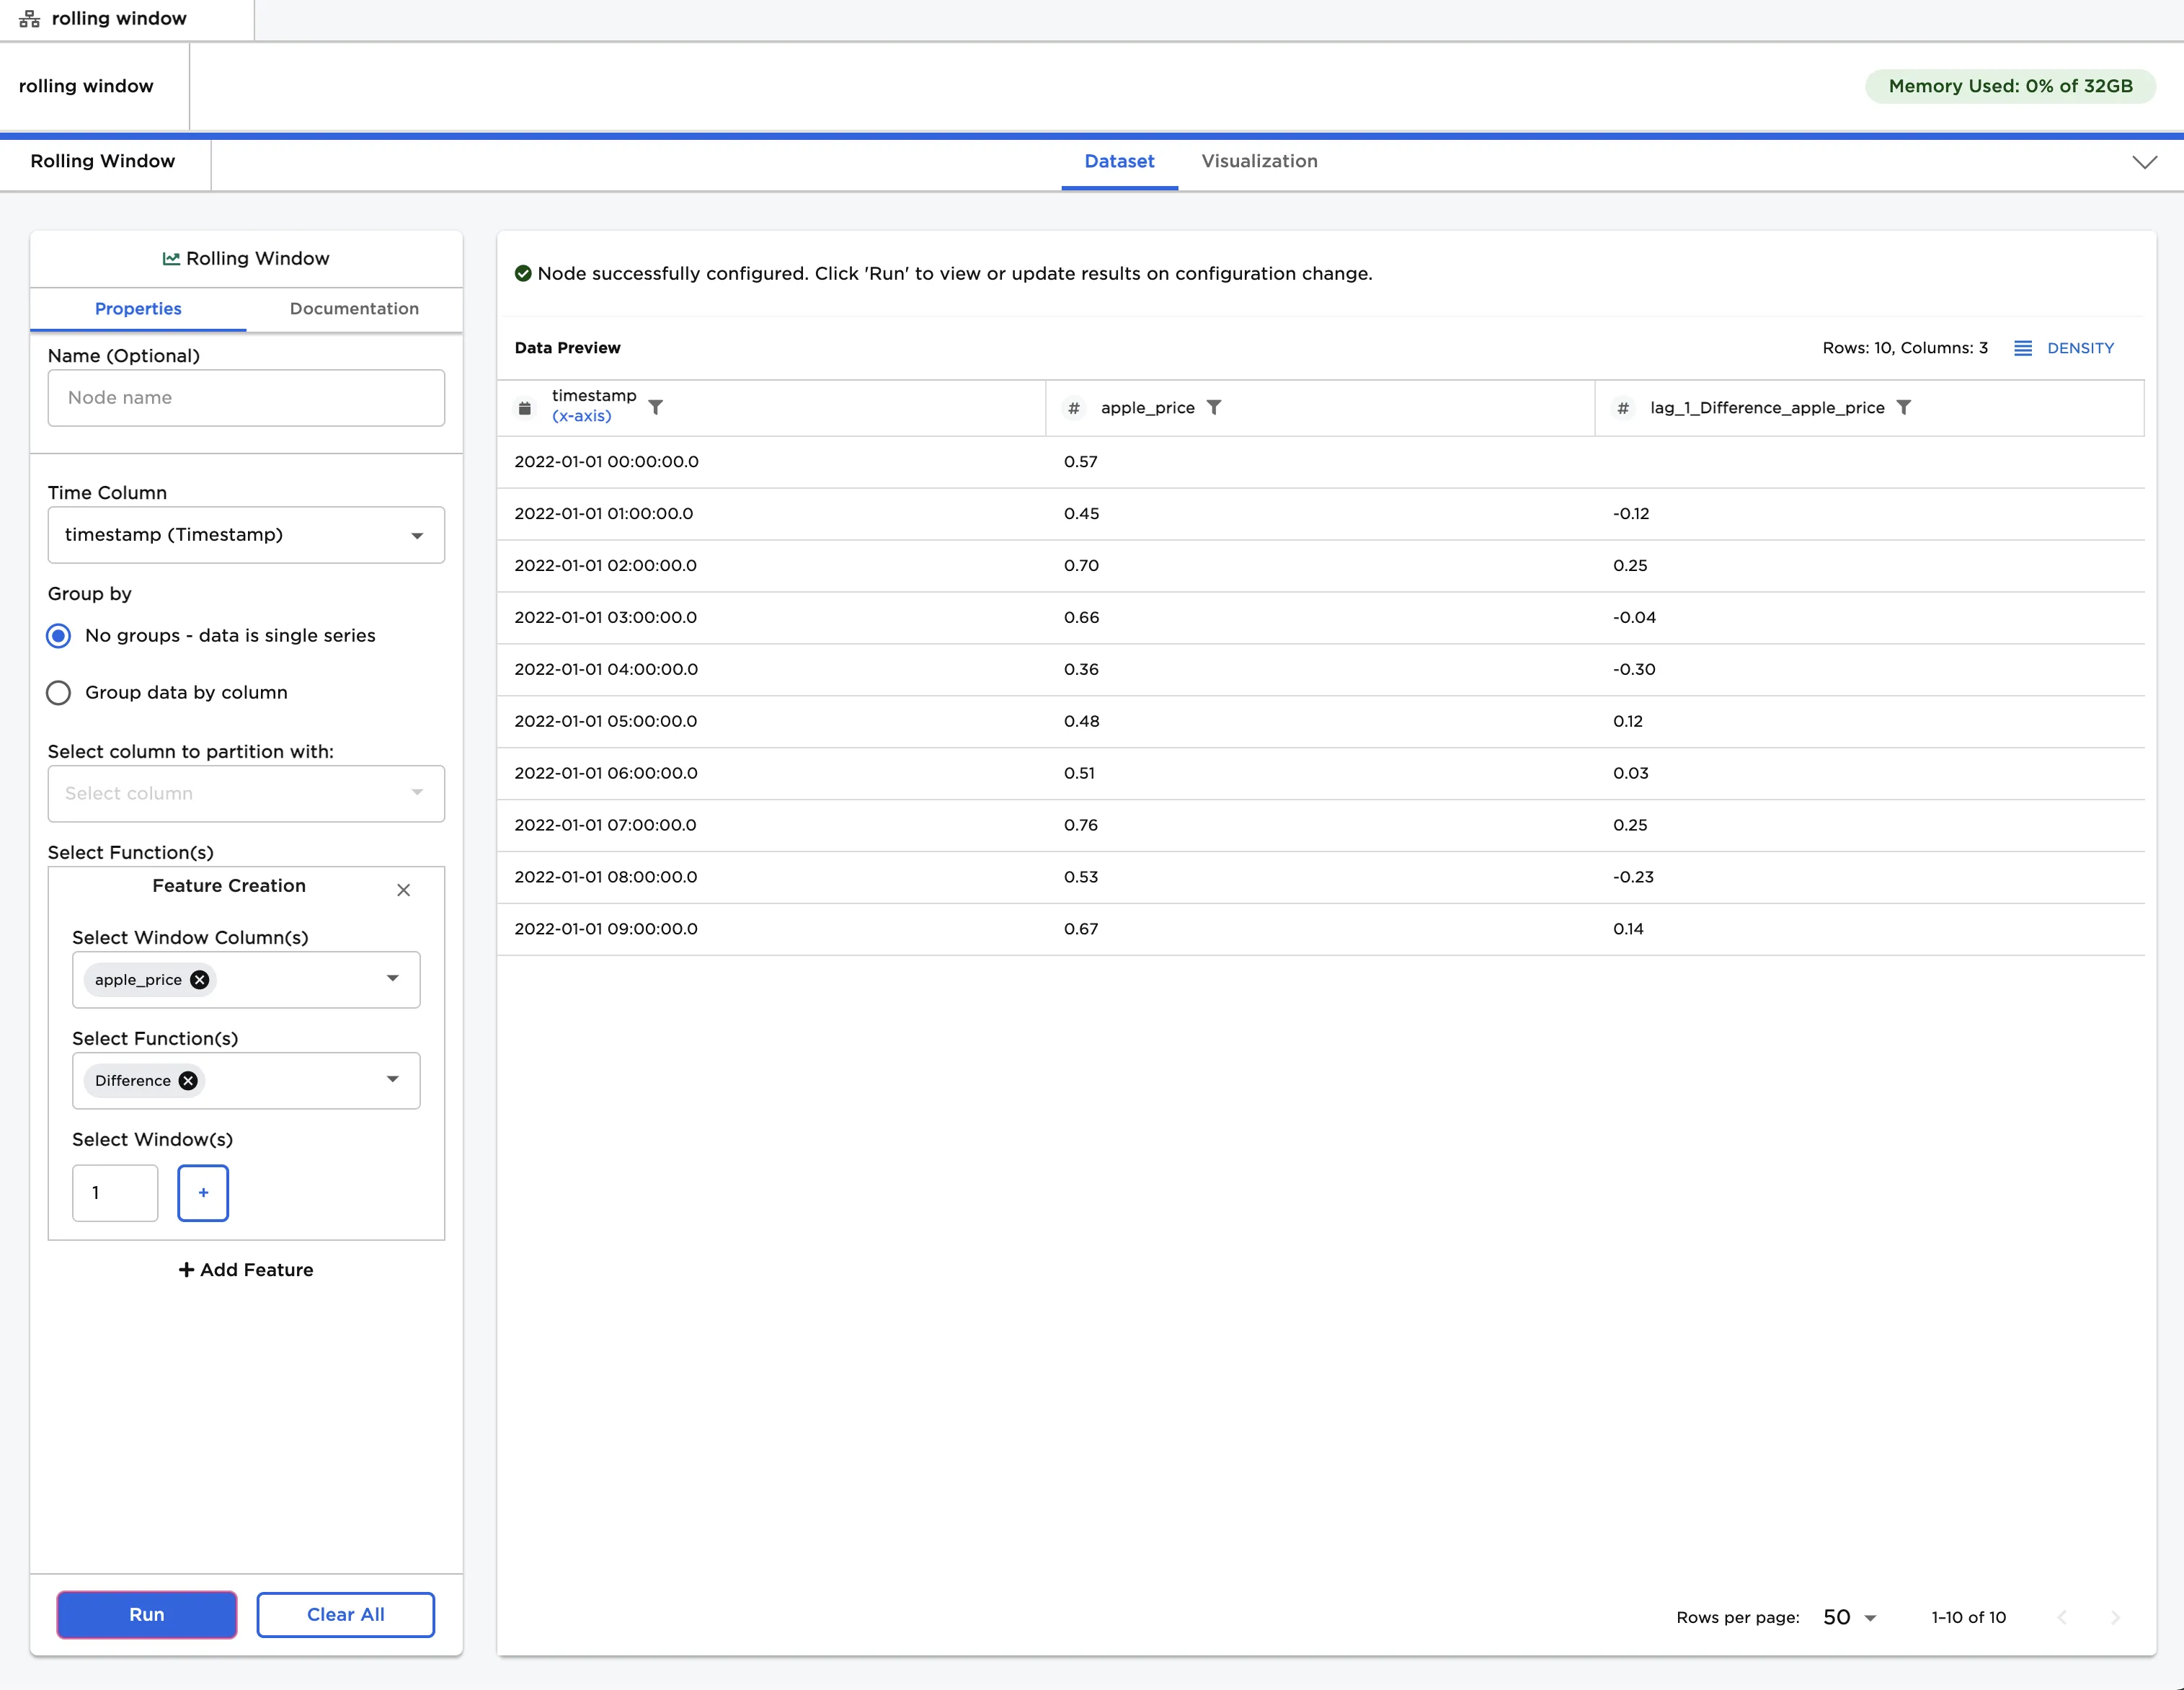
Figure 1: Example output
Examples
- Connect a Rolling Window to an existing node. The input dataframe must contain a timestamp column.
- The dataframe shown below is used in this example. It shows the price of an apple every hour from midnight to 9:00 AM on 1/1/2022. This data is presented as a column of timestamps and a column of prices. Imagine that you want to determine the change in price every hour.
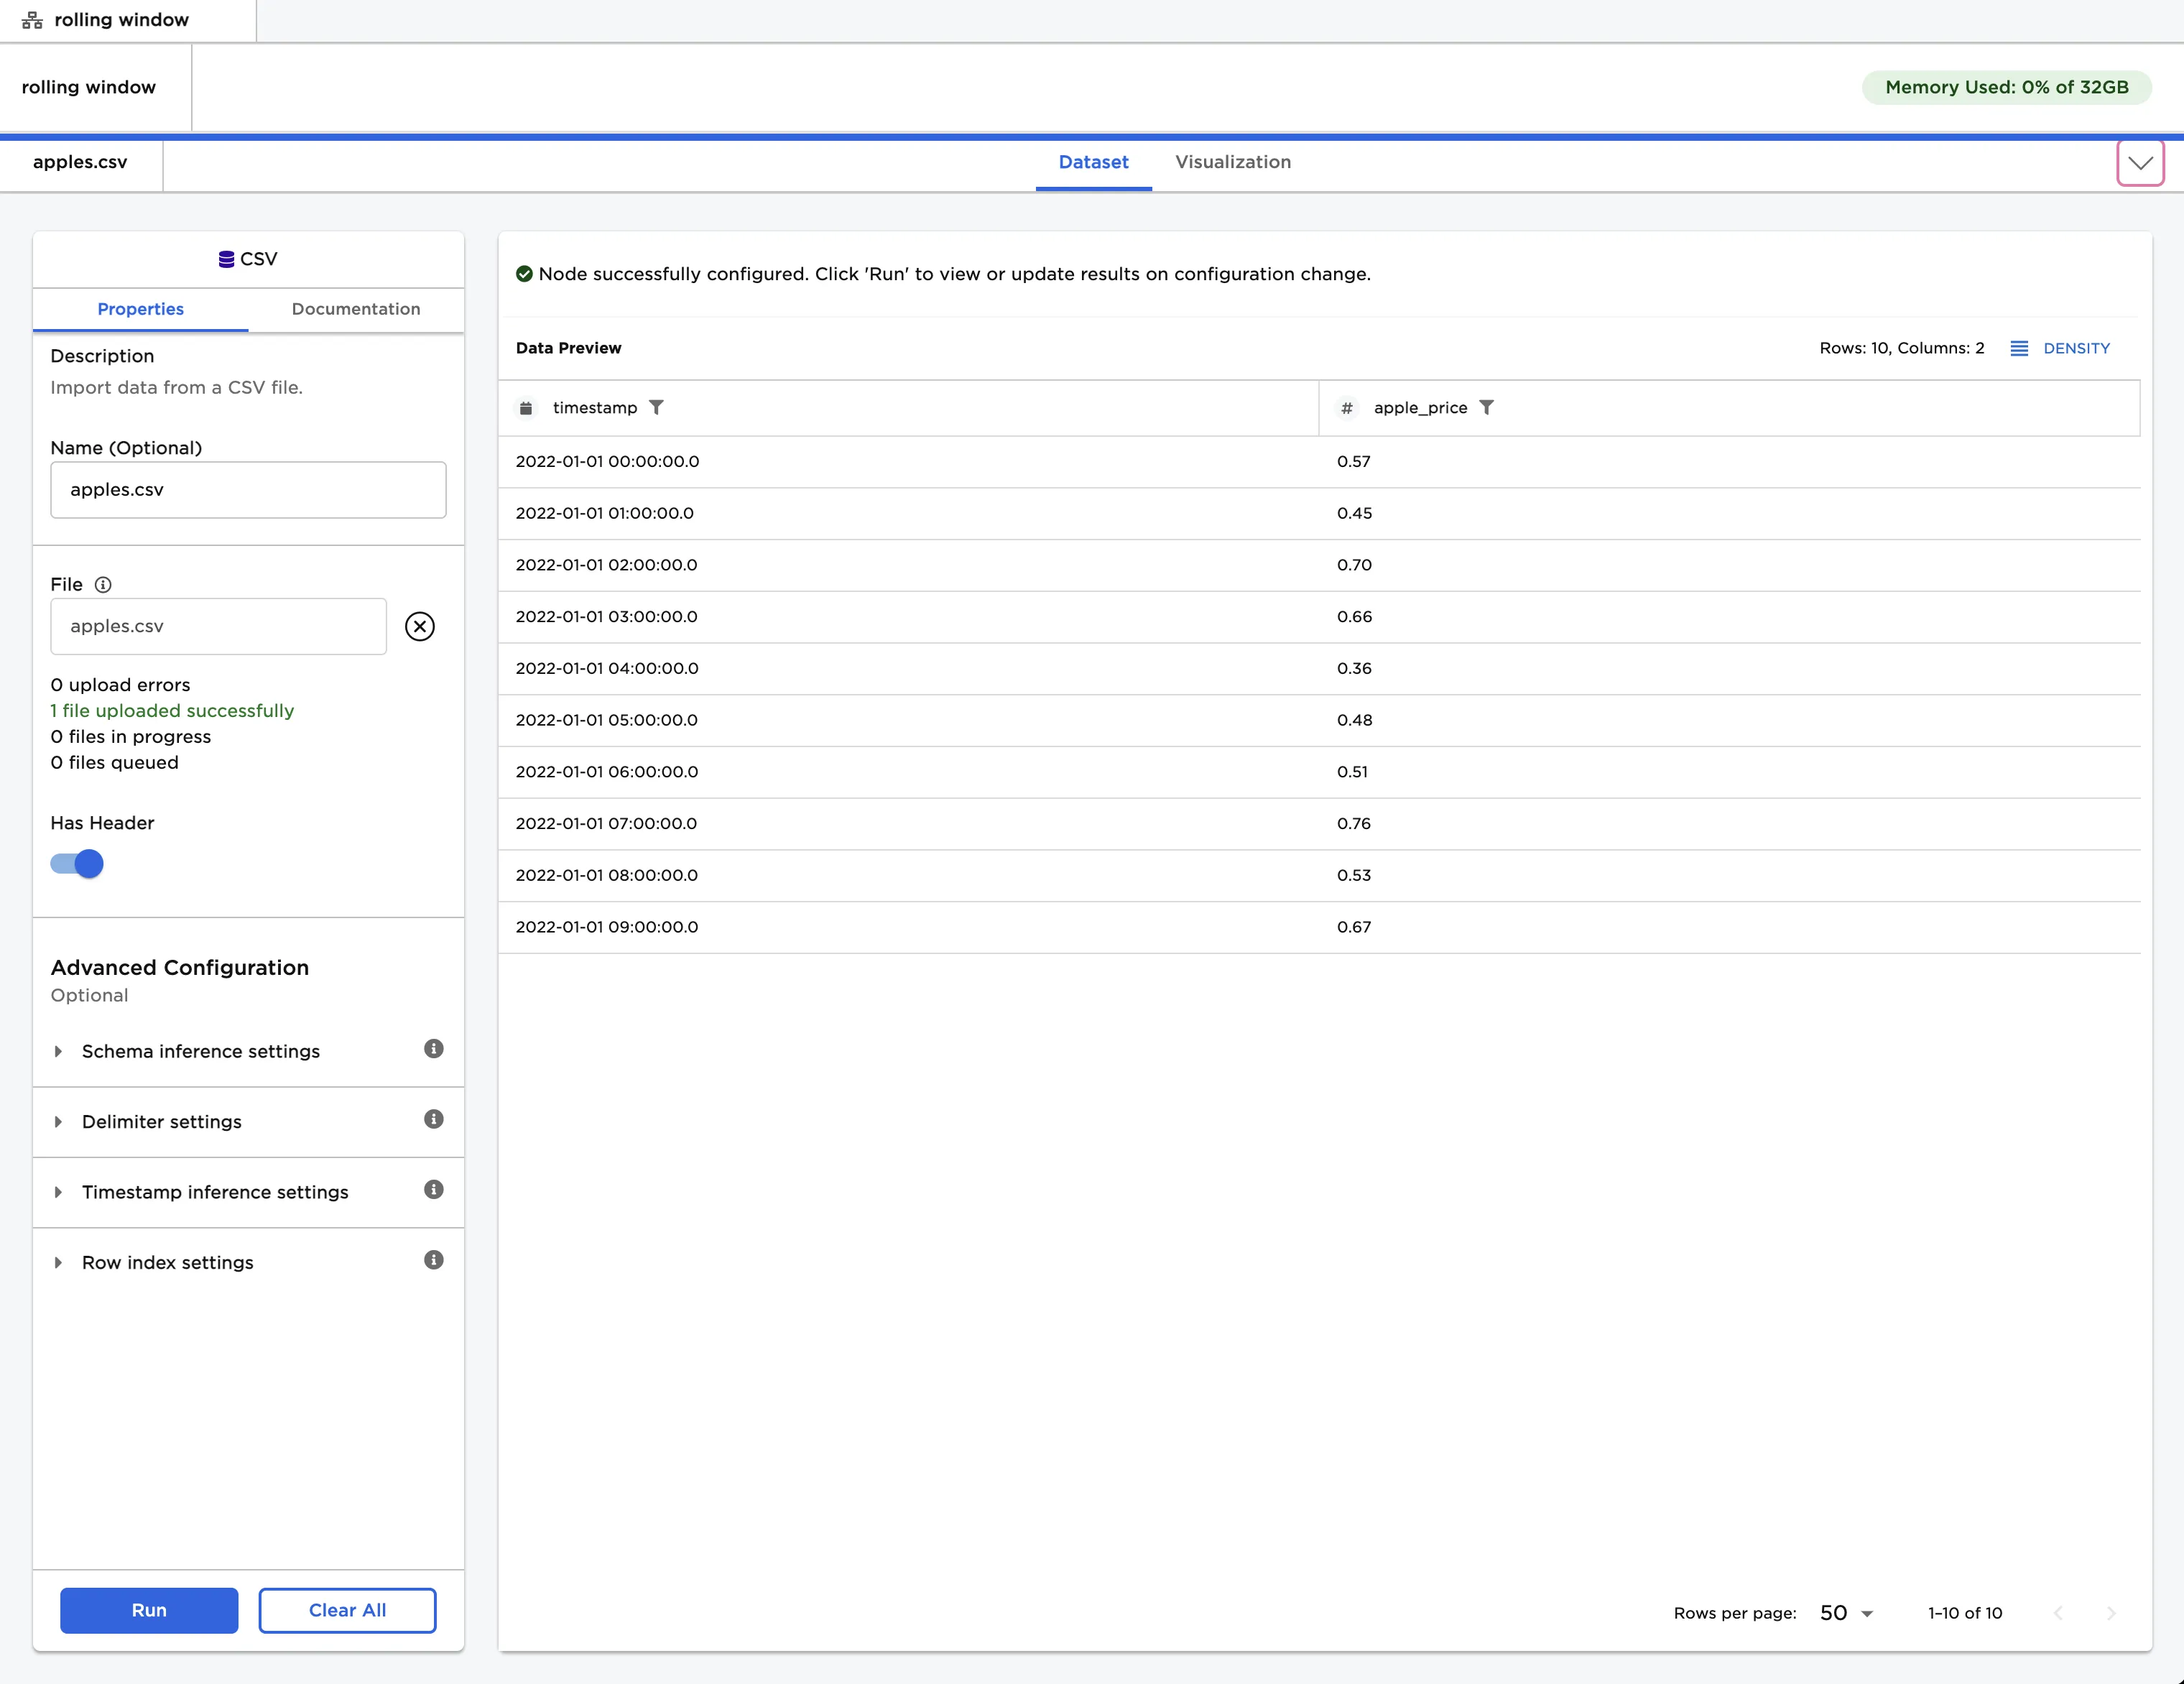
Figure 2: Example input data
- Select the "timestamp" column for the "Time Column" field.
- Select the "price" column for the "Select Window Column(s)" field.
- Select the "Difference" function and enter "1" for the window. This tells Ex Machina to use each row and one row before it when performing the selected calculation.
- Select "Run" to create an additional column that contains the difference in price for each hour.
- Notice that Visual Notebooks creates a new column called "lag_1_Difference_price".
- The first value in the new column is blank because there isn't a row above it to use in the calculation.
Figure 3: Example dataframe output with all data as a single series
- Imagine that you have price data for multiple fruits. The dataframe shown below is used for the remainder of this example.
- Notice that there is an additional column with the name of the fruit.
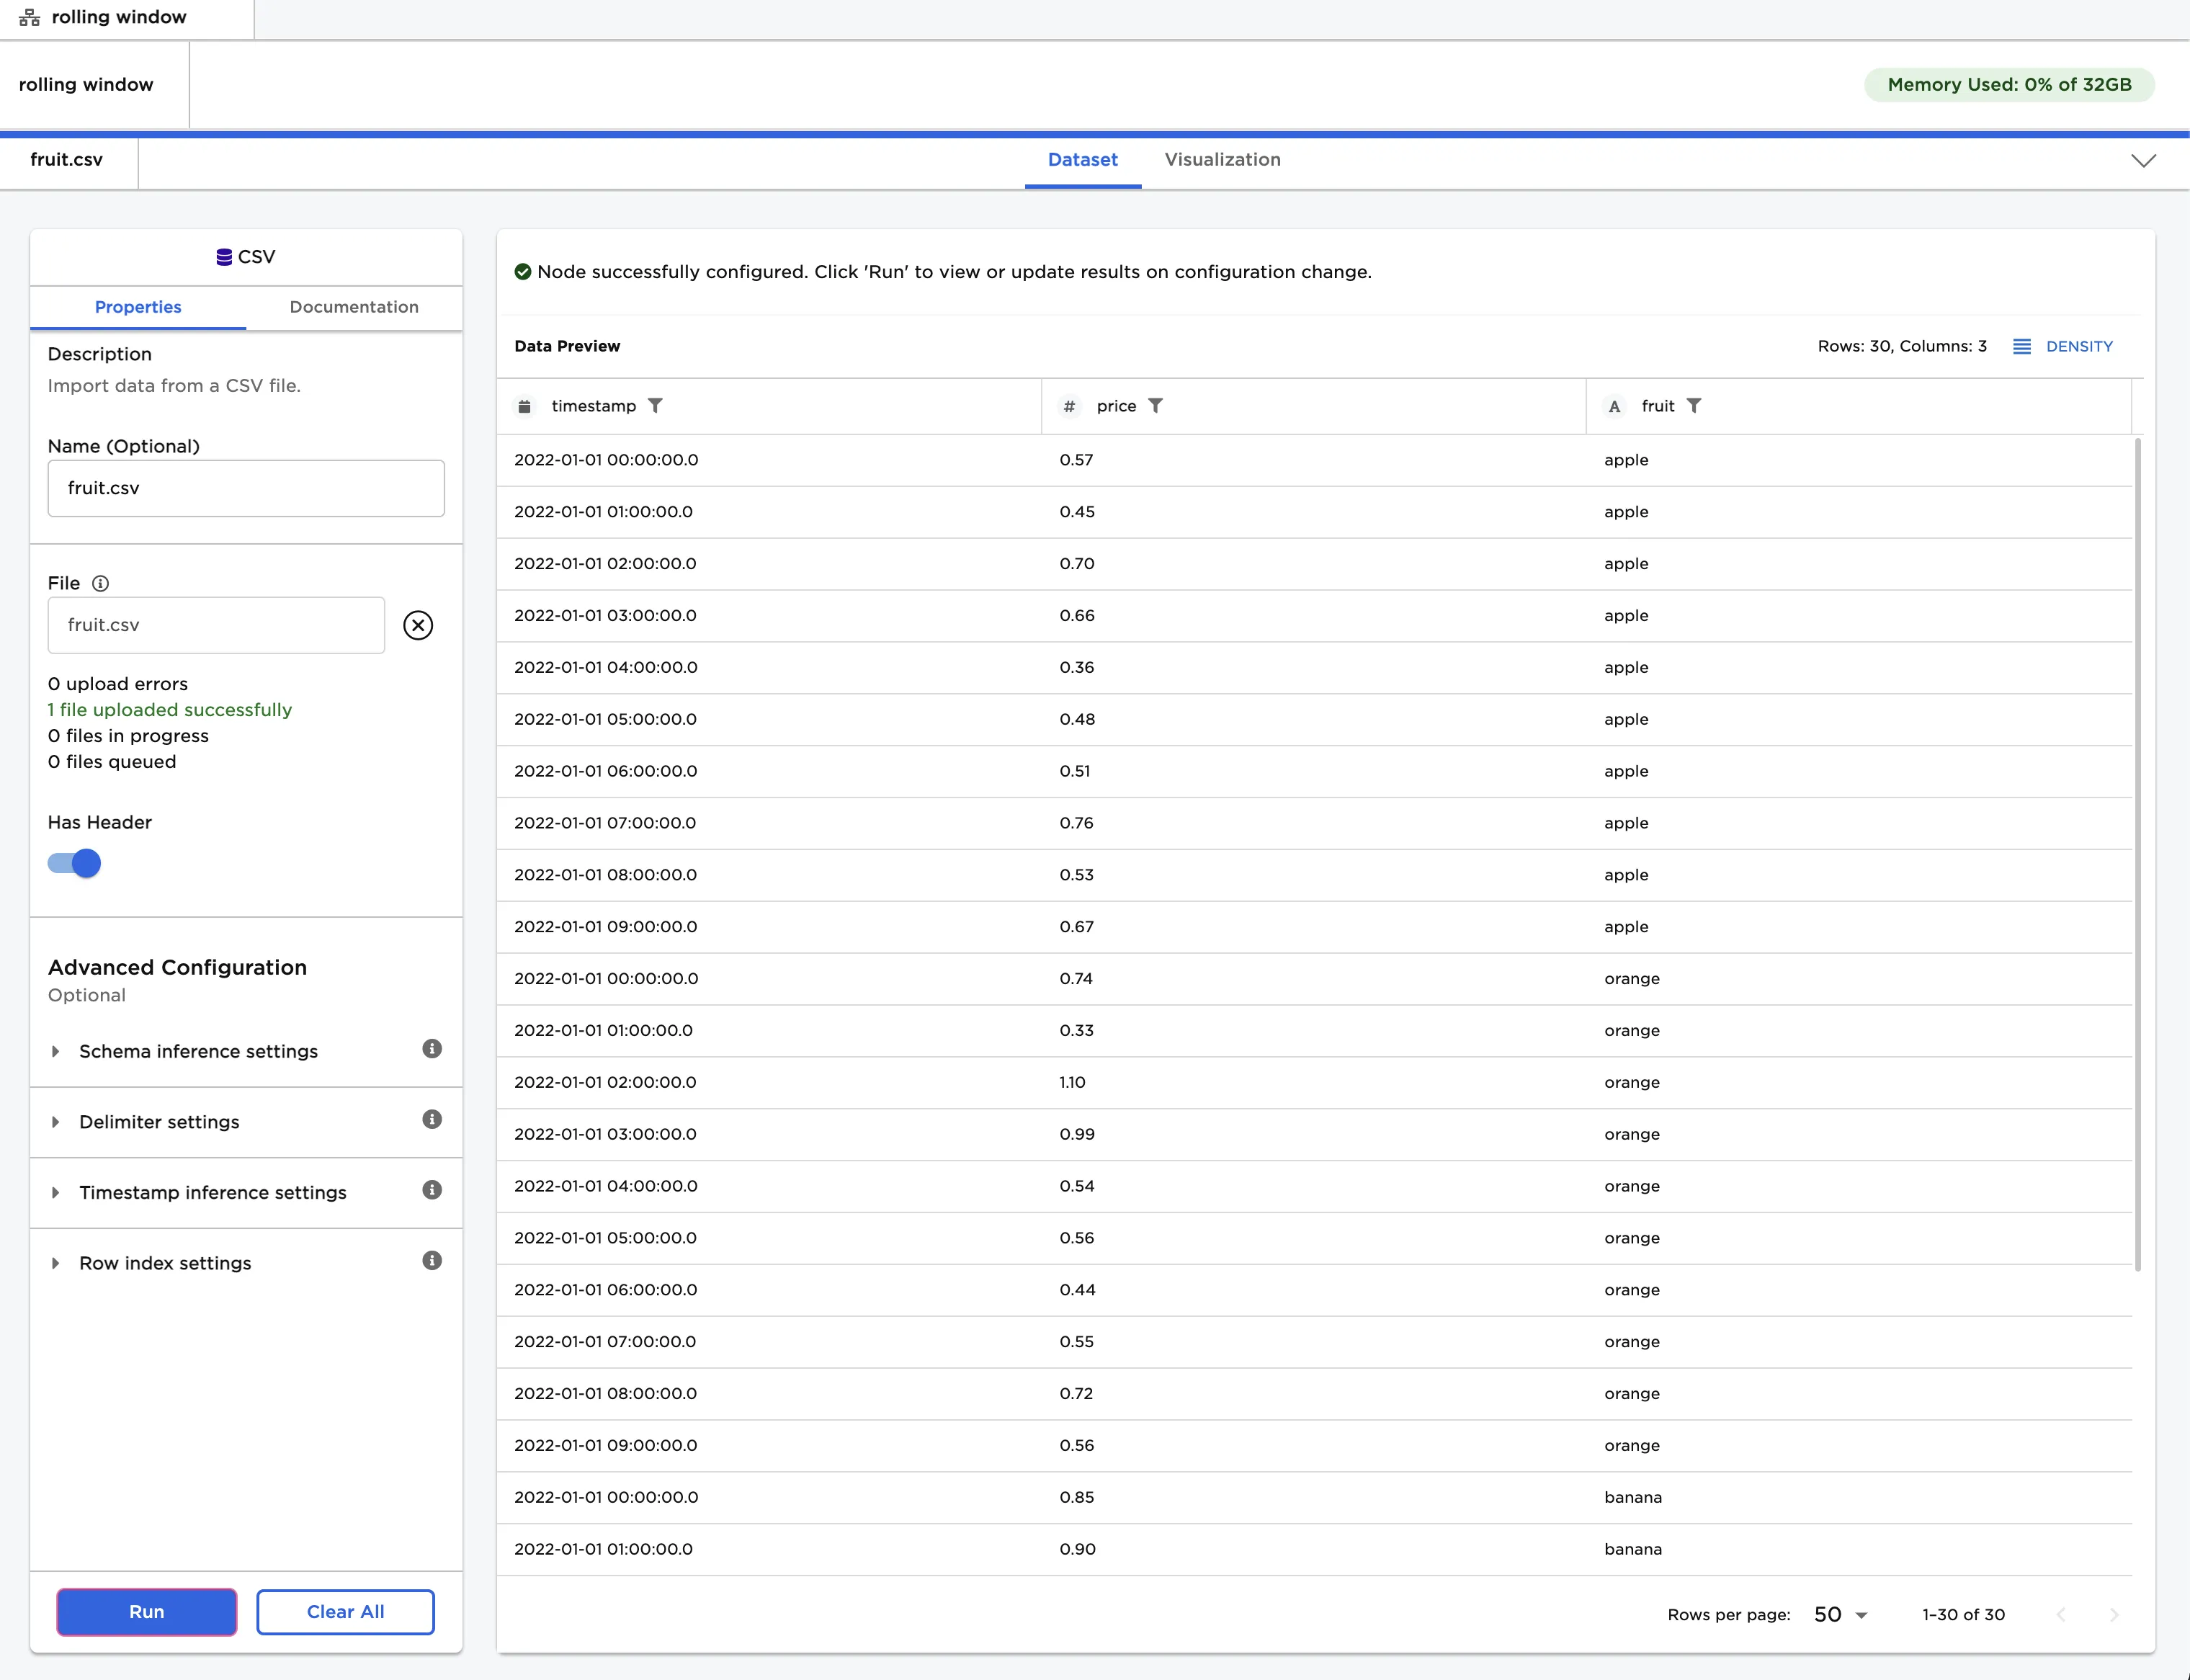
Figure 4: Example input data with multiple series
- Select "Group data by column", then select "fruit" for the "Select column to partition with" field.
- Select "Run" without modifying the fields used in the previous example.
- The first value for each fruit is blank in the generated column. Each fruit is evaluated as a separate group.
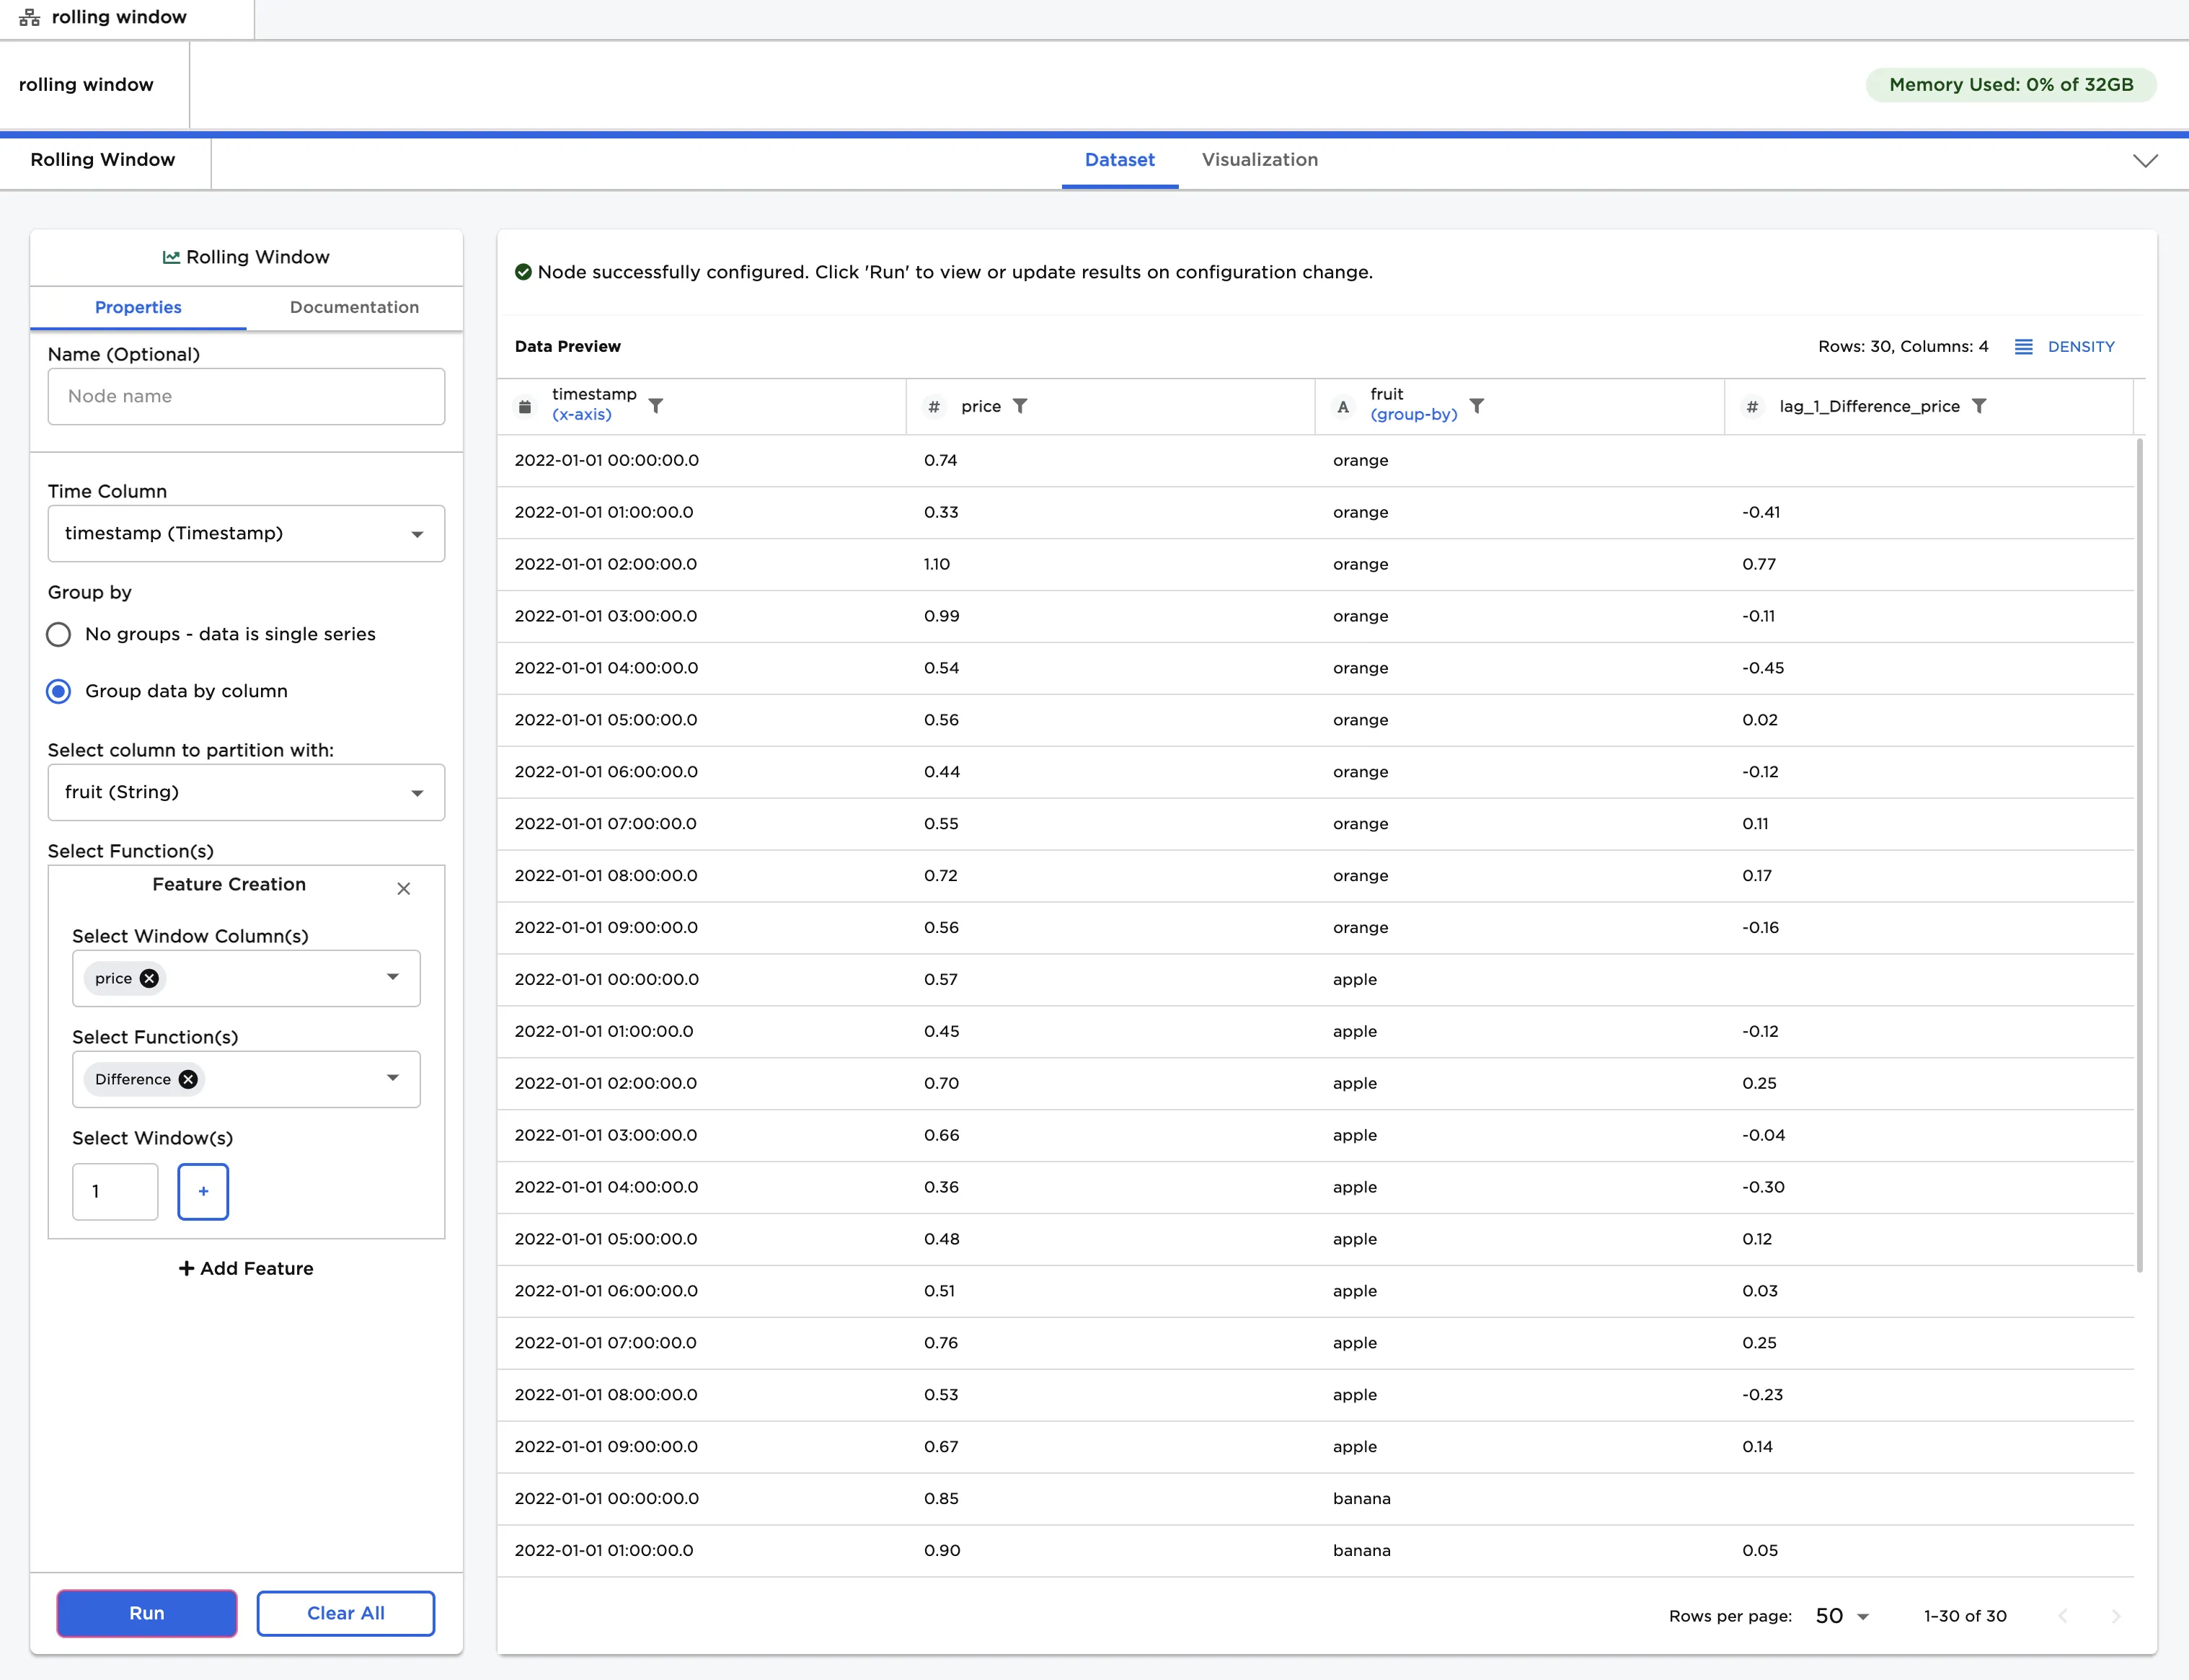
Figure 5: Example dataframe output with a function performed on multiple series
- Add additional functions and windows, then select "Run".
- Notice that a new column is created for each additional window and function.
- Entering a negative integer in the window field tells Visual Notebooks to use each row and the given number of rows below it in the calculation as opposed to the rows above it. This is indicated by the column prefix "lead".
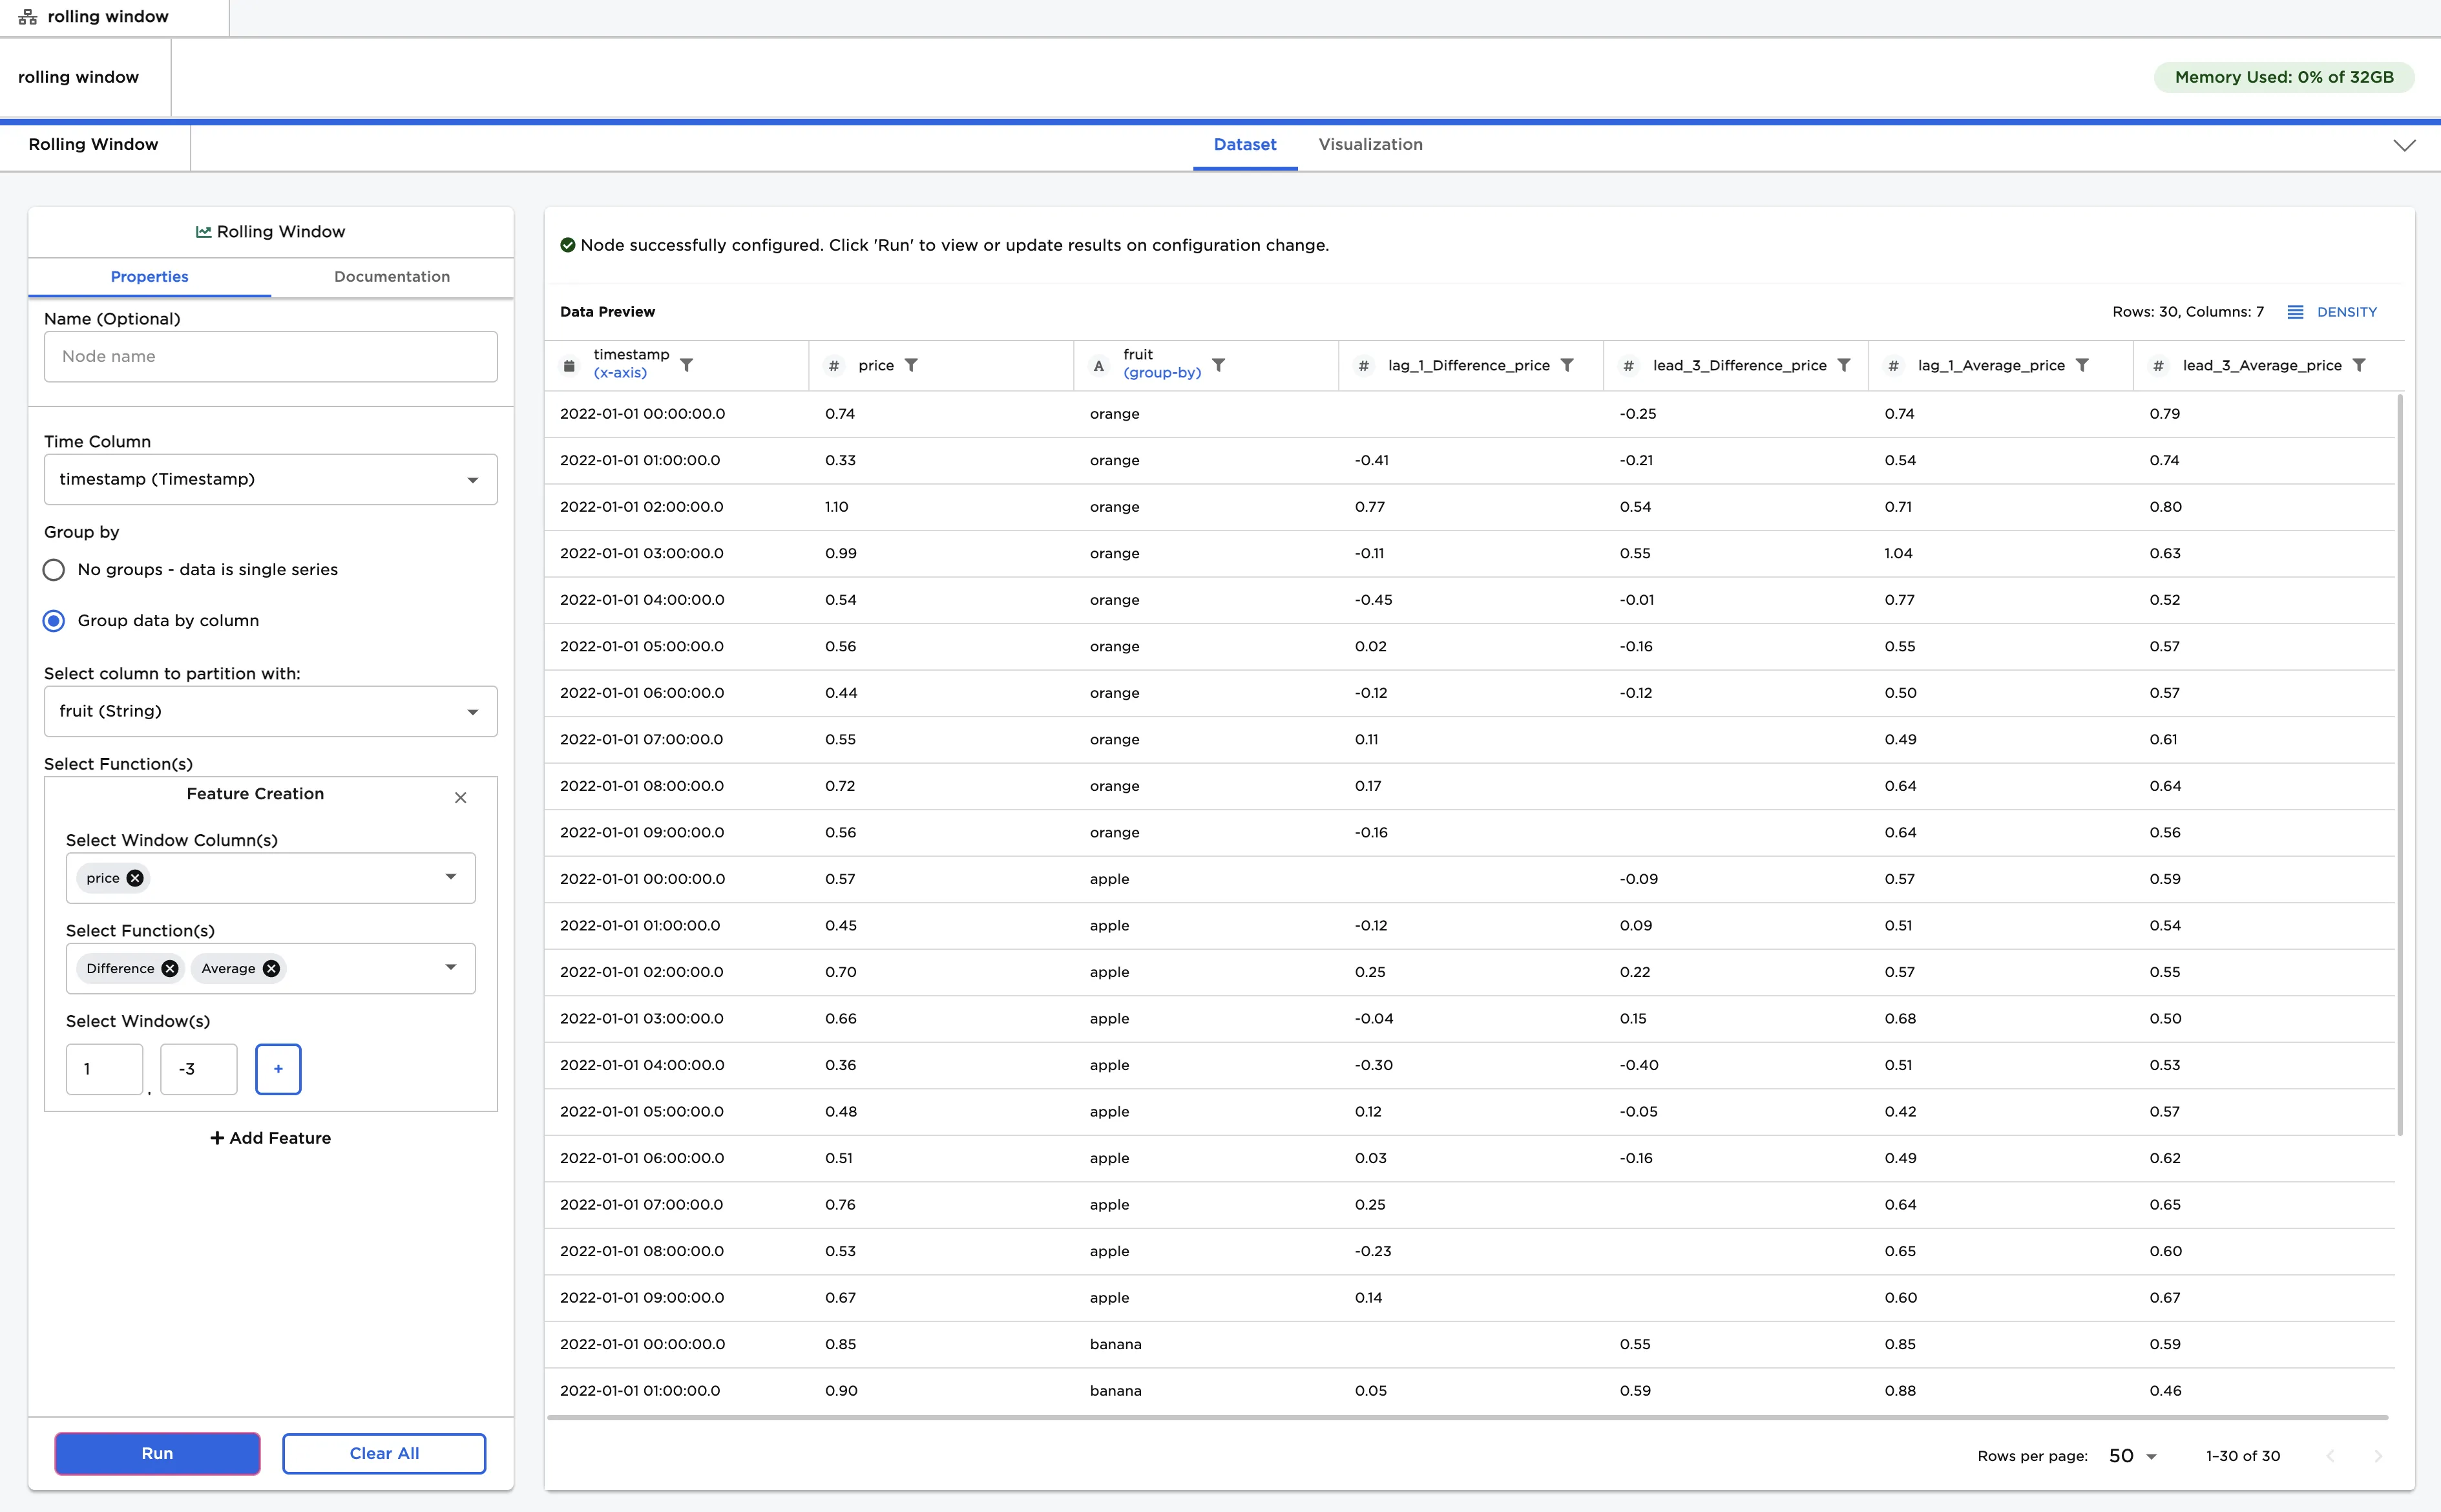
Figure 6: Example dataframe output with multiple functions and windows