Creating and Managing Stories in Visual Notebooks
Visual Notebooks stories are native, multi-page dashboards created from visualizations defined within Visual Notebooks projects. Stories can be shared with team members and viewed at any time without starting an Visual Notebooks workspace. Stories are automatically updated each time a project with an associated visualization is run.
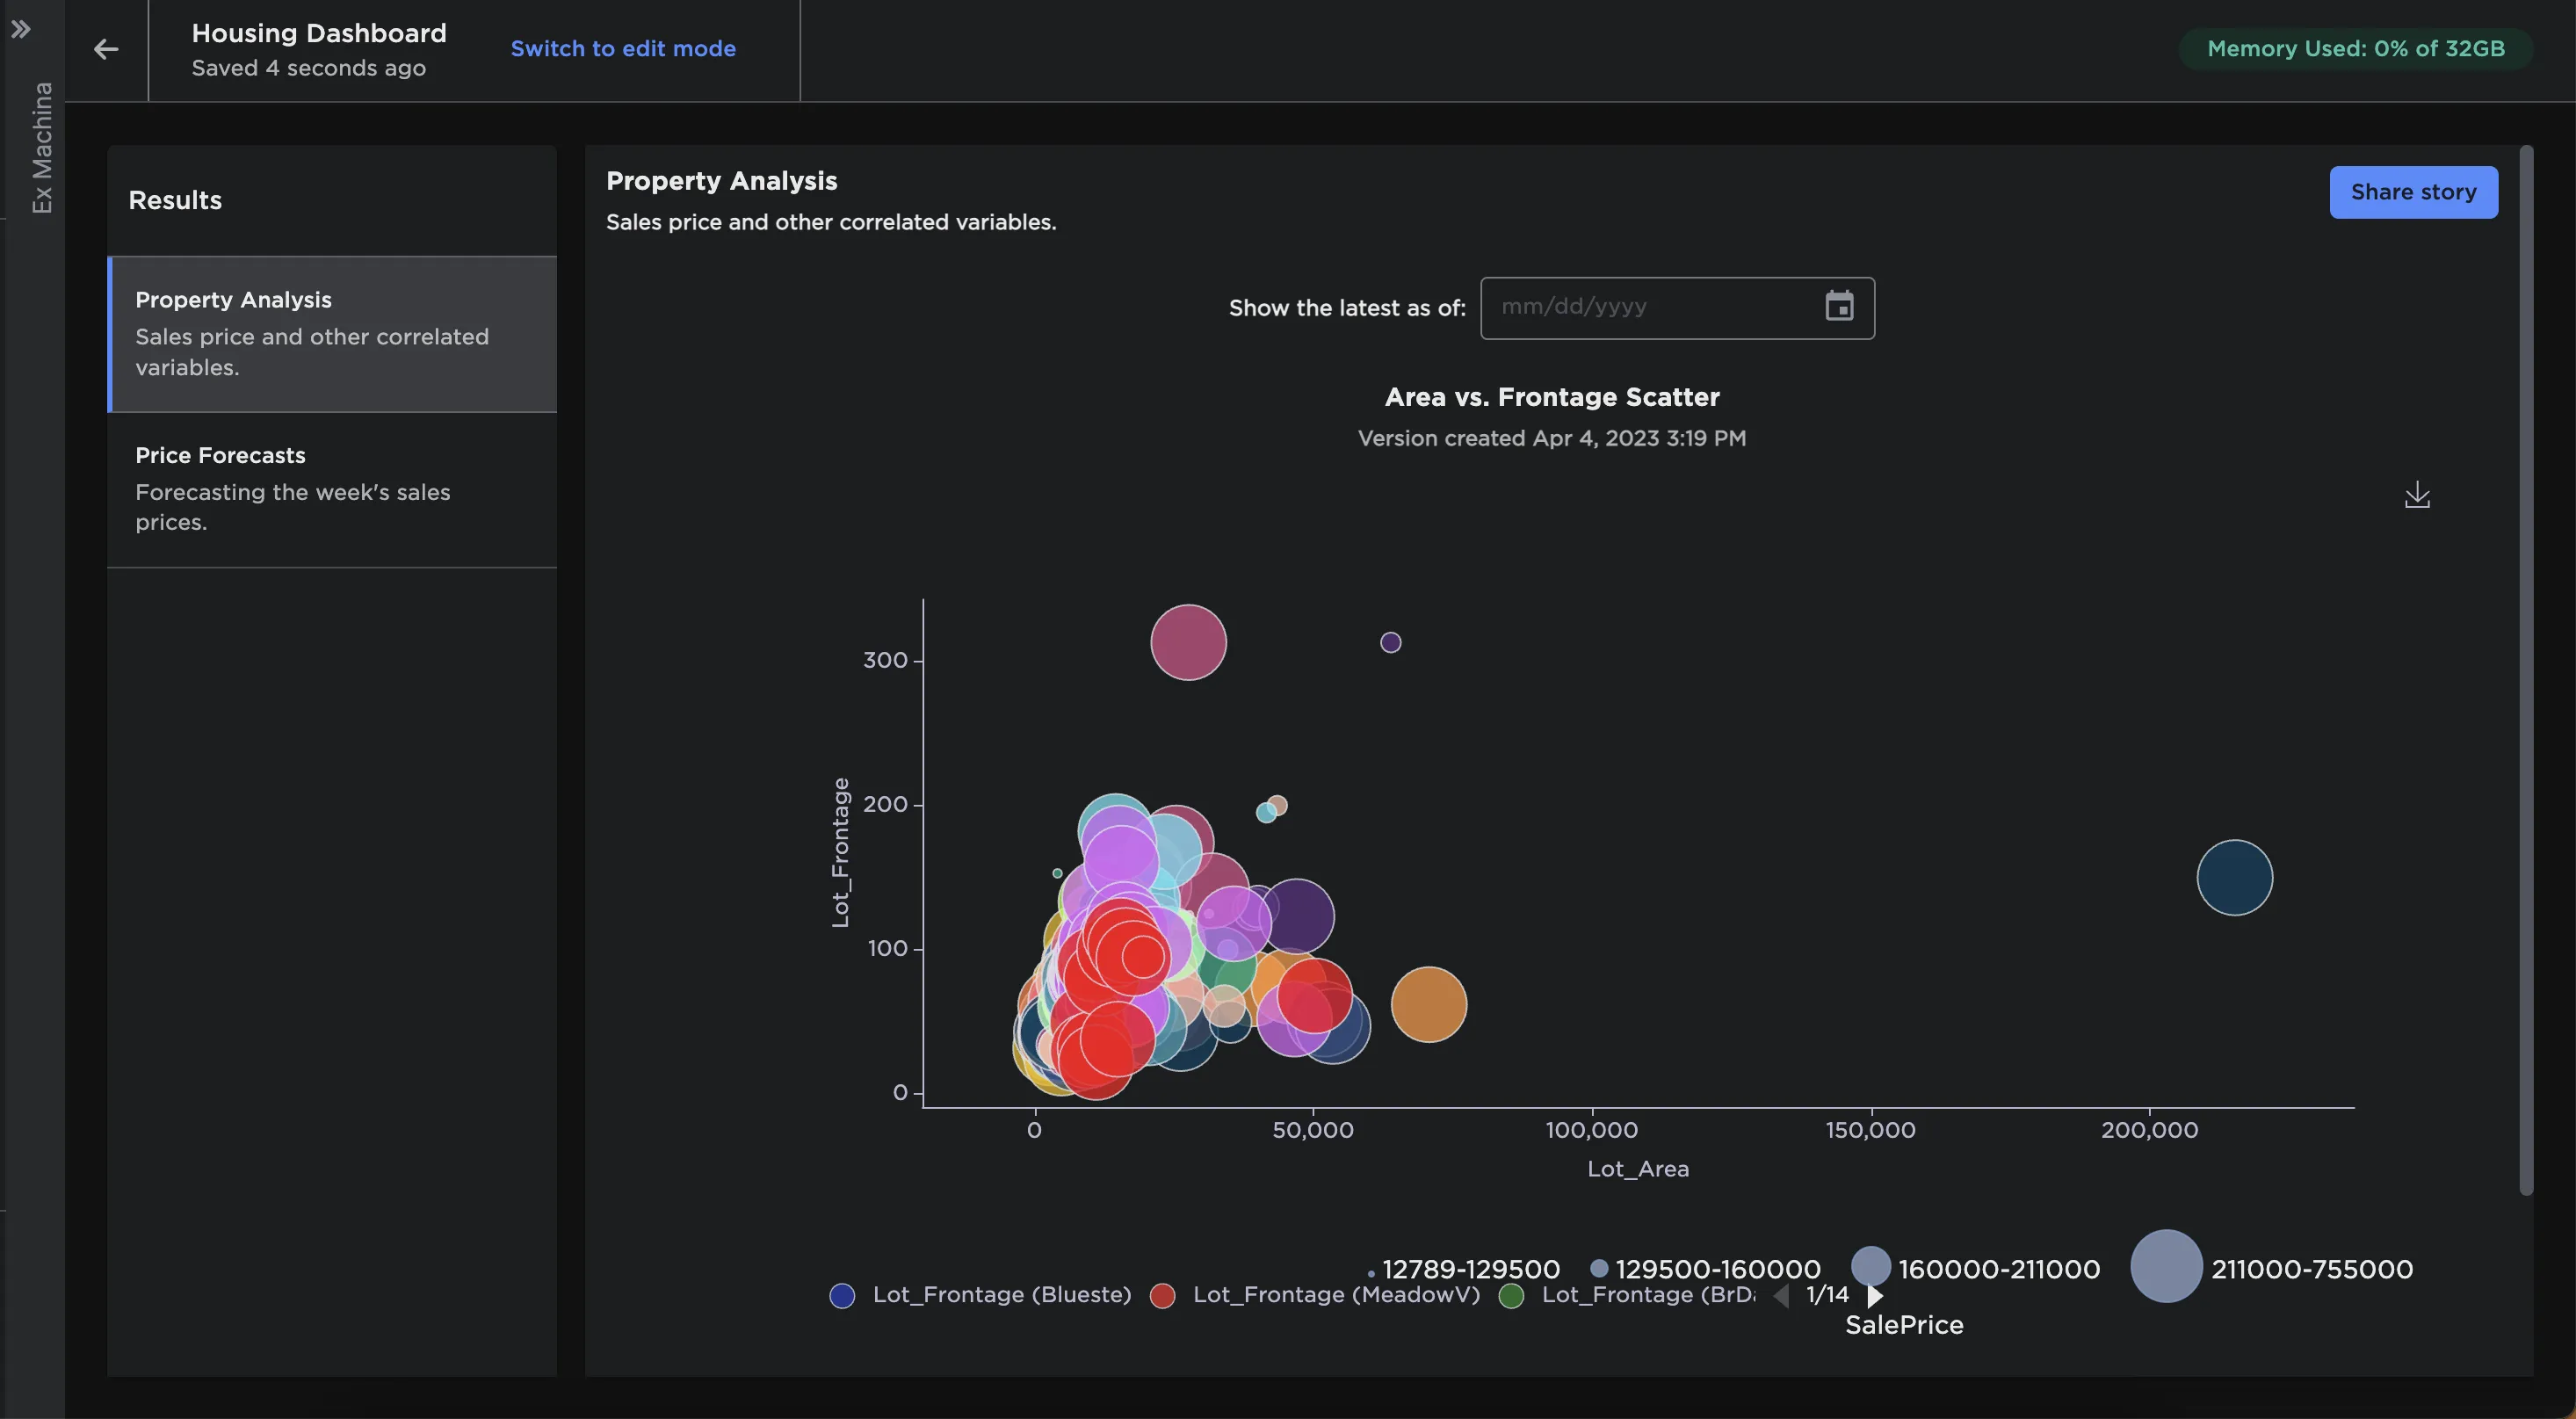
Figure 1: Visual Notebooks story
Collections
Before making a story, you must have visualizations in a collection. Collections can be thought of as folders or directories used to organize visualizations. A collection may represent a topic or use case.
Visualizations are created within visual notebooks using the visualization tab or dedicated visualization nodes.
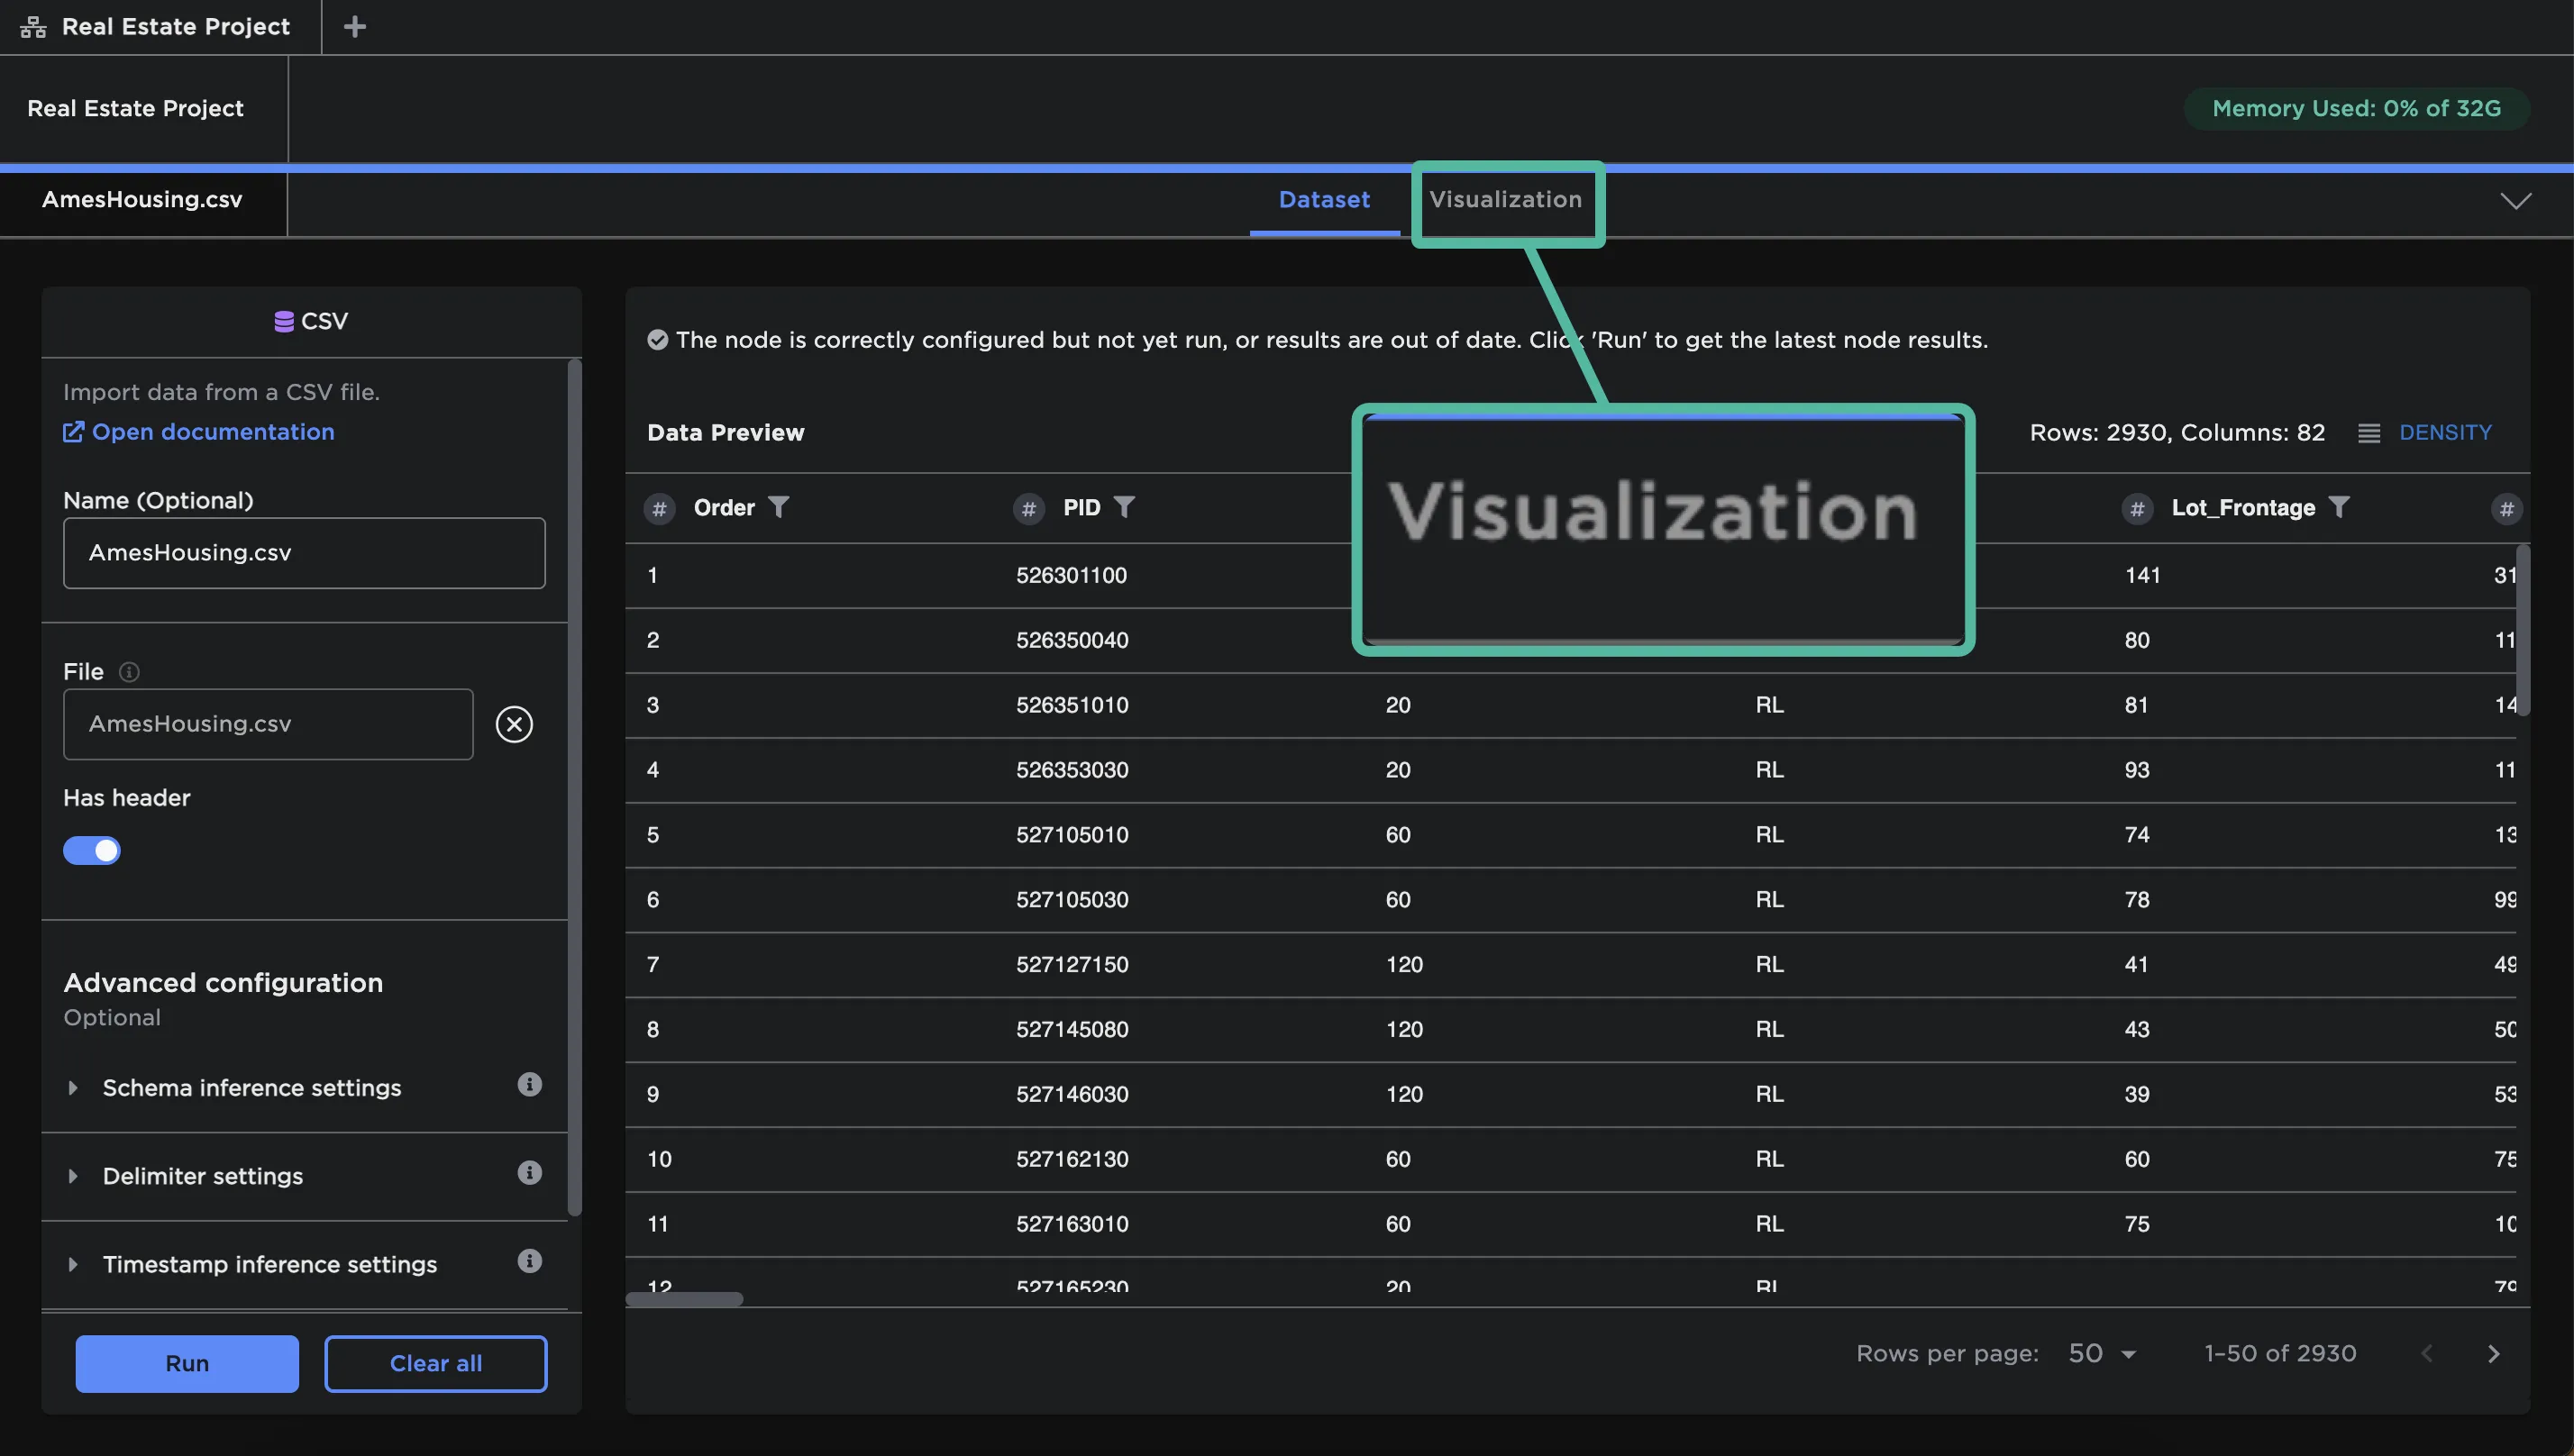
Figure 2: Visualization tab within a node
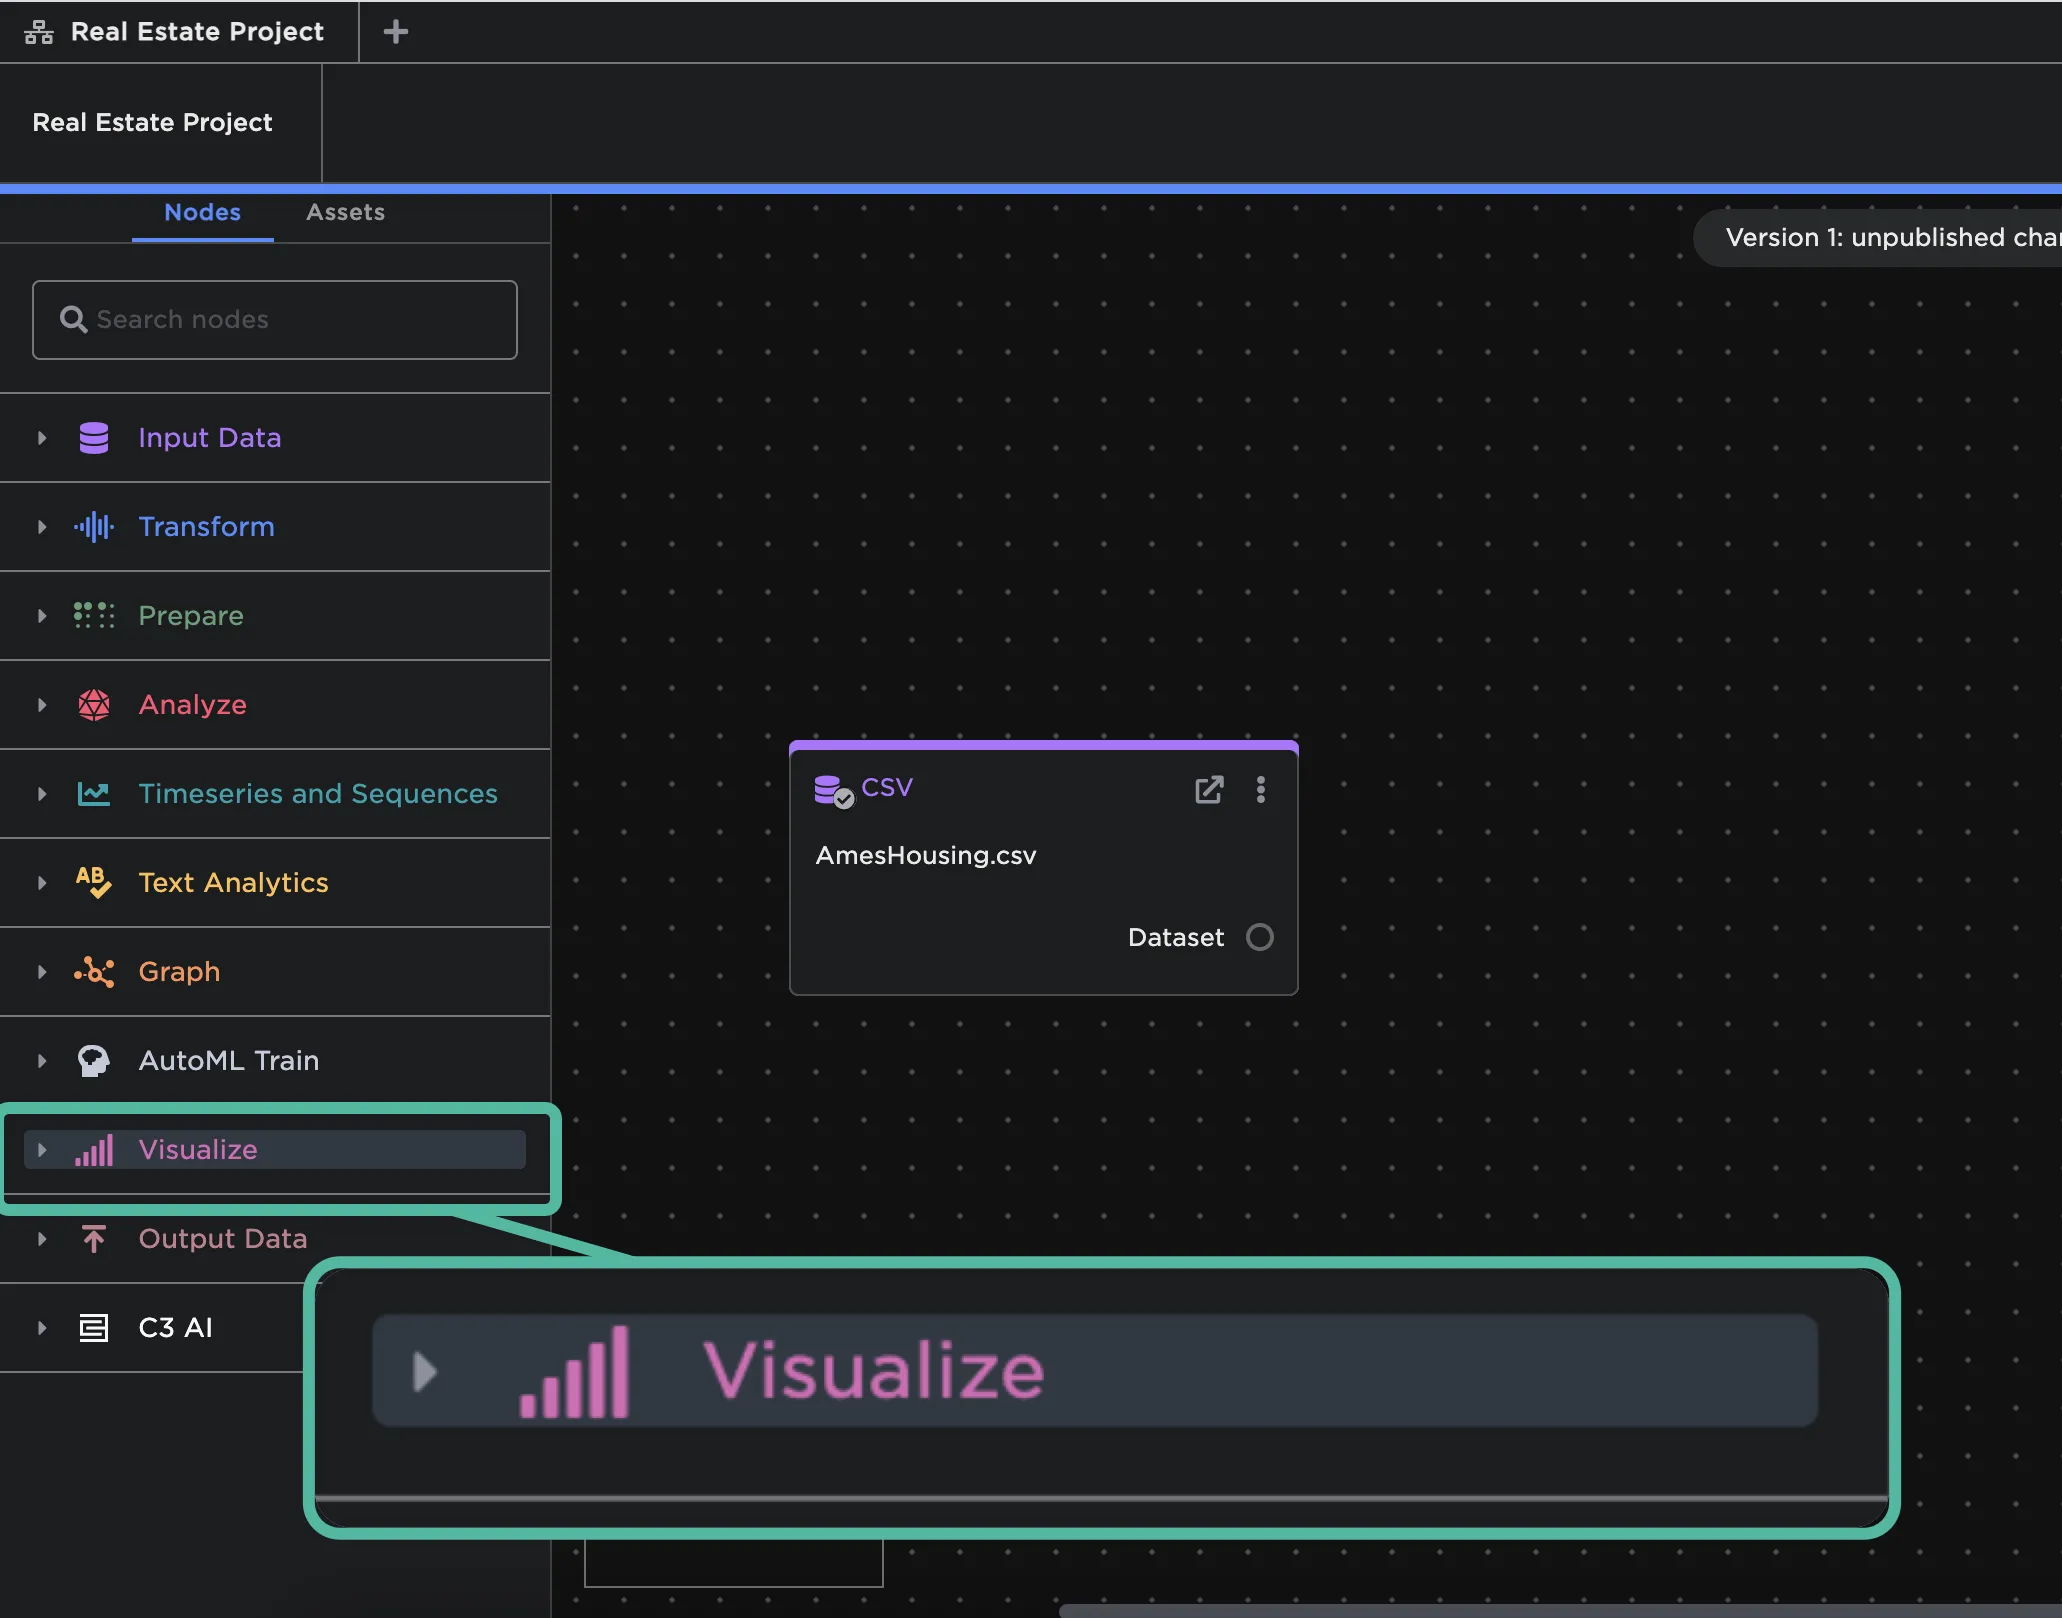
Figure 3: Dedicated visualization nodes
For more information on configuring visualizations, please see the visualization chapter of the capabilities document.
Once a visualization is configured, select the Add to Collection button in the top right corner.
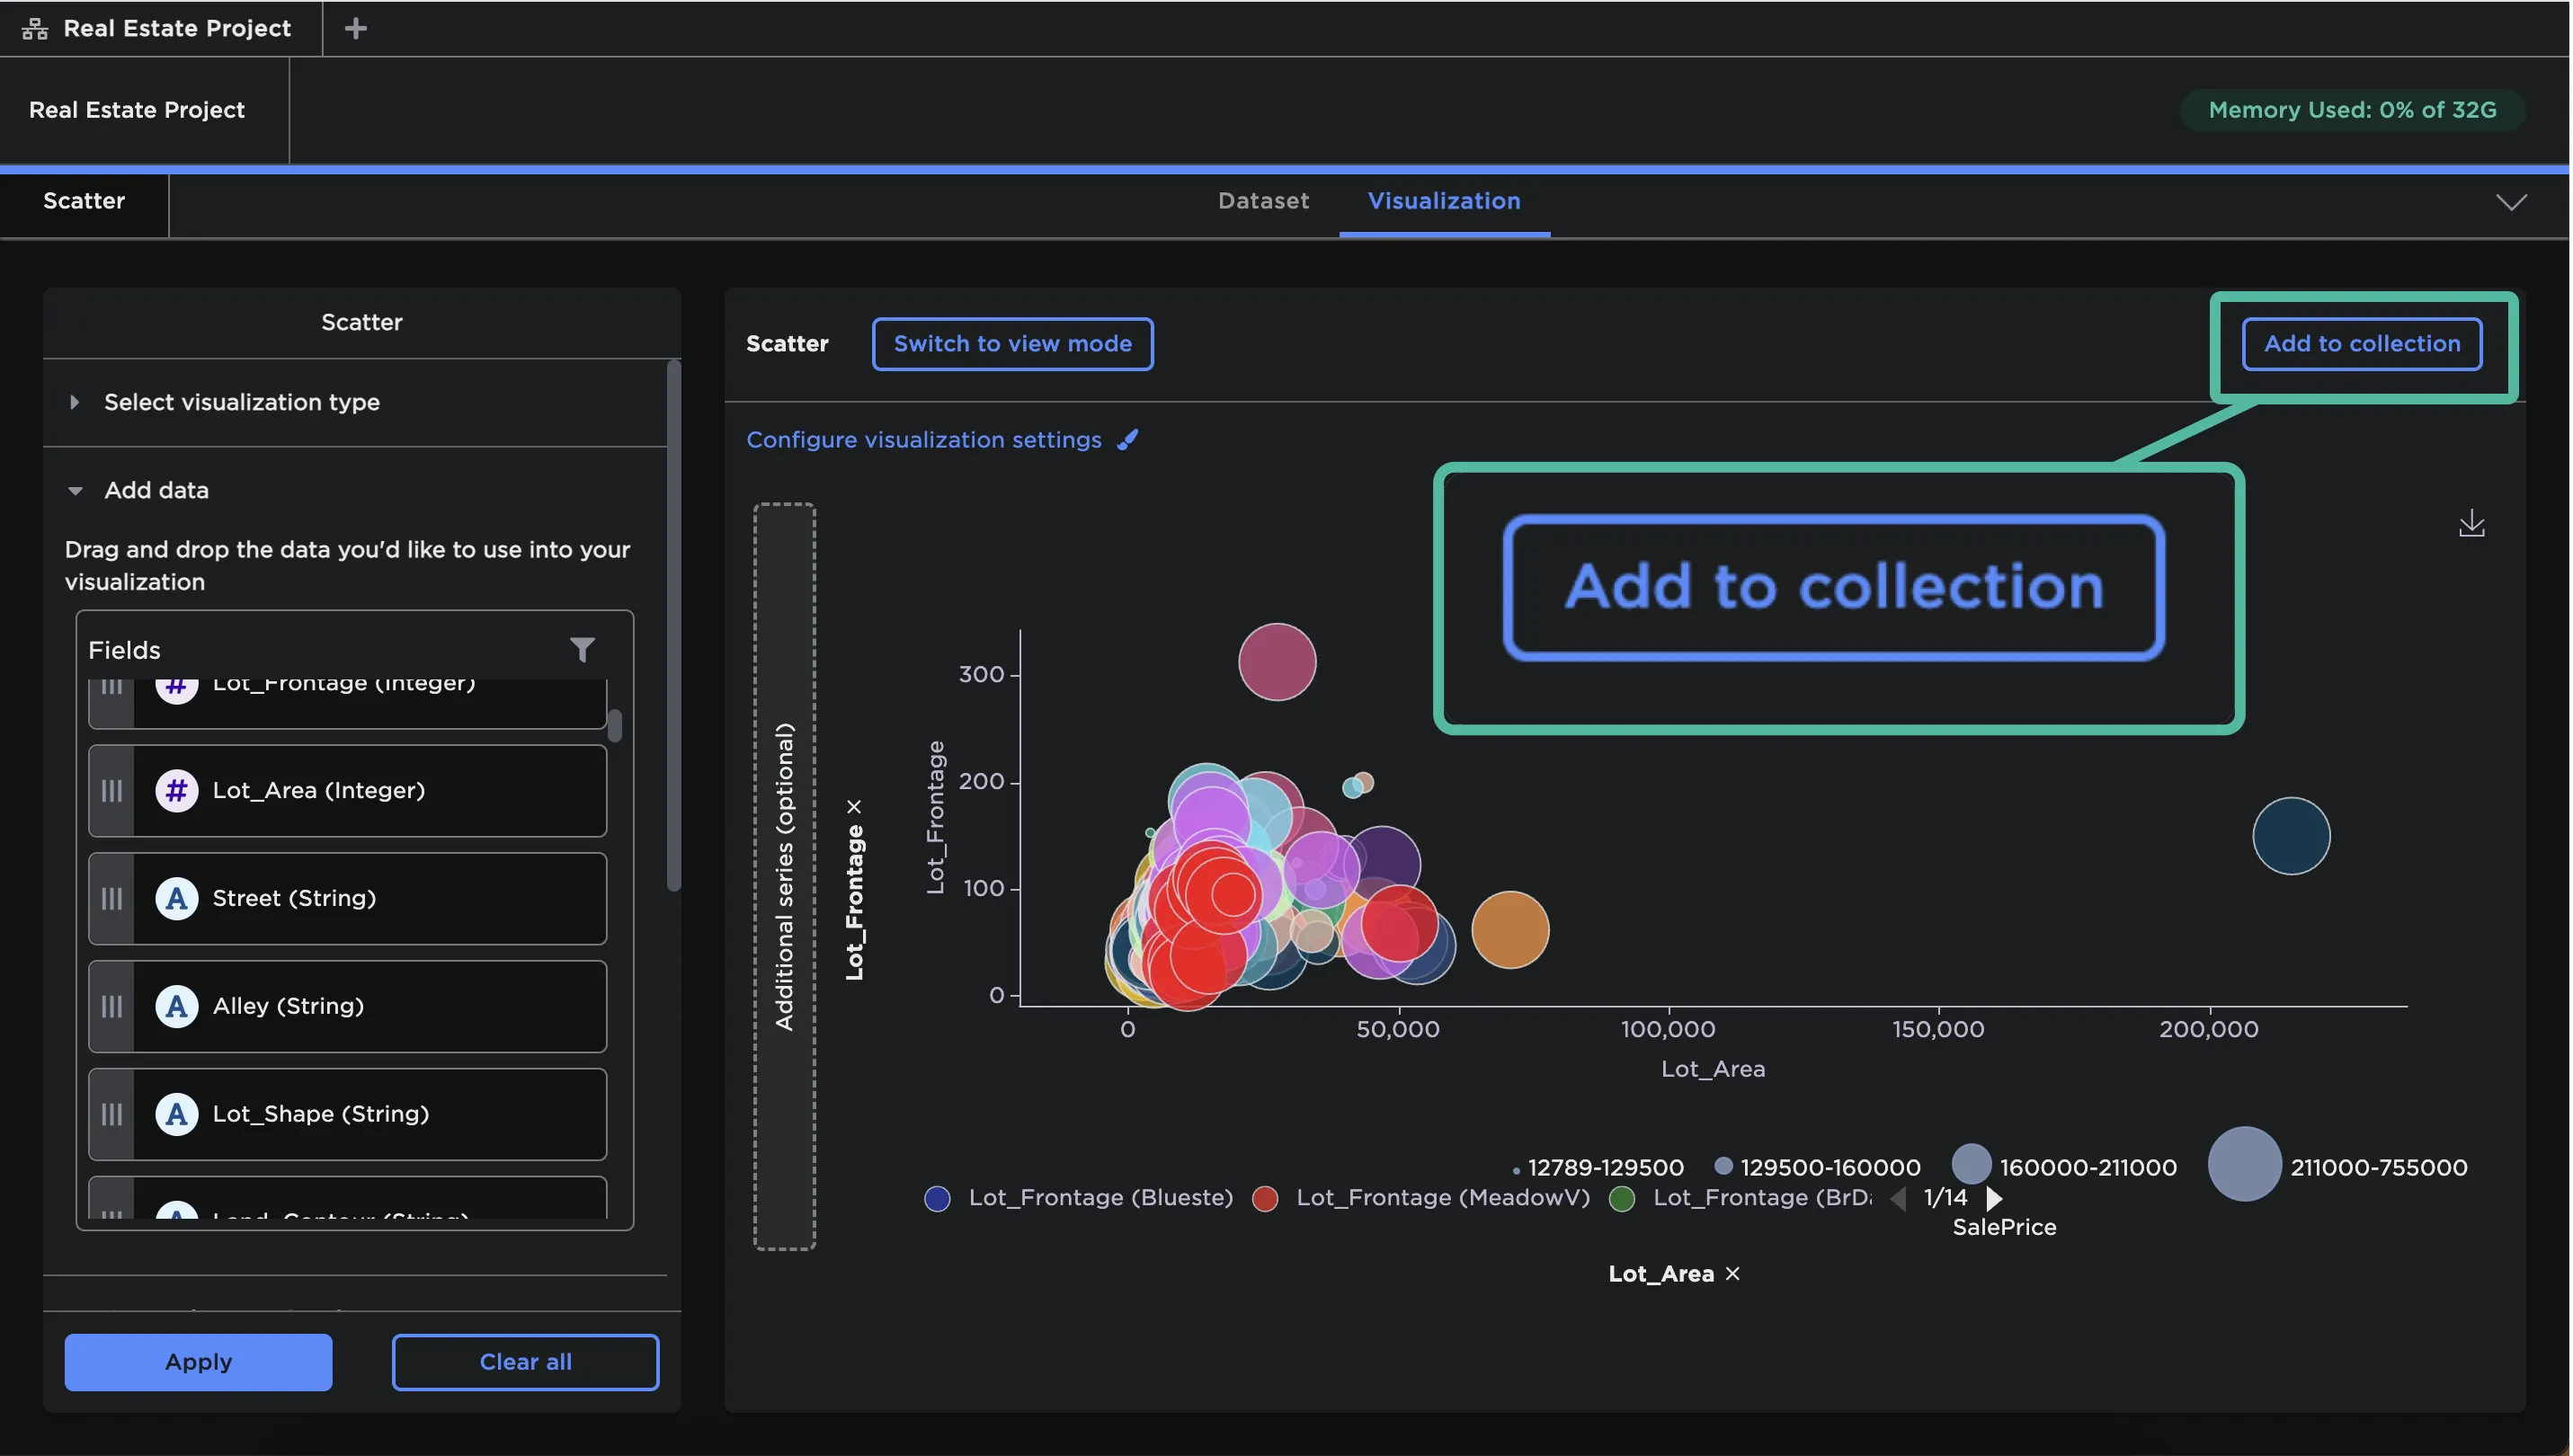
Figure 4: Add a visualization to a collection
When the modal opens, provide a name for the visualization. Then, select an existing collection or create a new collection.
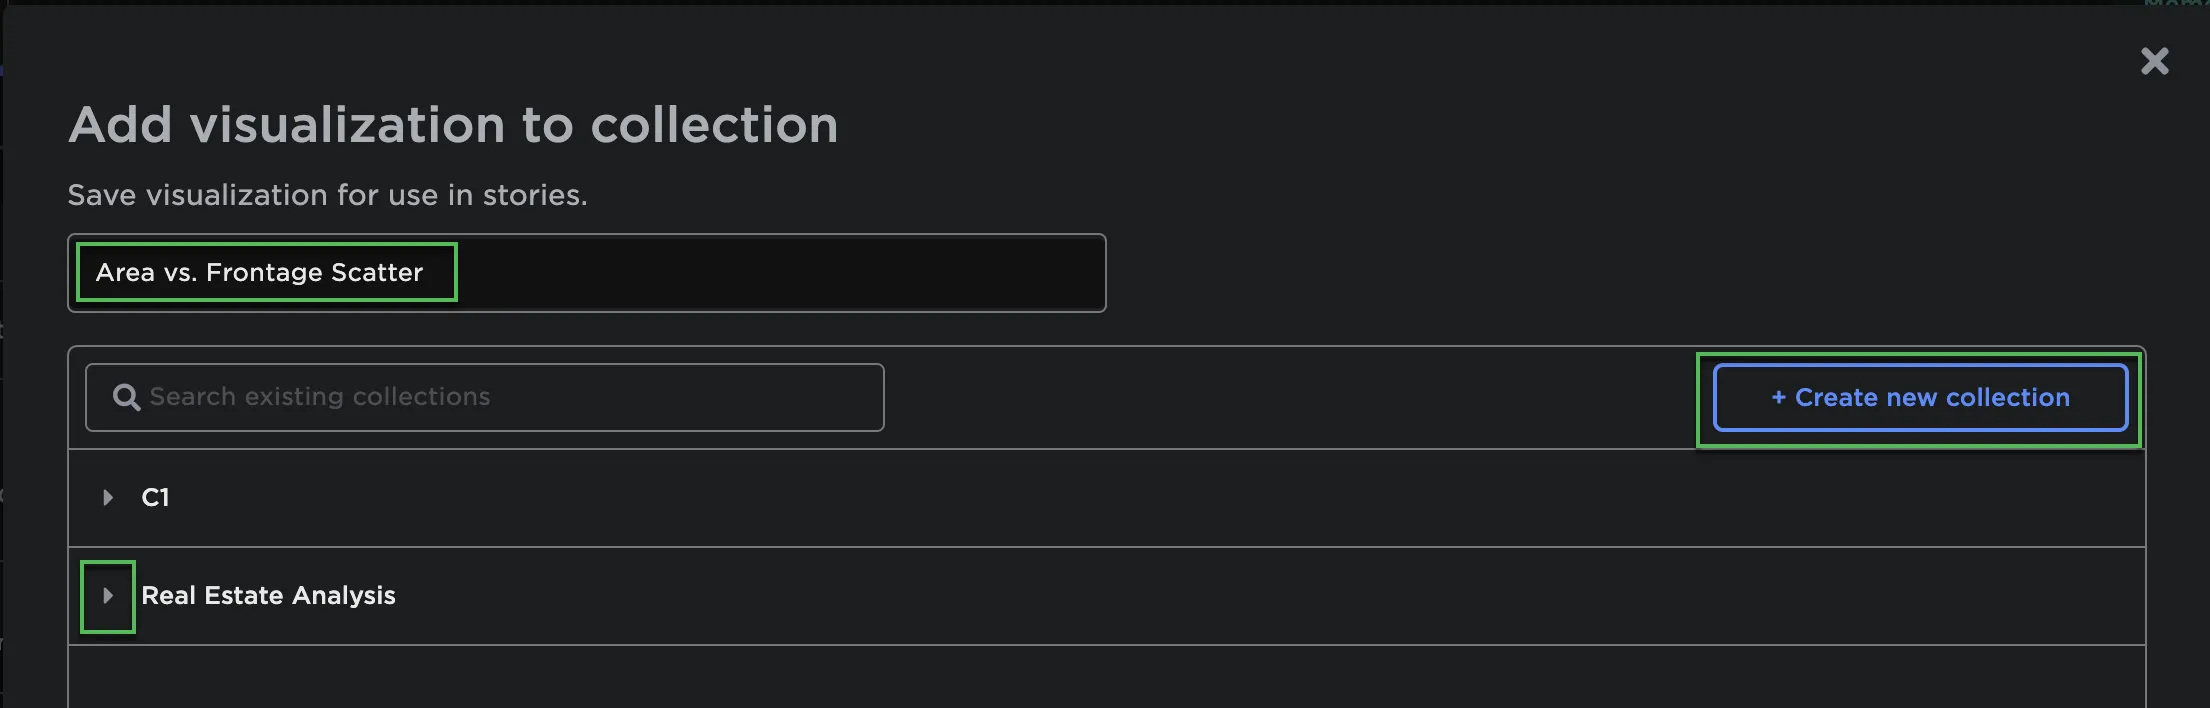
Figure 5: Add to collection modal
If you'd like your chart to automatically update when this visual notebook is run, make sure to toggle on Auto-publish new version.
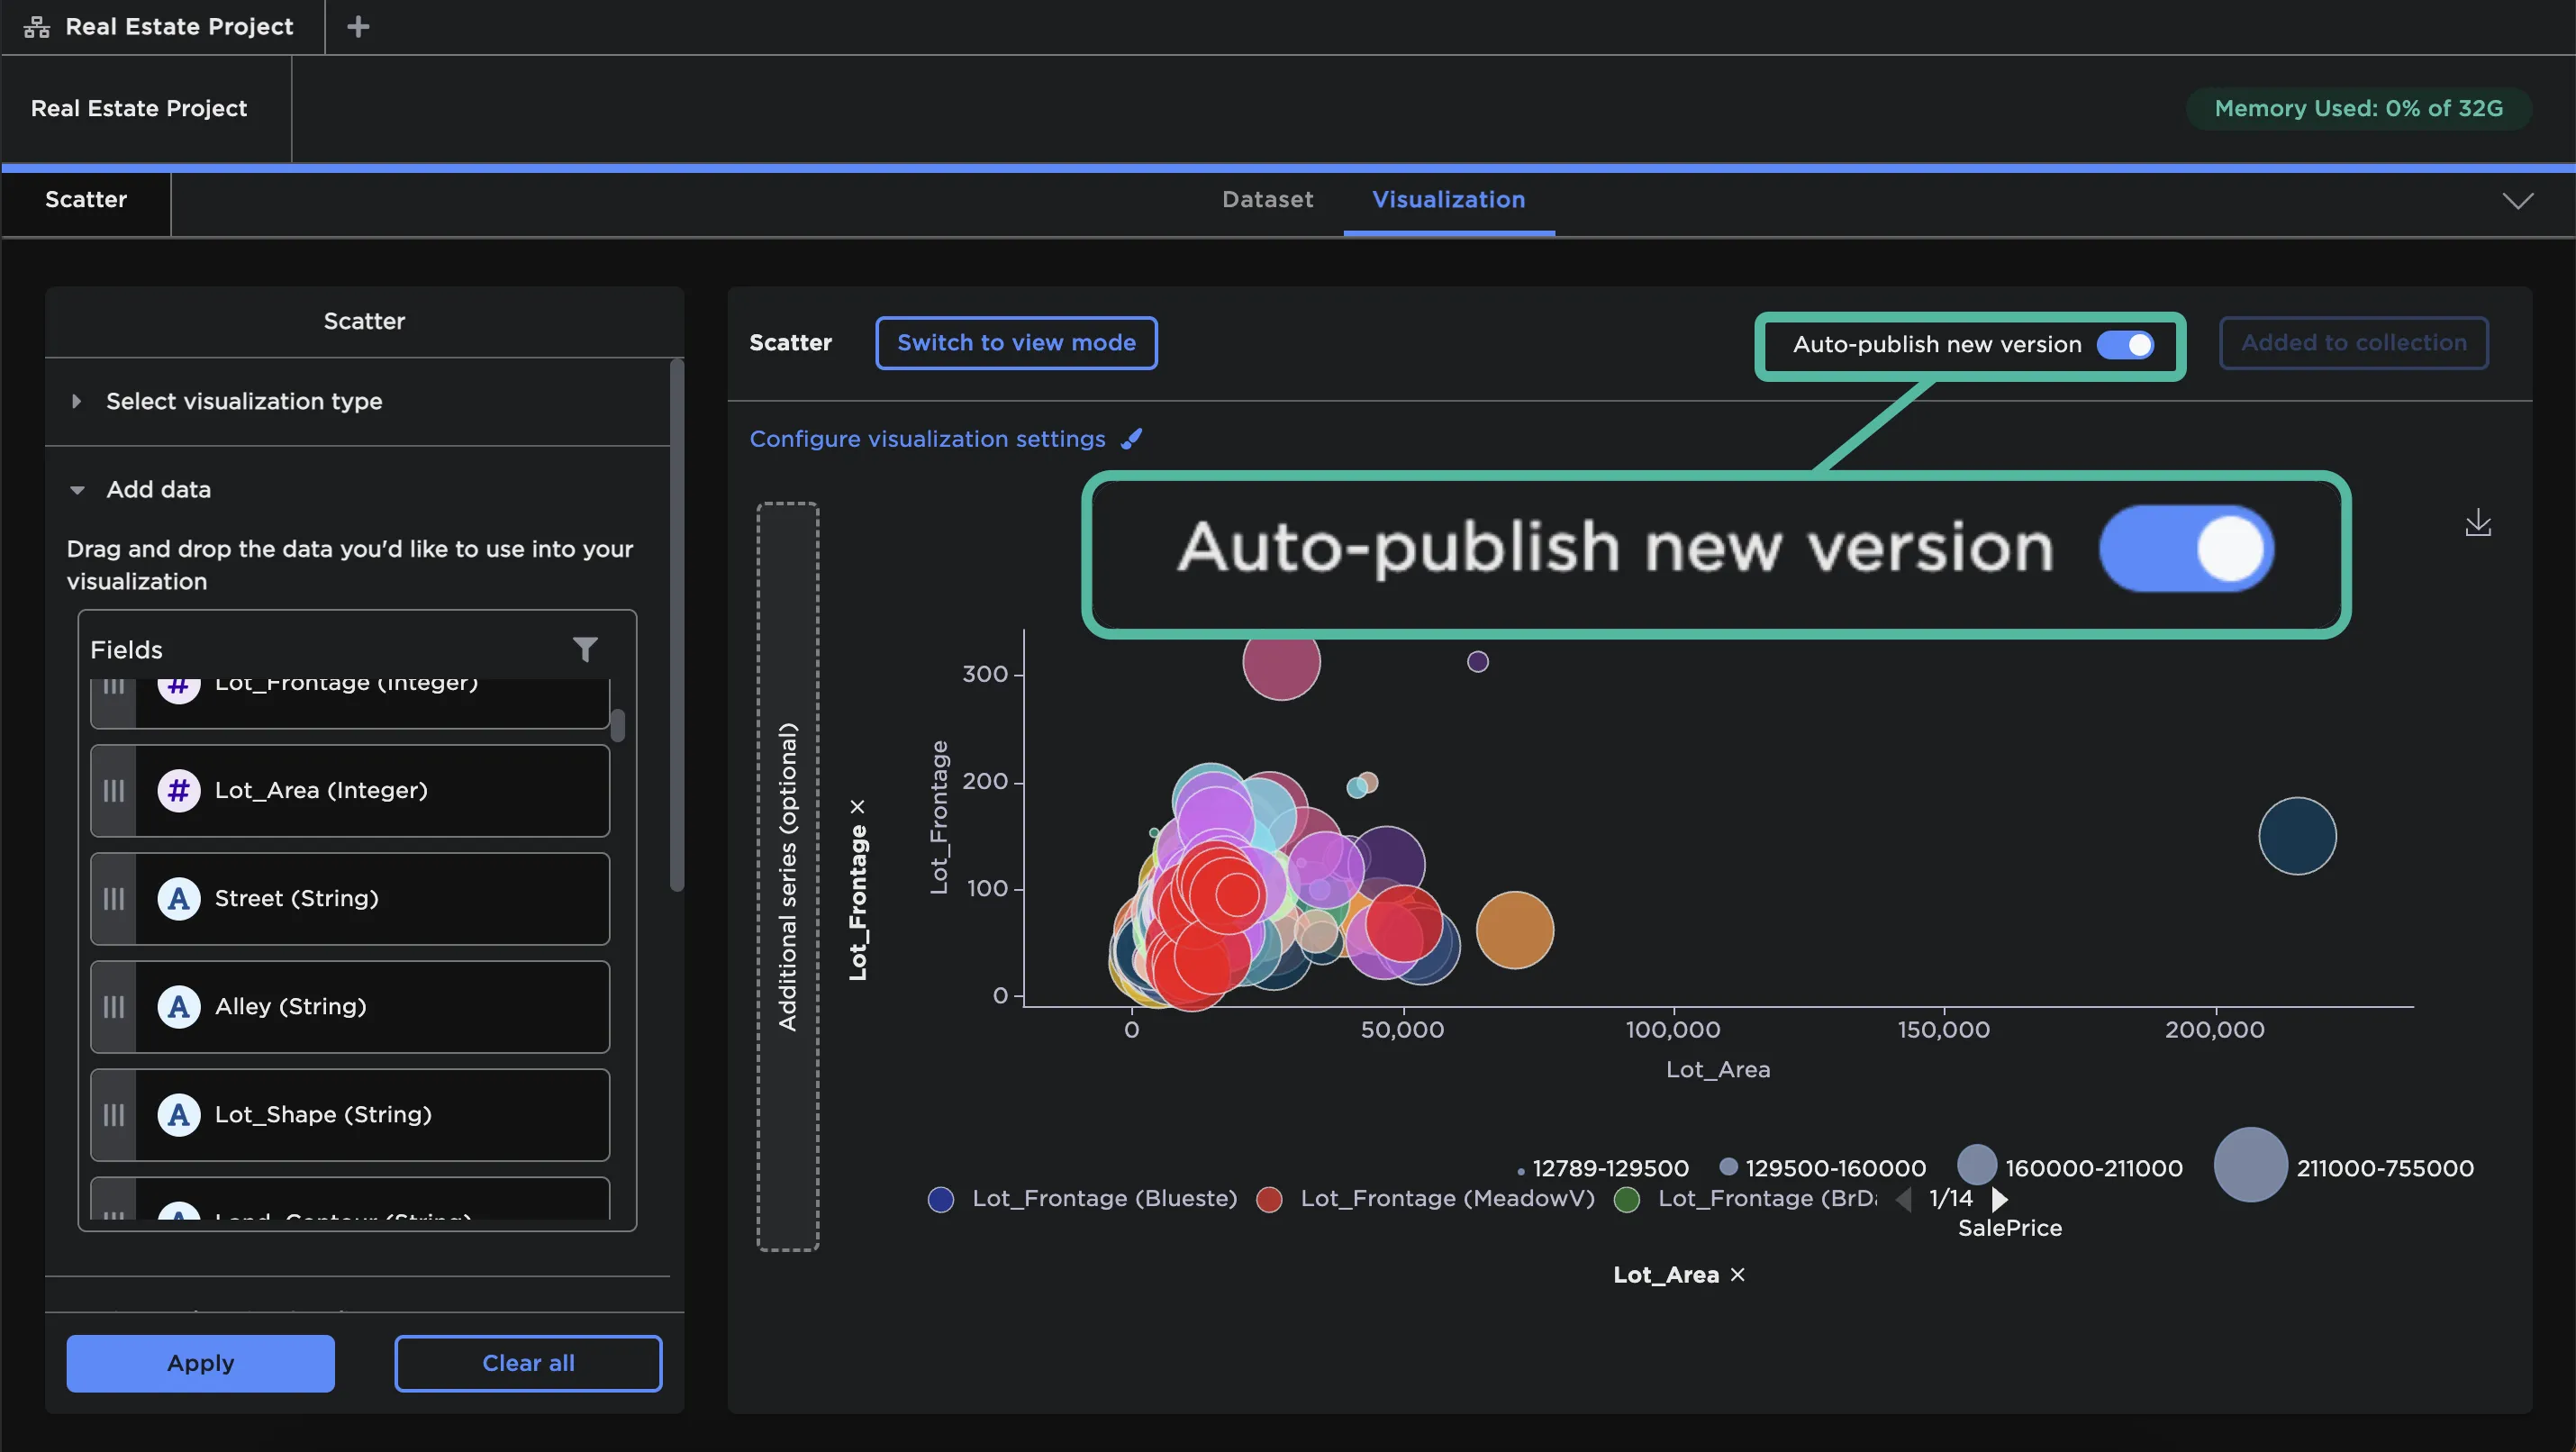
Figure 6: Automatically publish new versions
Accessing stories
At the top of the homepage, you can see how many stories you have access to.
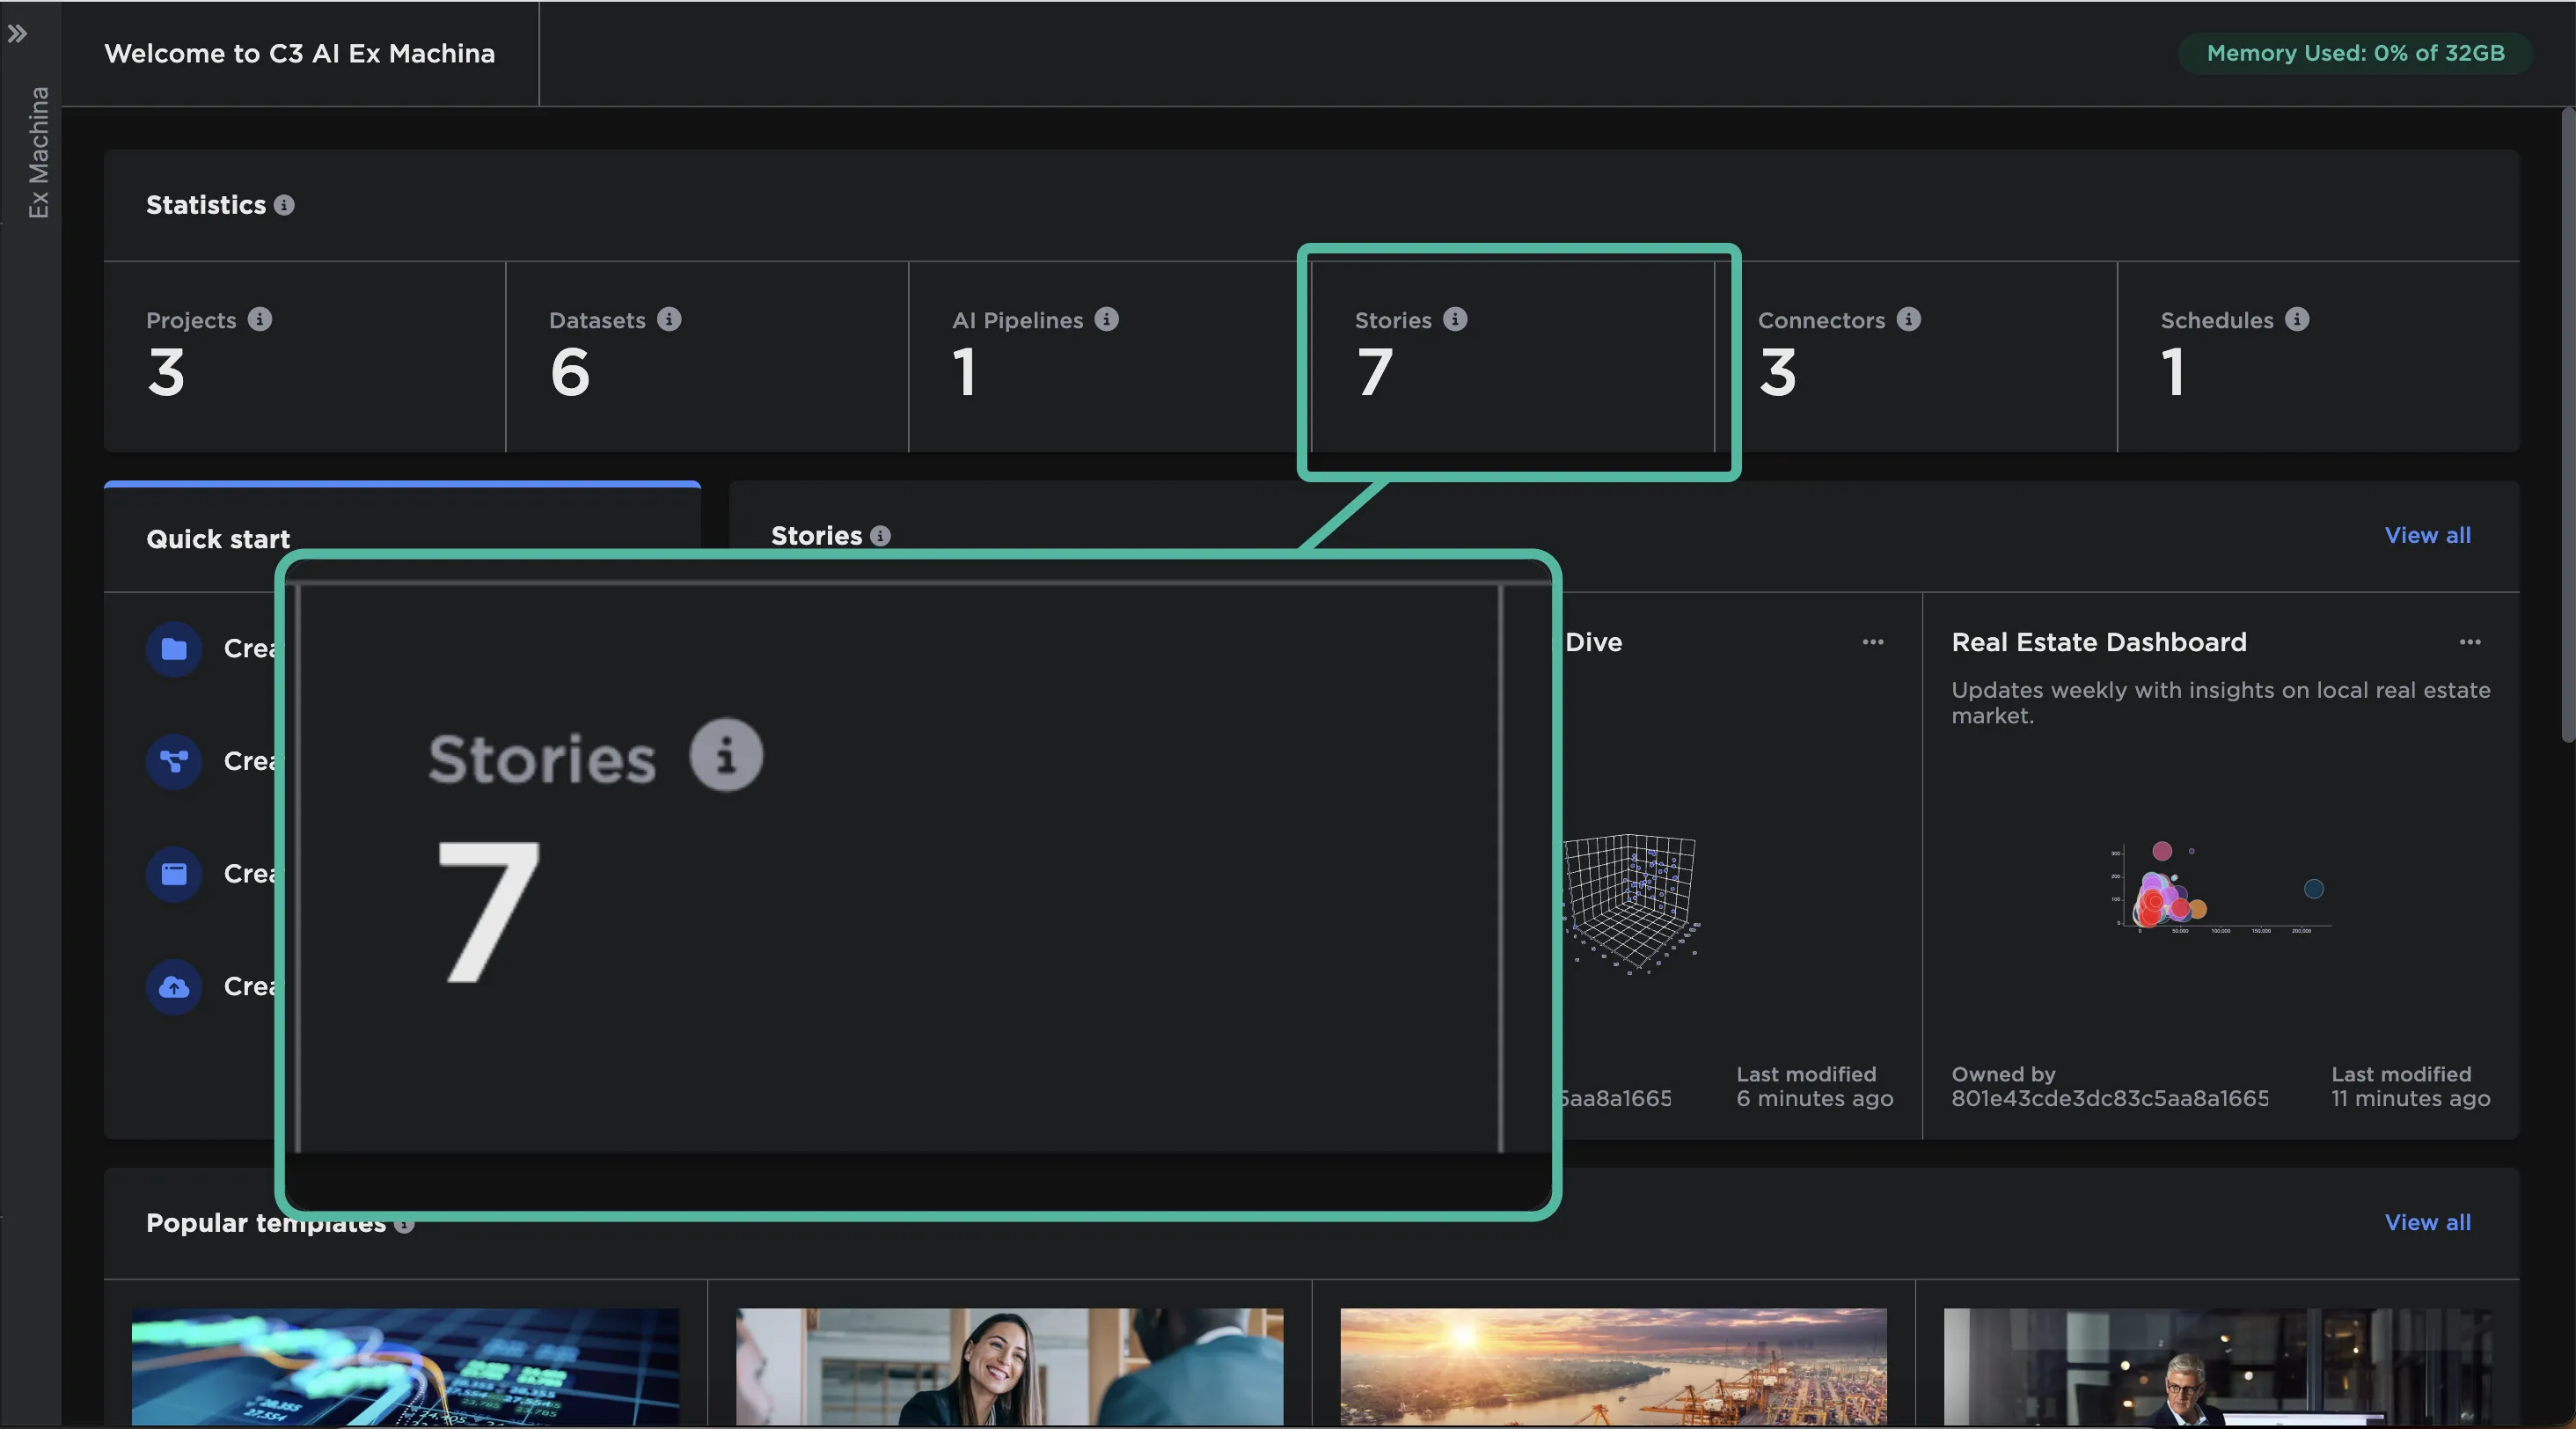
Figure 7: Stories statistic
Stories you've recently created appear on the homepage. Select the title of a story to view it. Select the three dots next to a recent story to rename, duplicate, delete, or share that story.
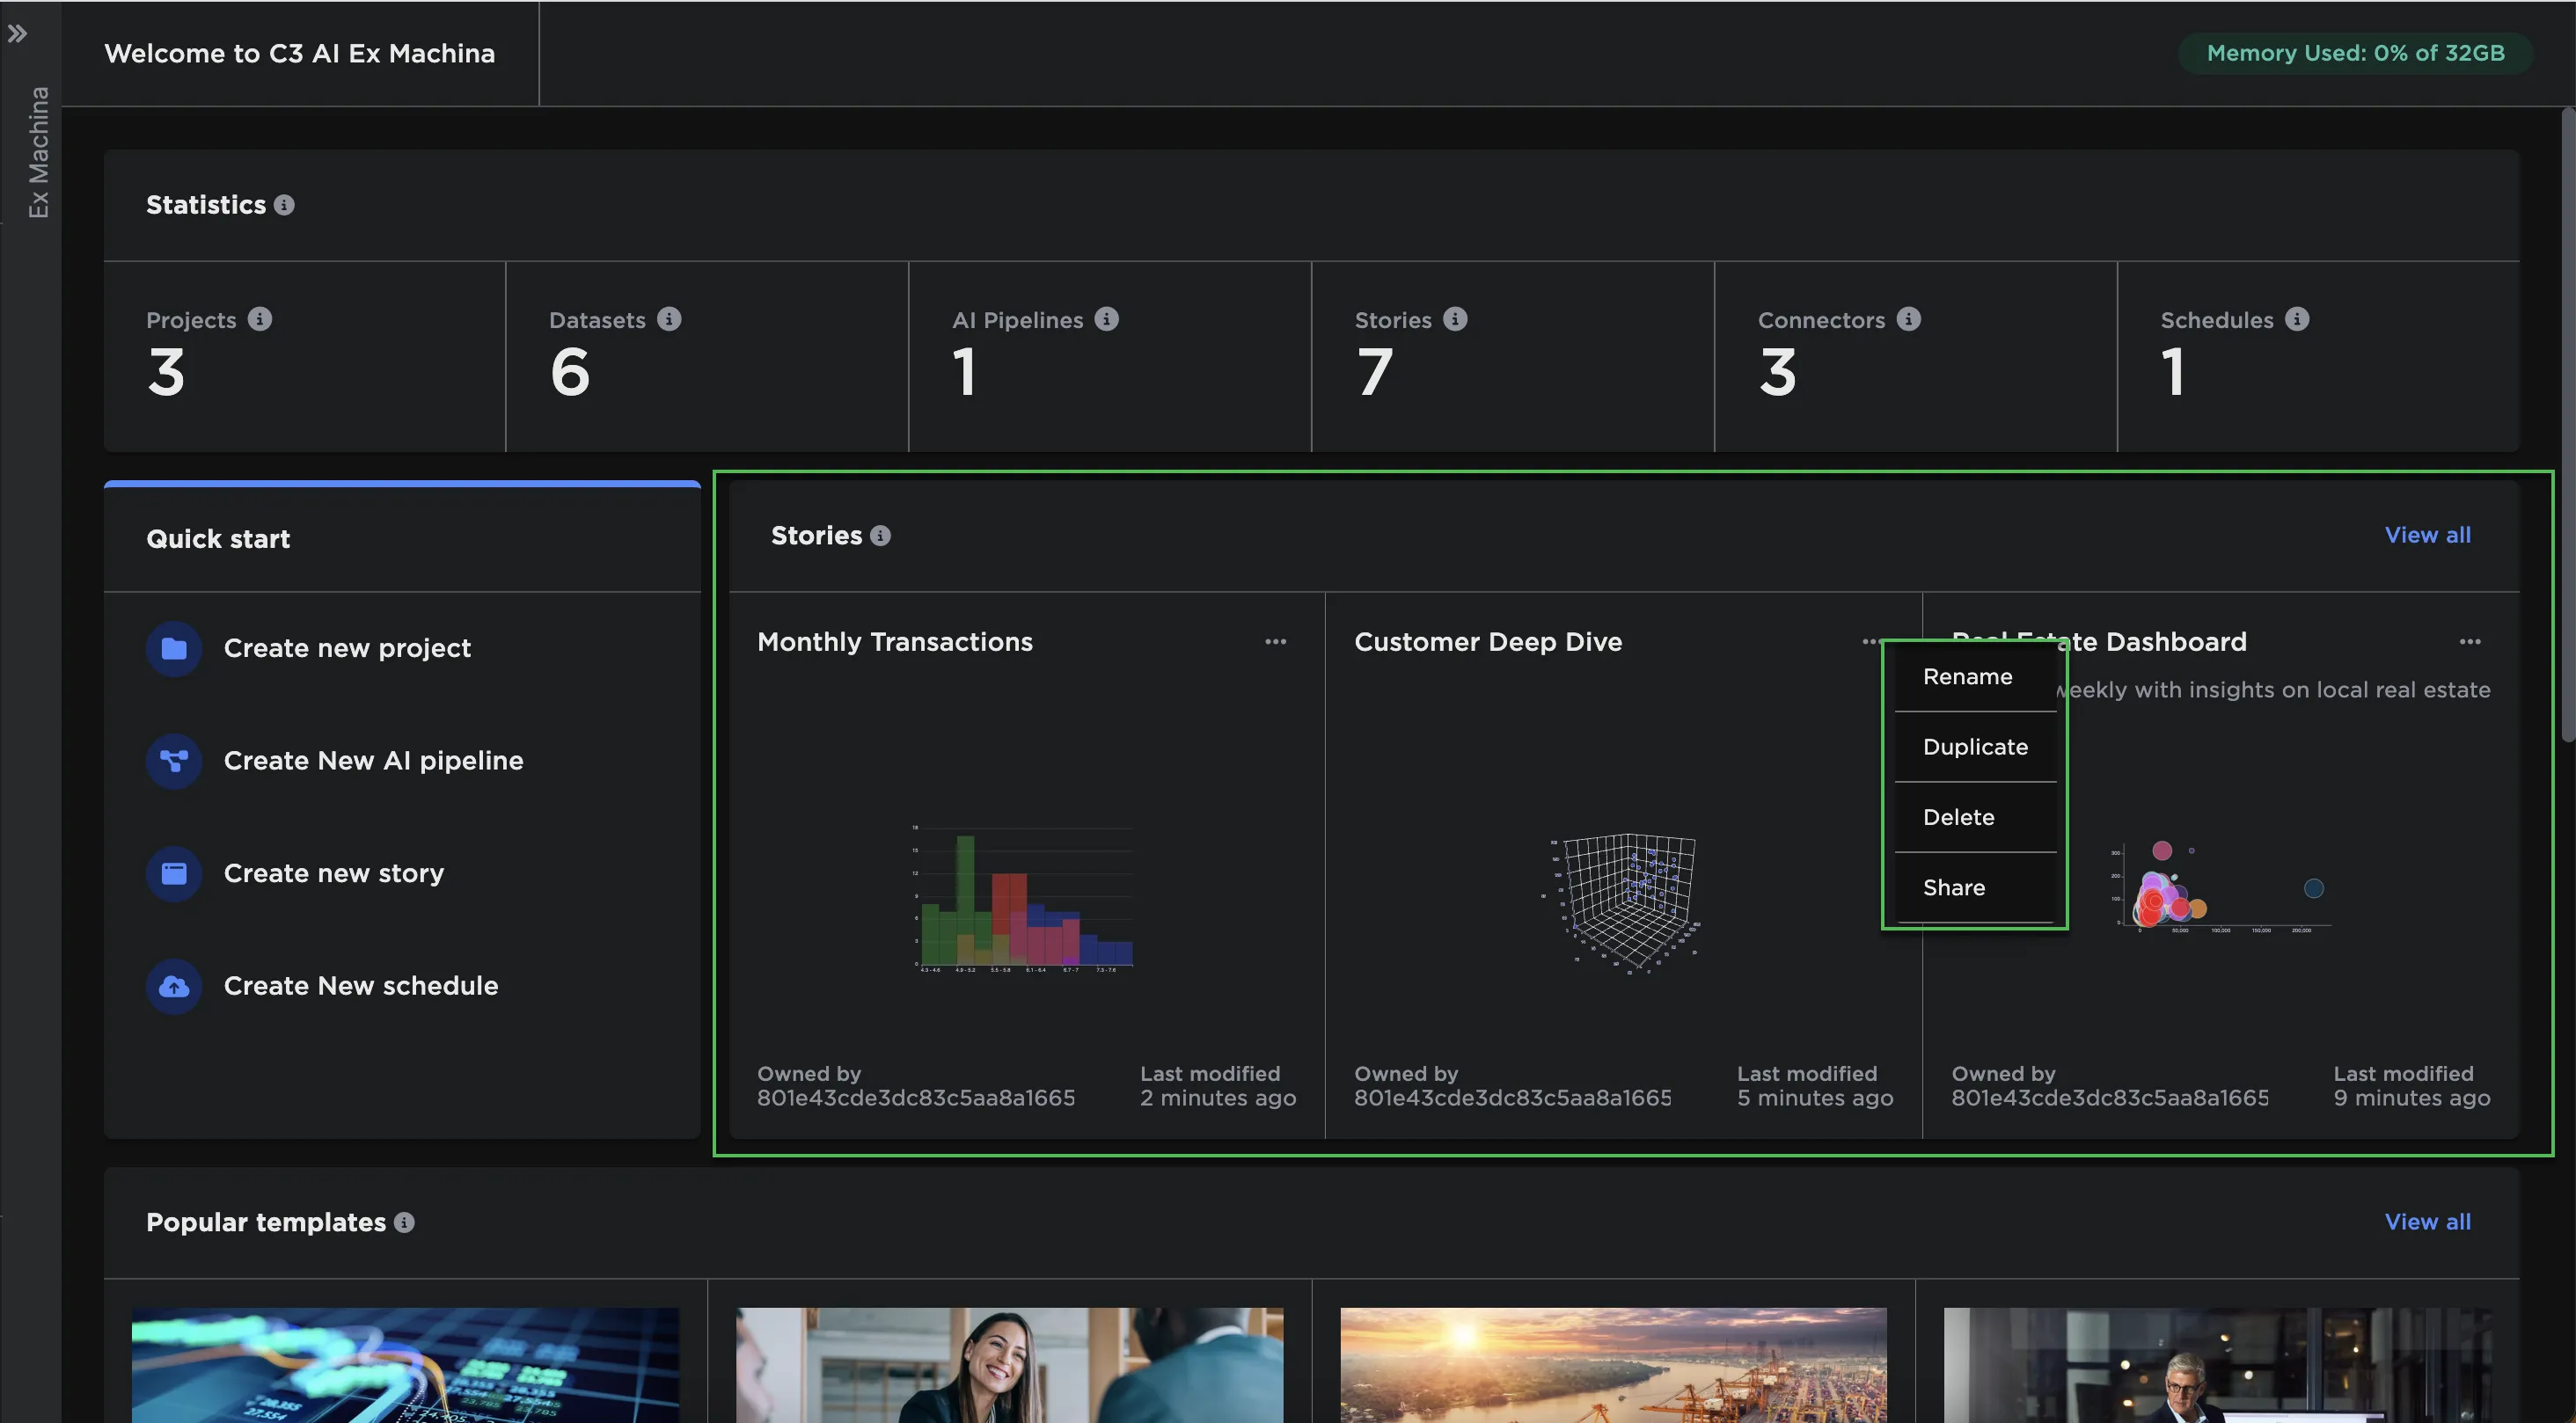
Figure 8: Recent stories on the homepage
To see more stories, select View All or navigate to the stories page from the sidebar navigation menu.
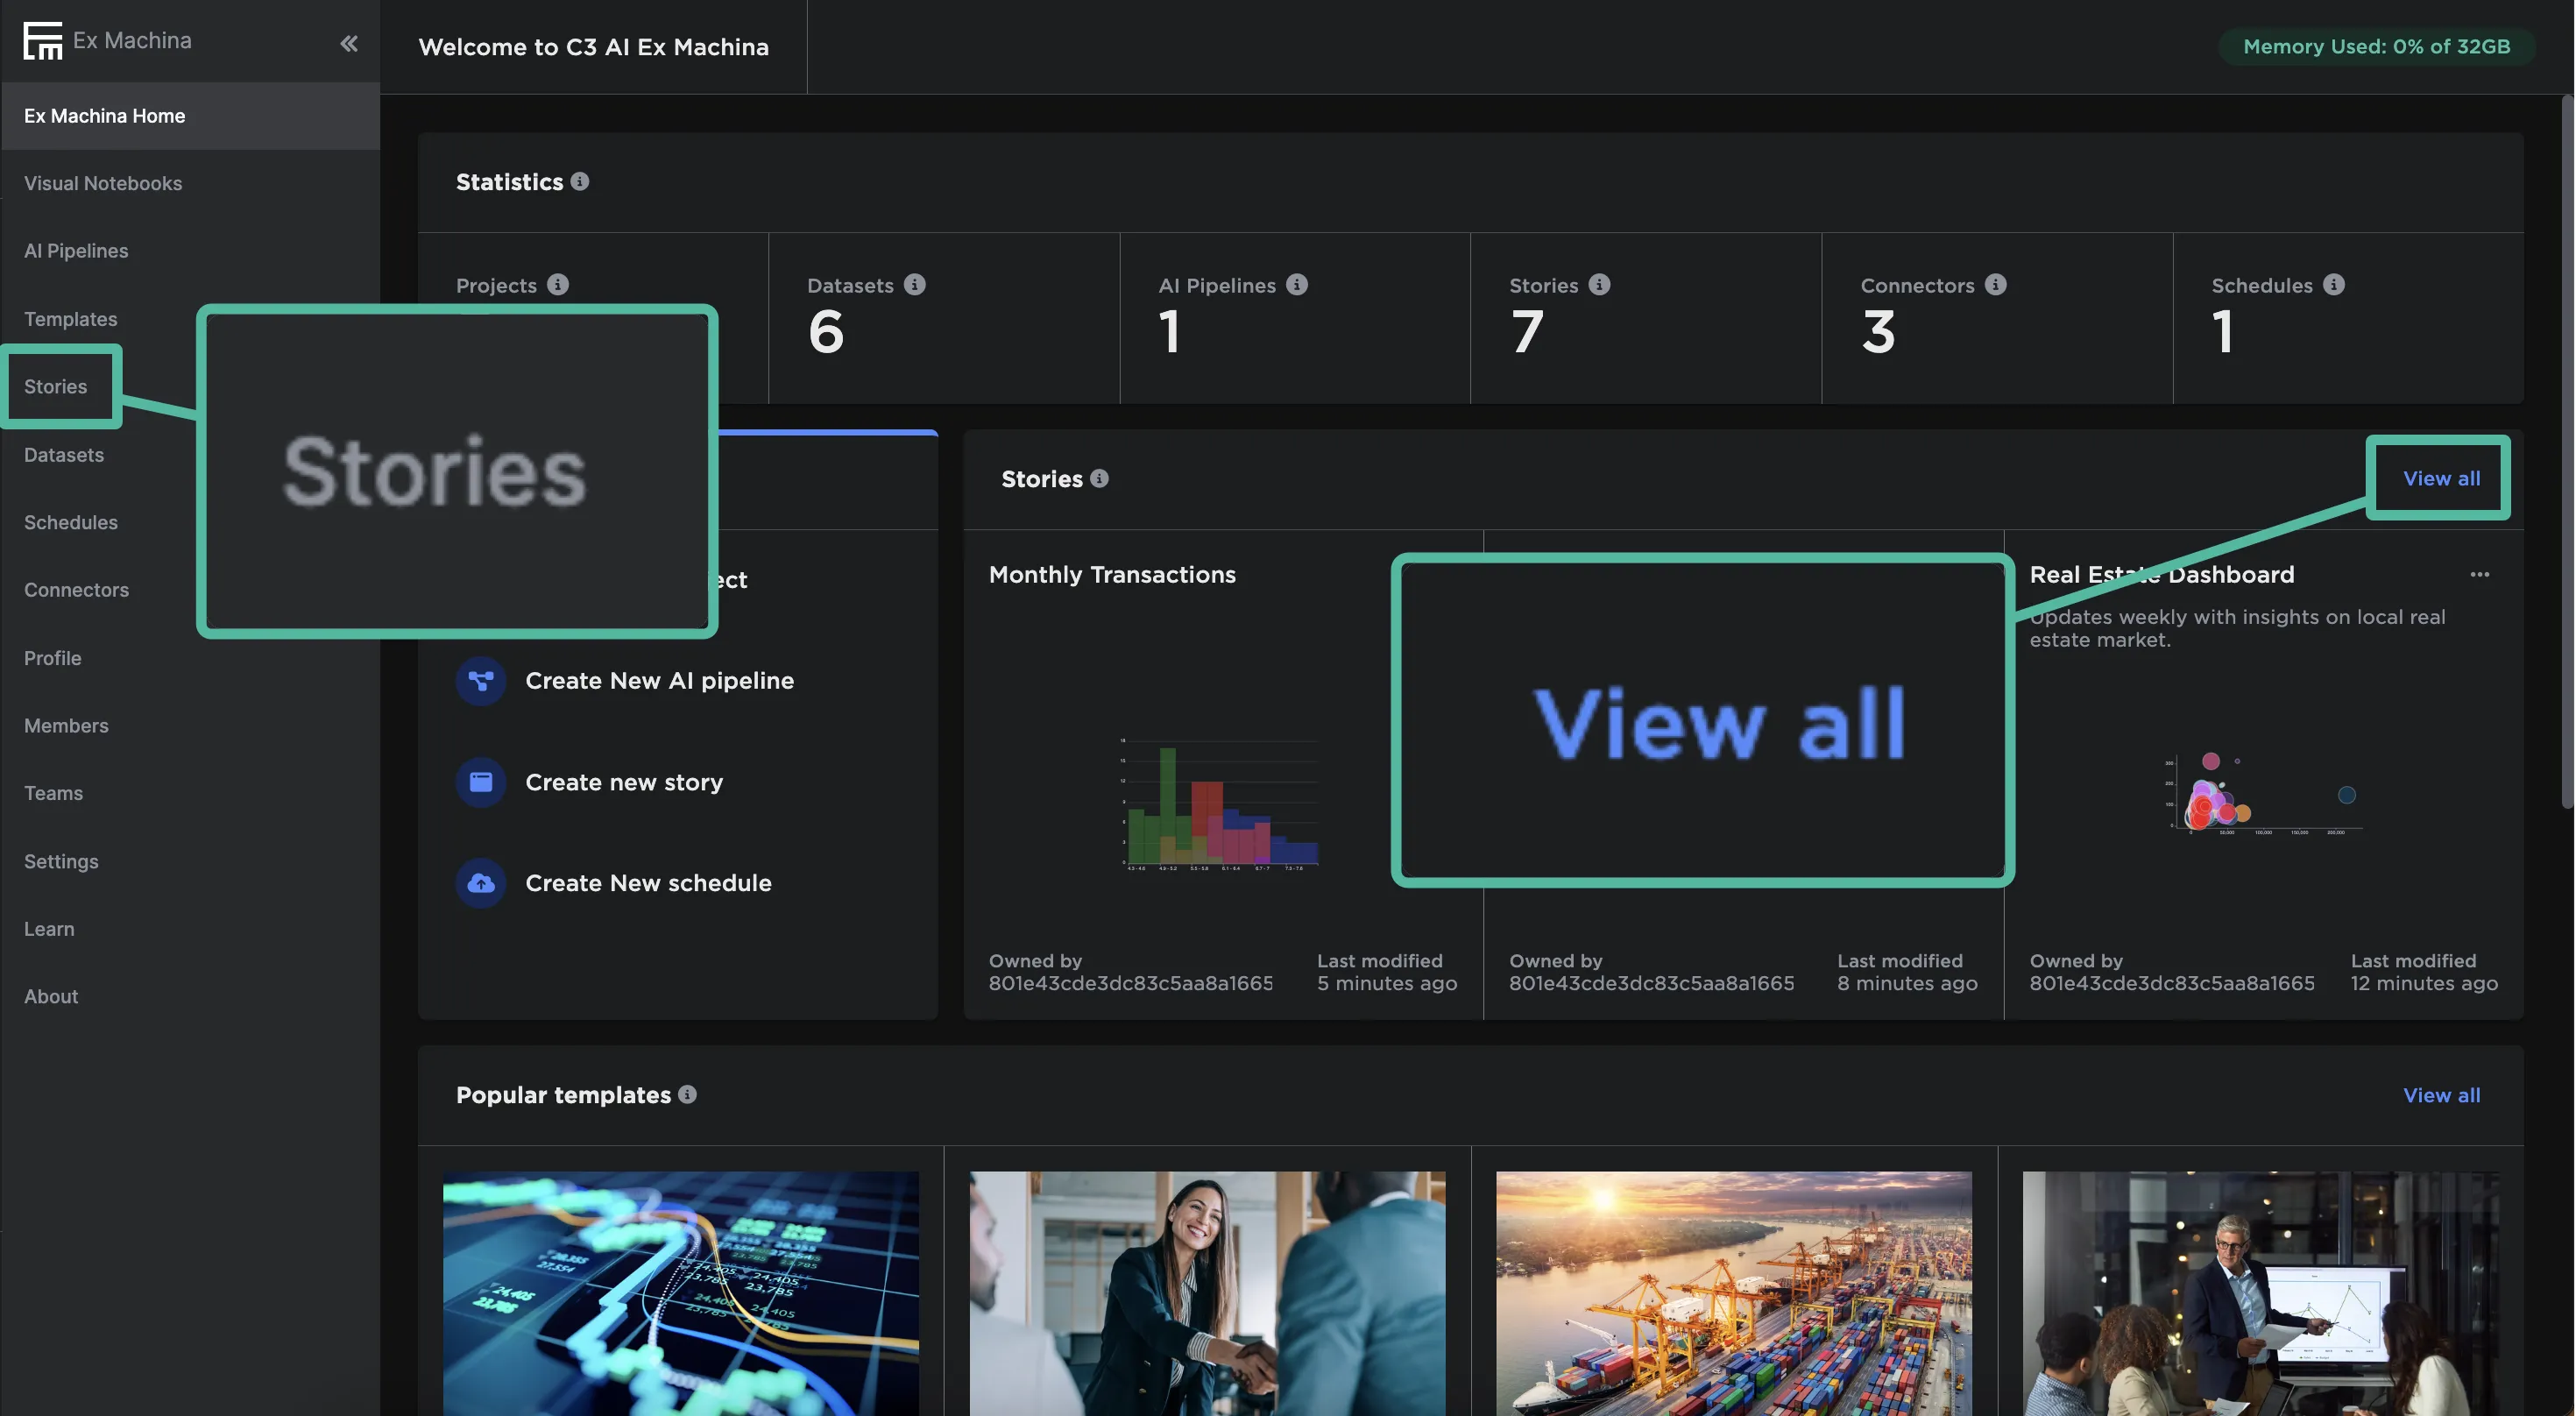
Figure 9: Access all stories
From the stories page you can:
- Search for a specific story using the search bar
- Filter stories by those "Owned by me" or "Shared with me"
- Stories that are owned by you are stories you created
- Select Create Story to create a new Visual Notebooks story
- Select Open Story to view or edit a story
- Select the three-dot overflow menu beside a story to rename, duplicate, delete, or share that story
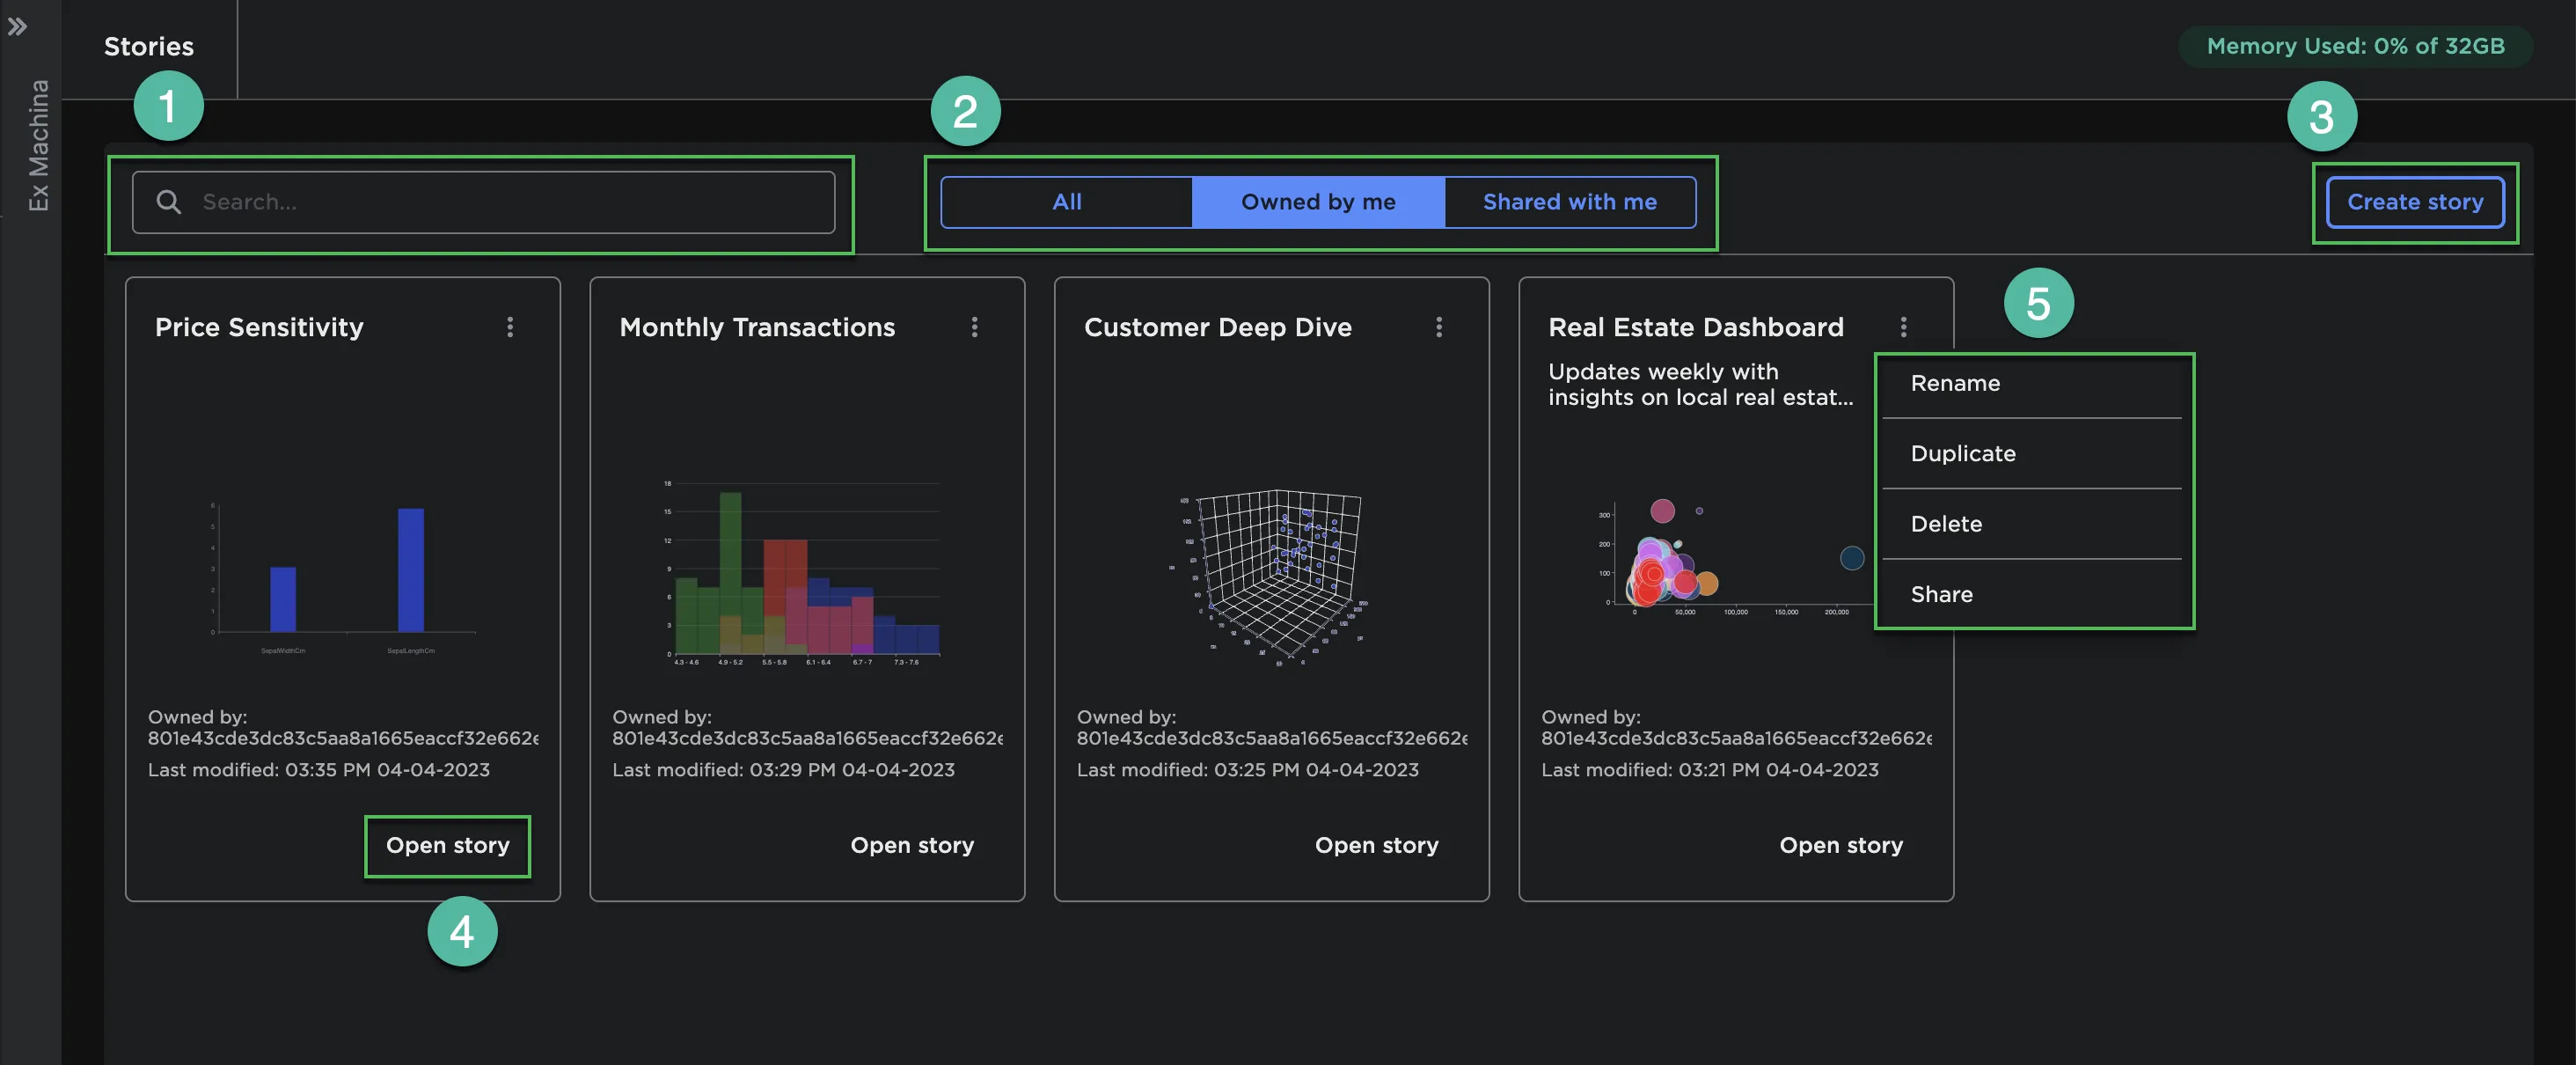
Figure 10: Access, create, and share stories from the stories page
Creating stories
Create a story from the homepage or from the dedicated stories page. Enter a name for the story and add an optional description.
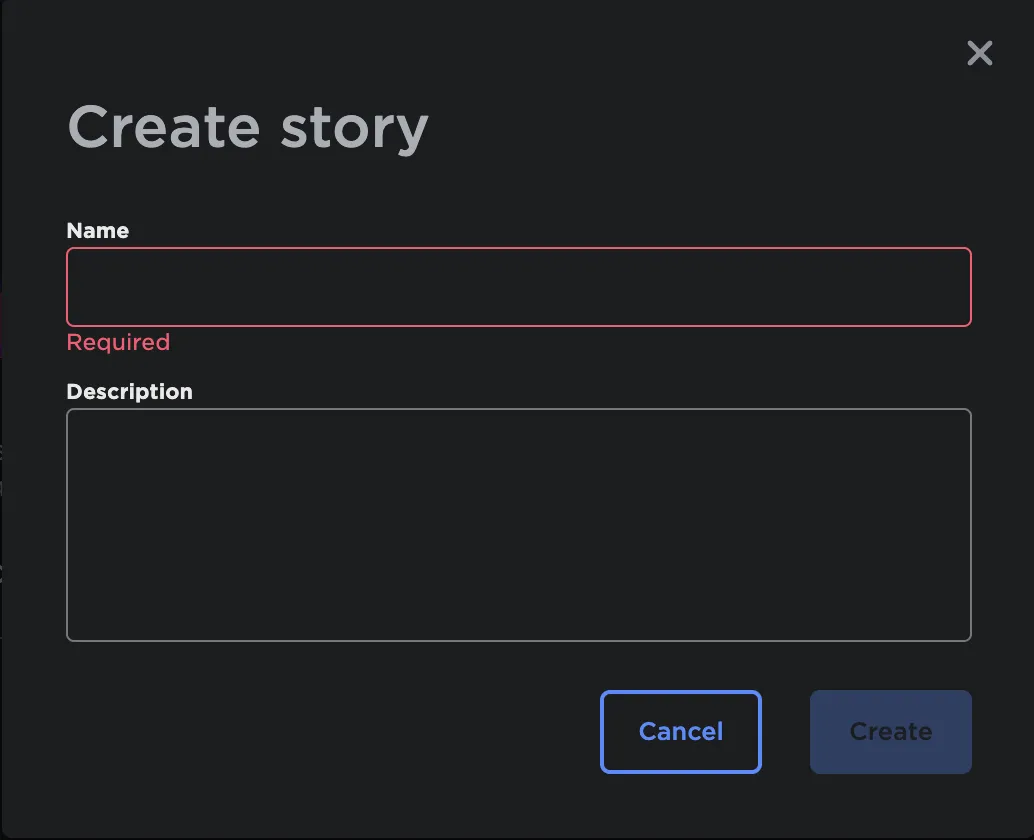
Figure 11: Name a new story
Creating a story opens your new story in edit mode. To the right is a list of collections that you made or have access to, along with a search bar. Expand a collection to see the visualizations within that collection.
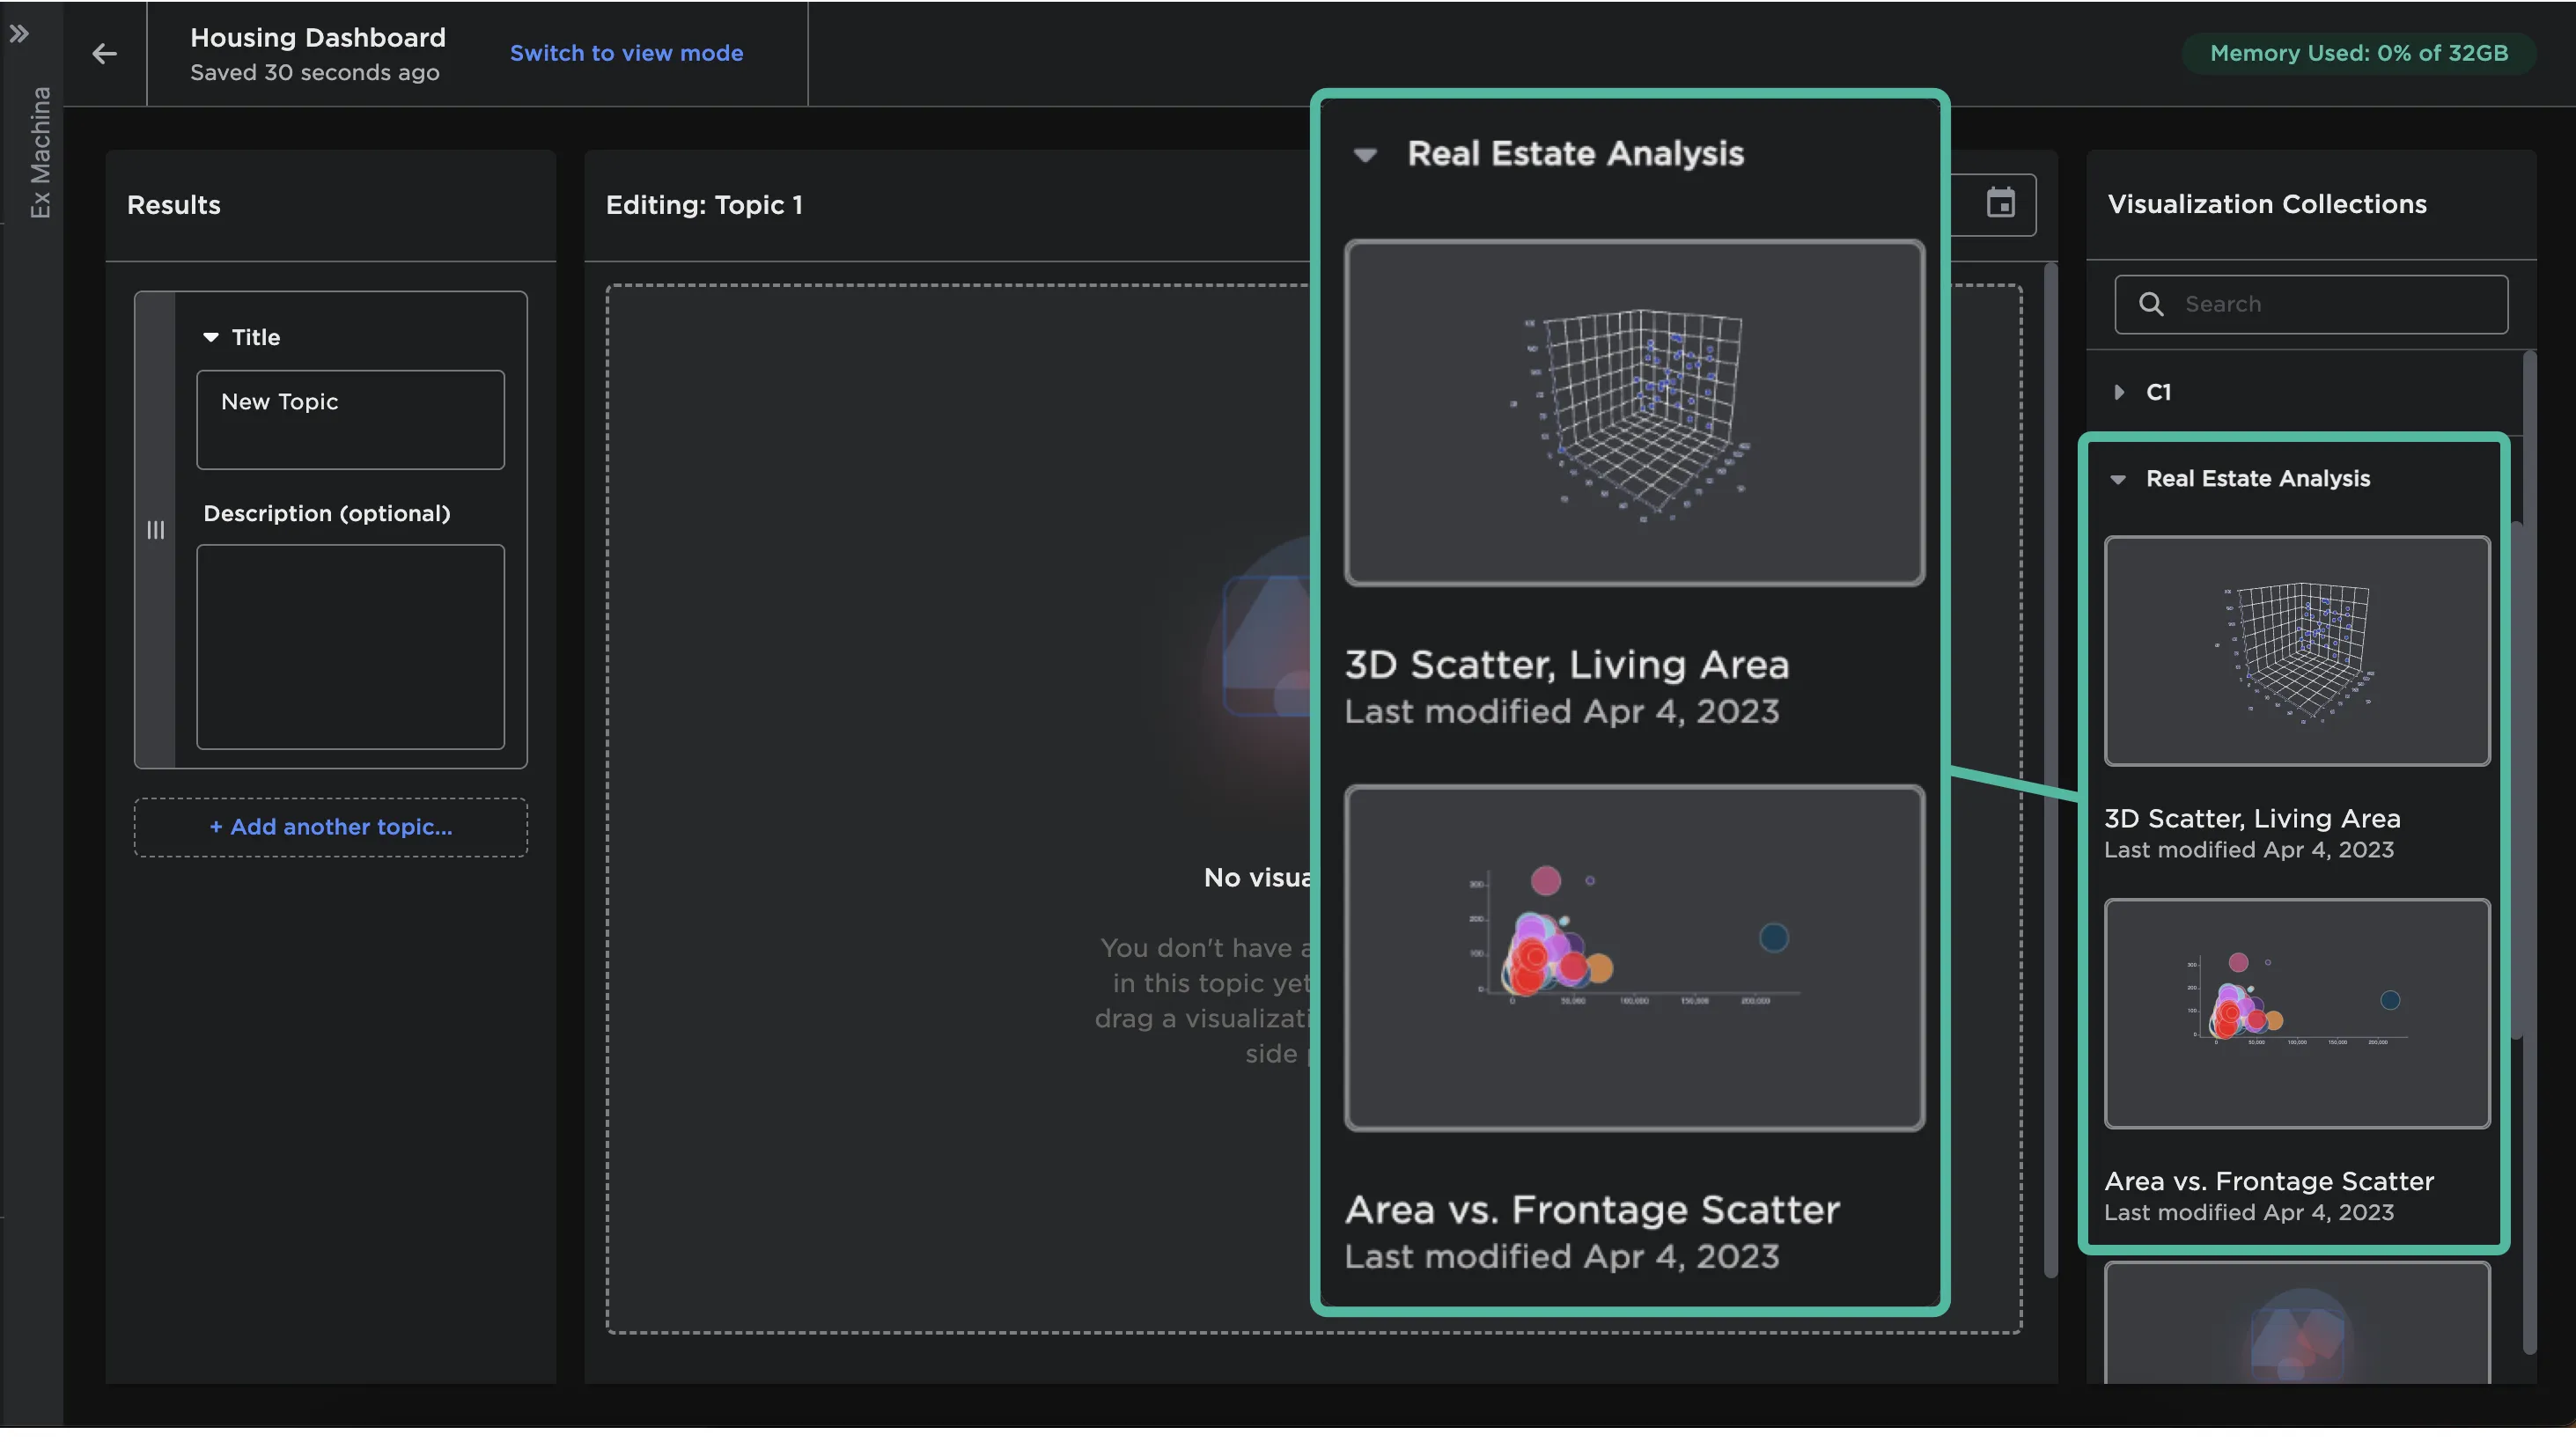
Figure 12: Visualizations within a collection
Drag a visualization within a collection onto the grey rectangle in the center of the editor. Add additional visualizations or reorder visualization using the same drag and drop interface. You can drag visualizations from multiple collections into a story.
Add descriptions to your visualizations by typing in the Description box underneath each chart.
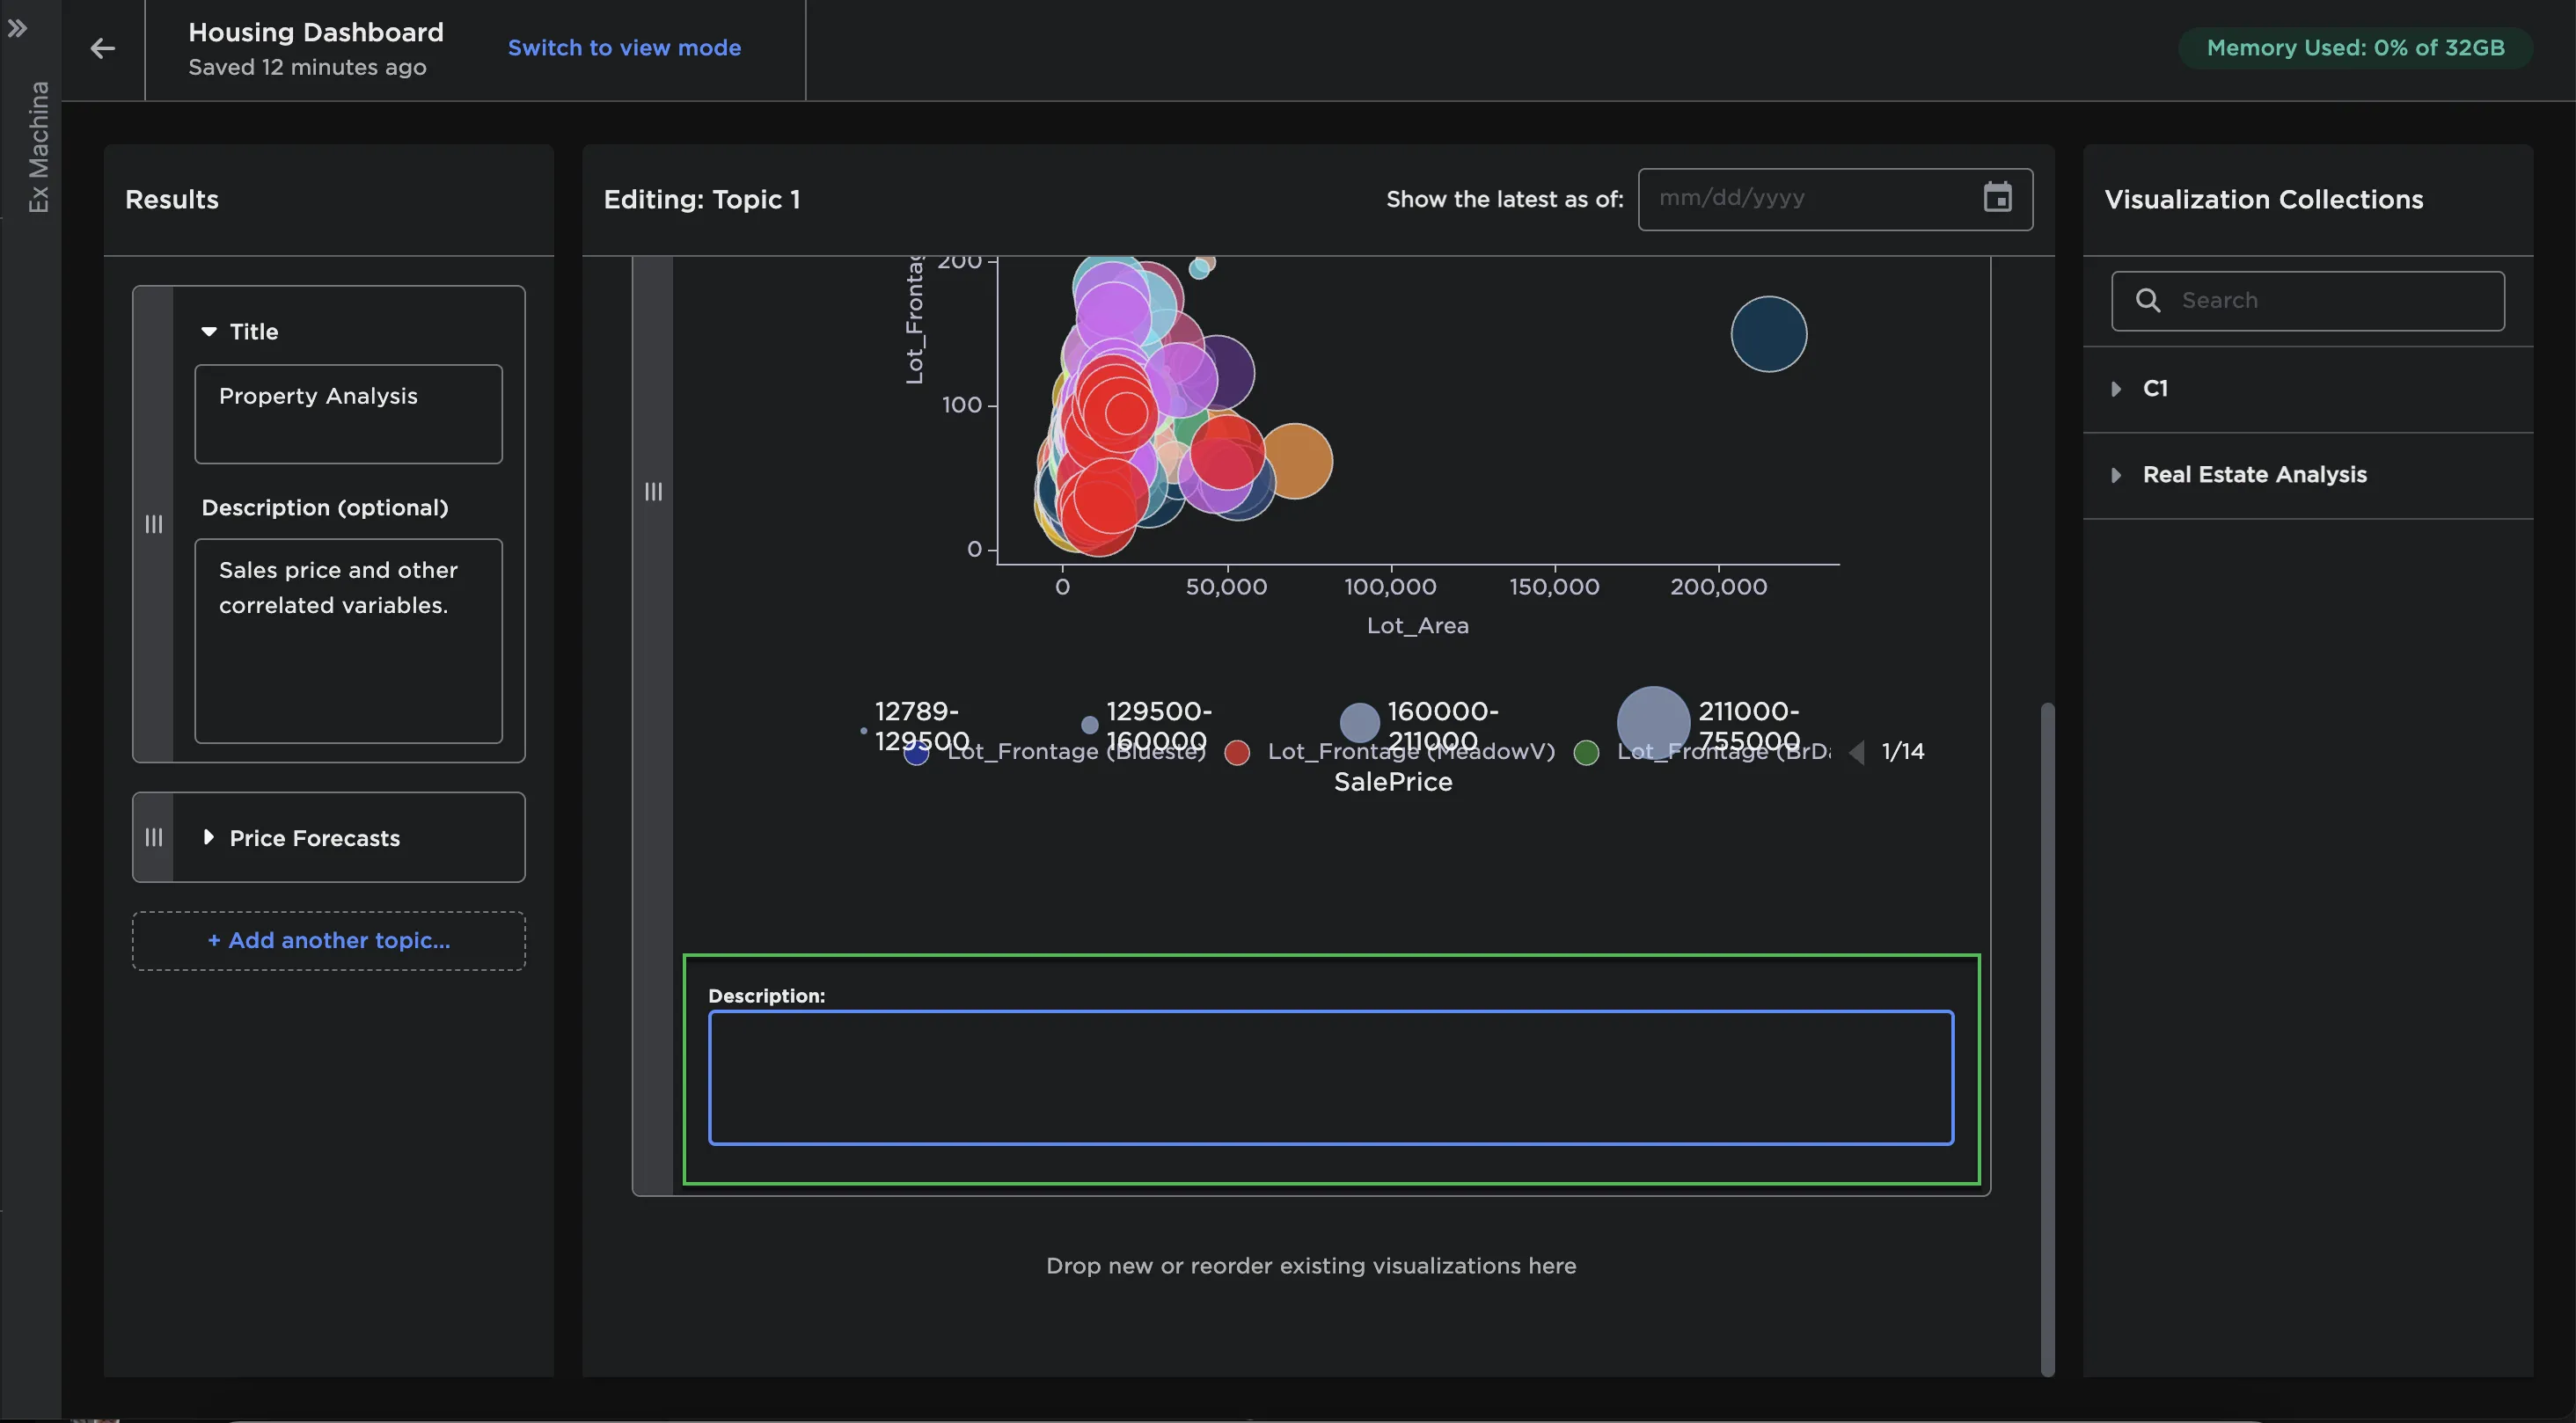
Figure 13: Visualization description
Topics are the pages of your story. Add additional topics, name topics, and add optional topic descriptions using the panel on the left.
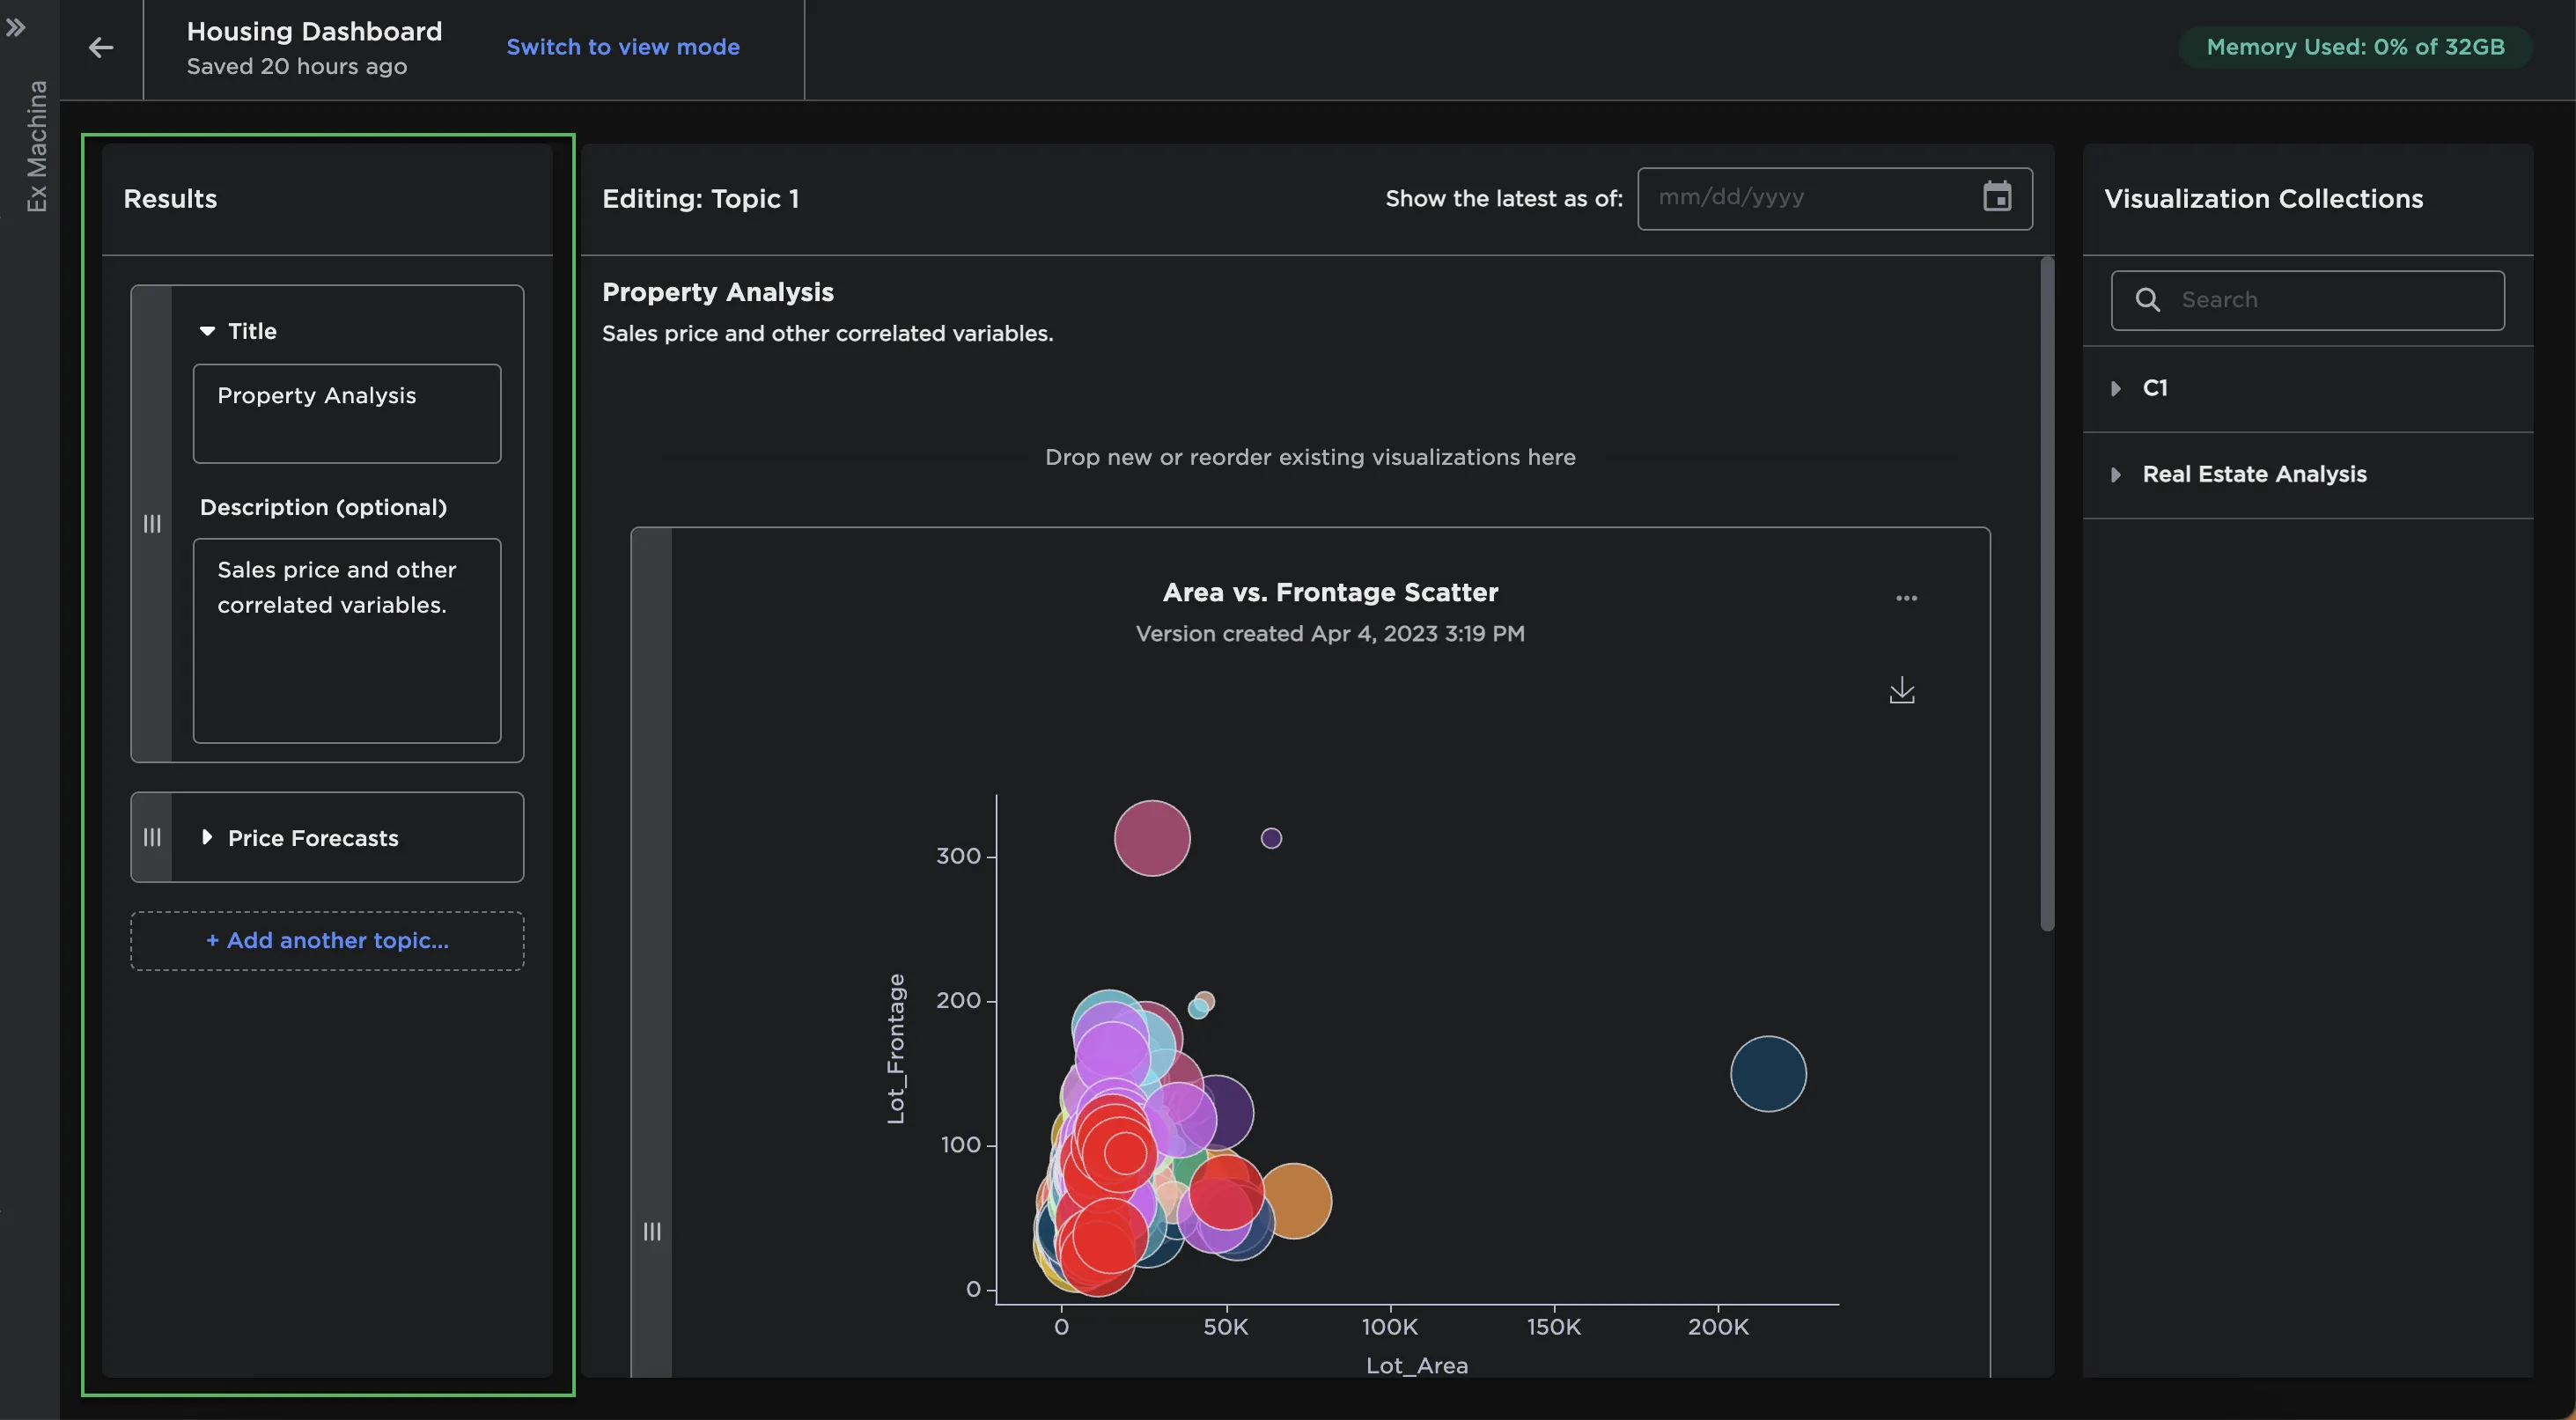
Figure 14: Edit story topics
View your story by selecting Switch to view mode!
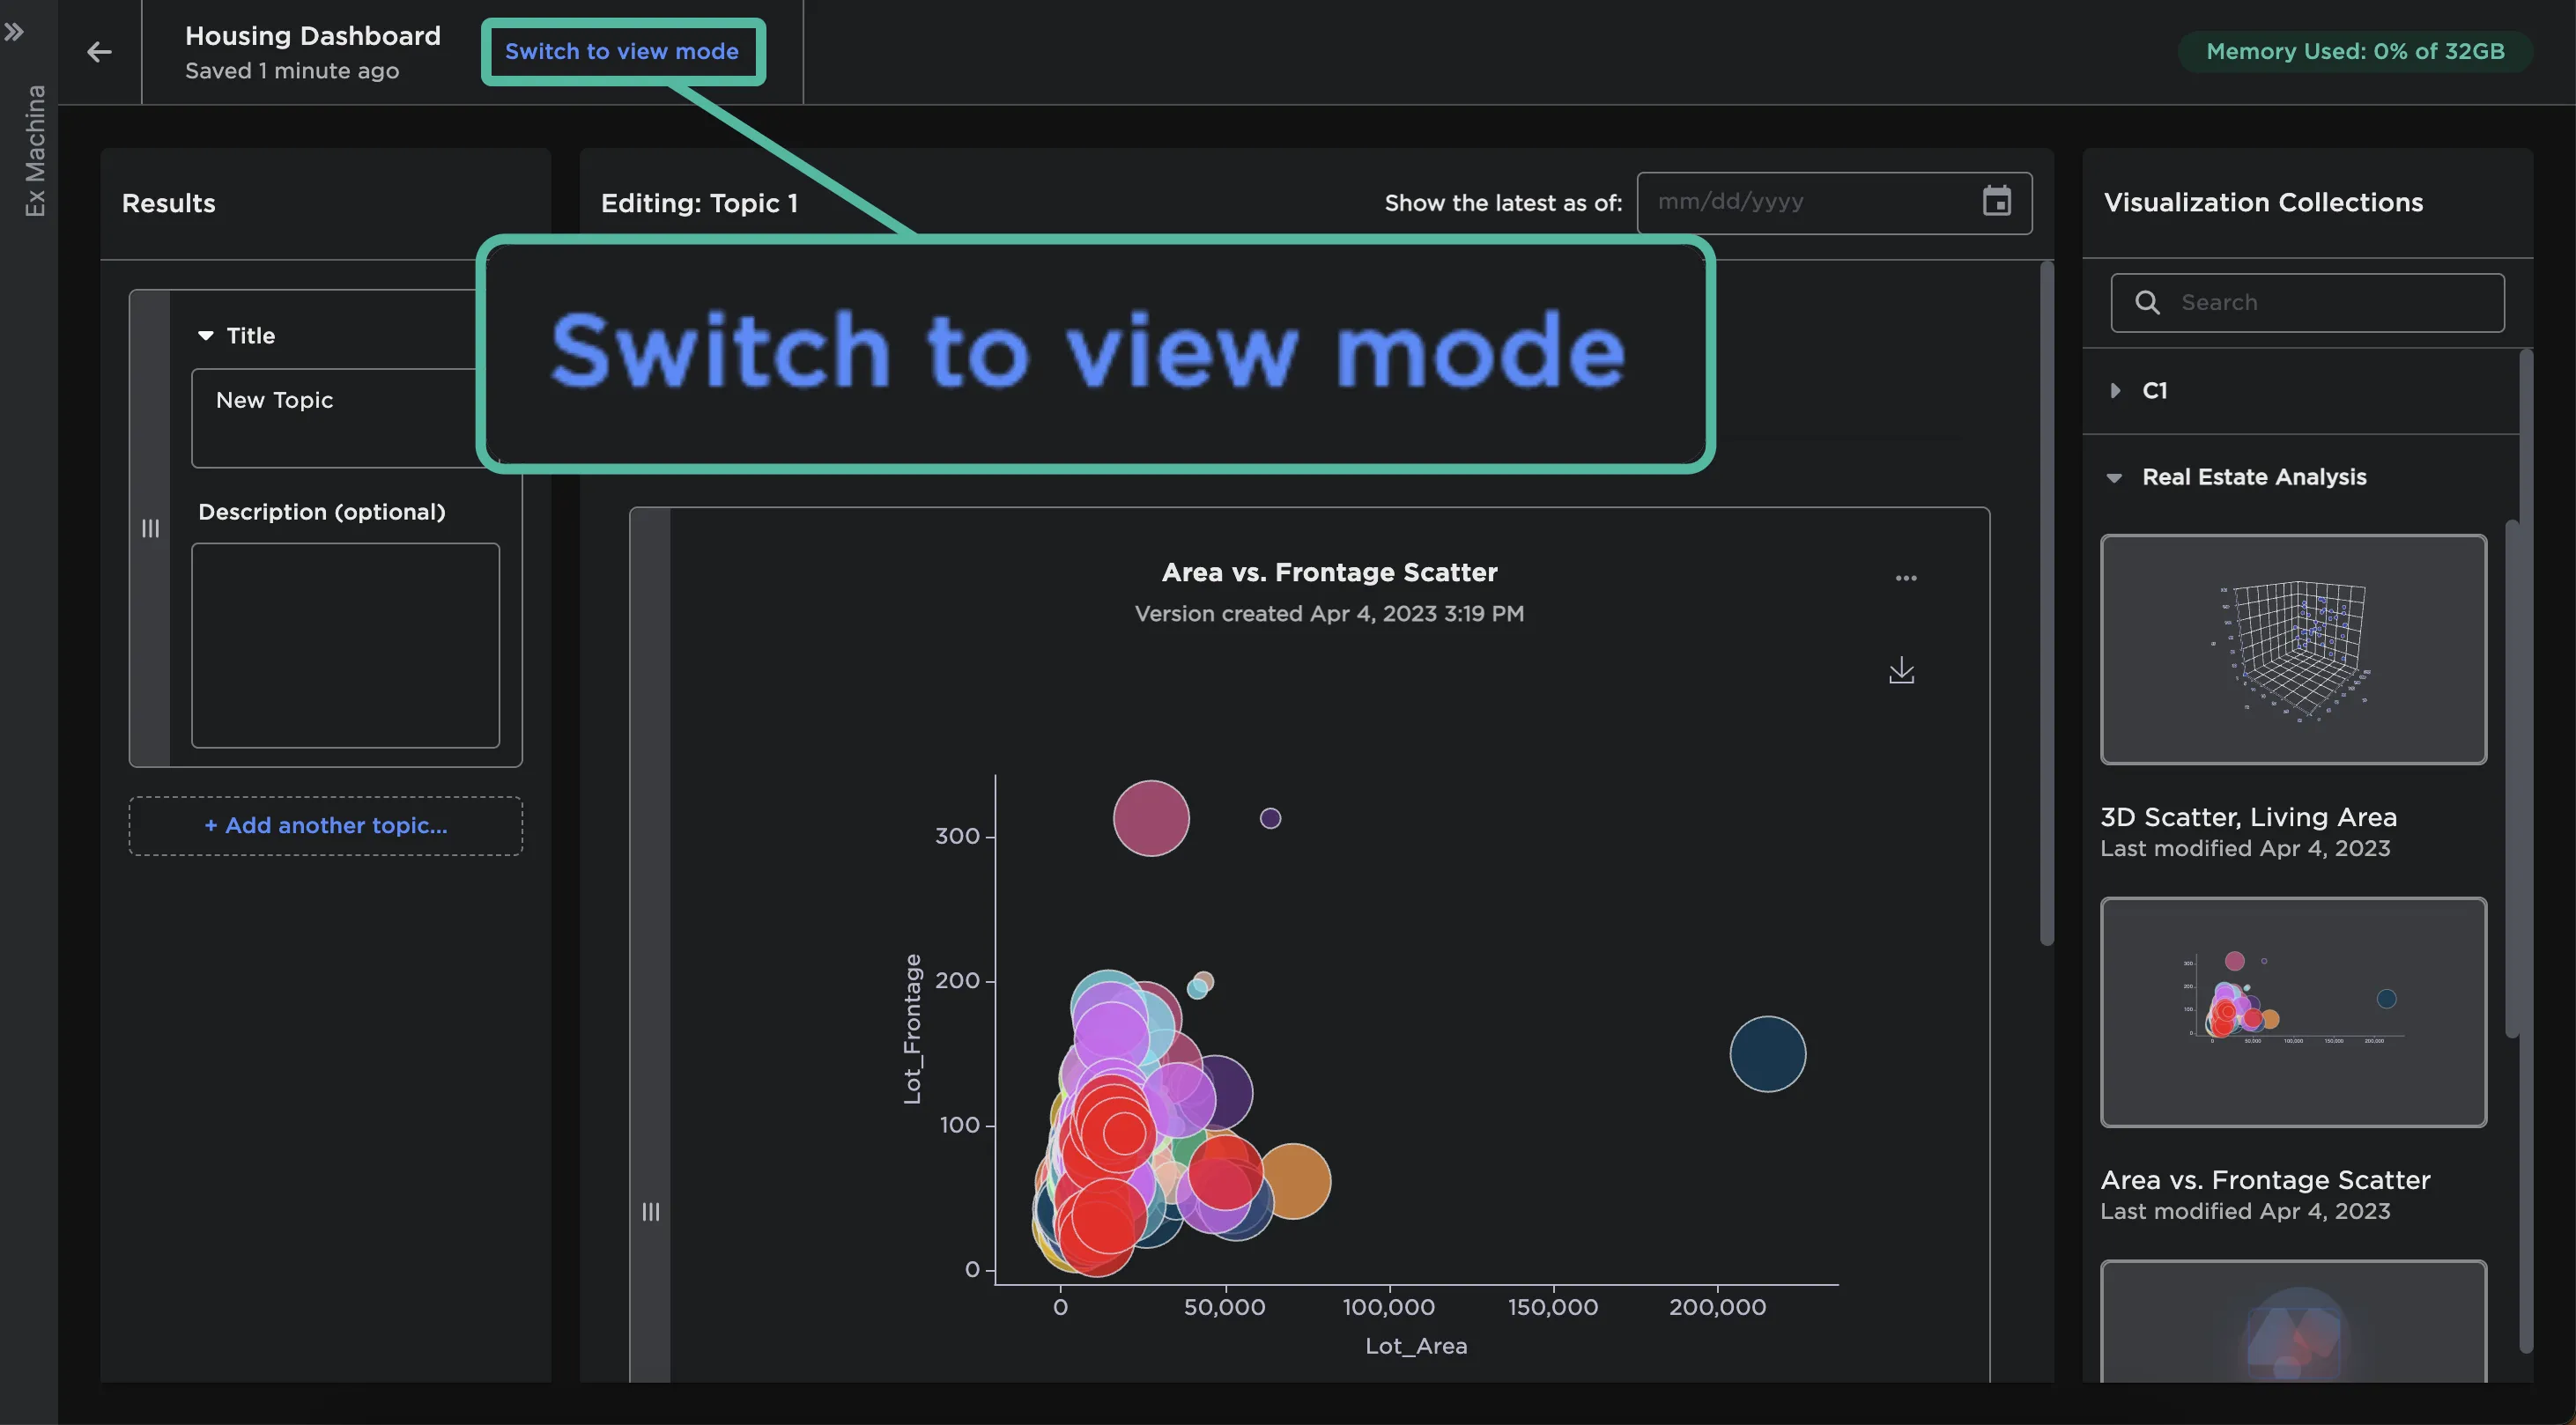
Figure 15: Switch from edit mode to view mode
Additional functionality
You can share a story directly by selecting the Share story button and selecting the teams with which you want to share the story.
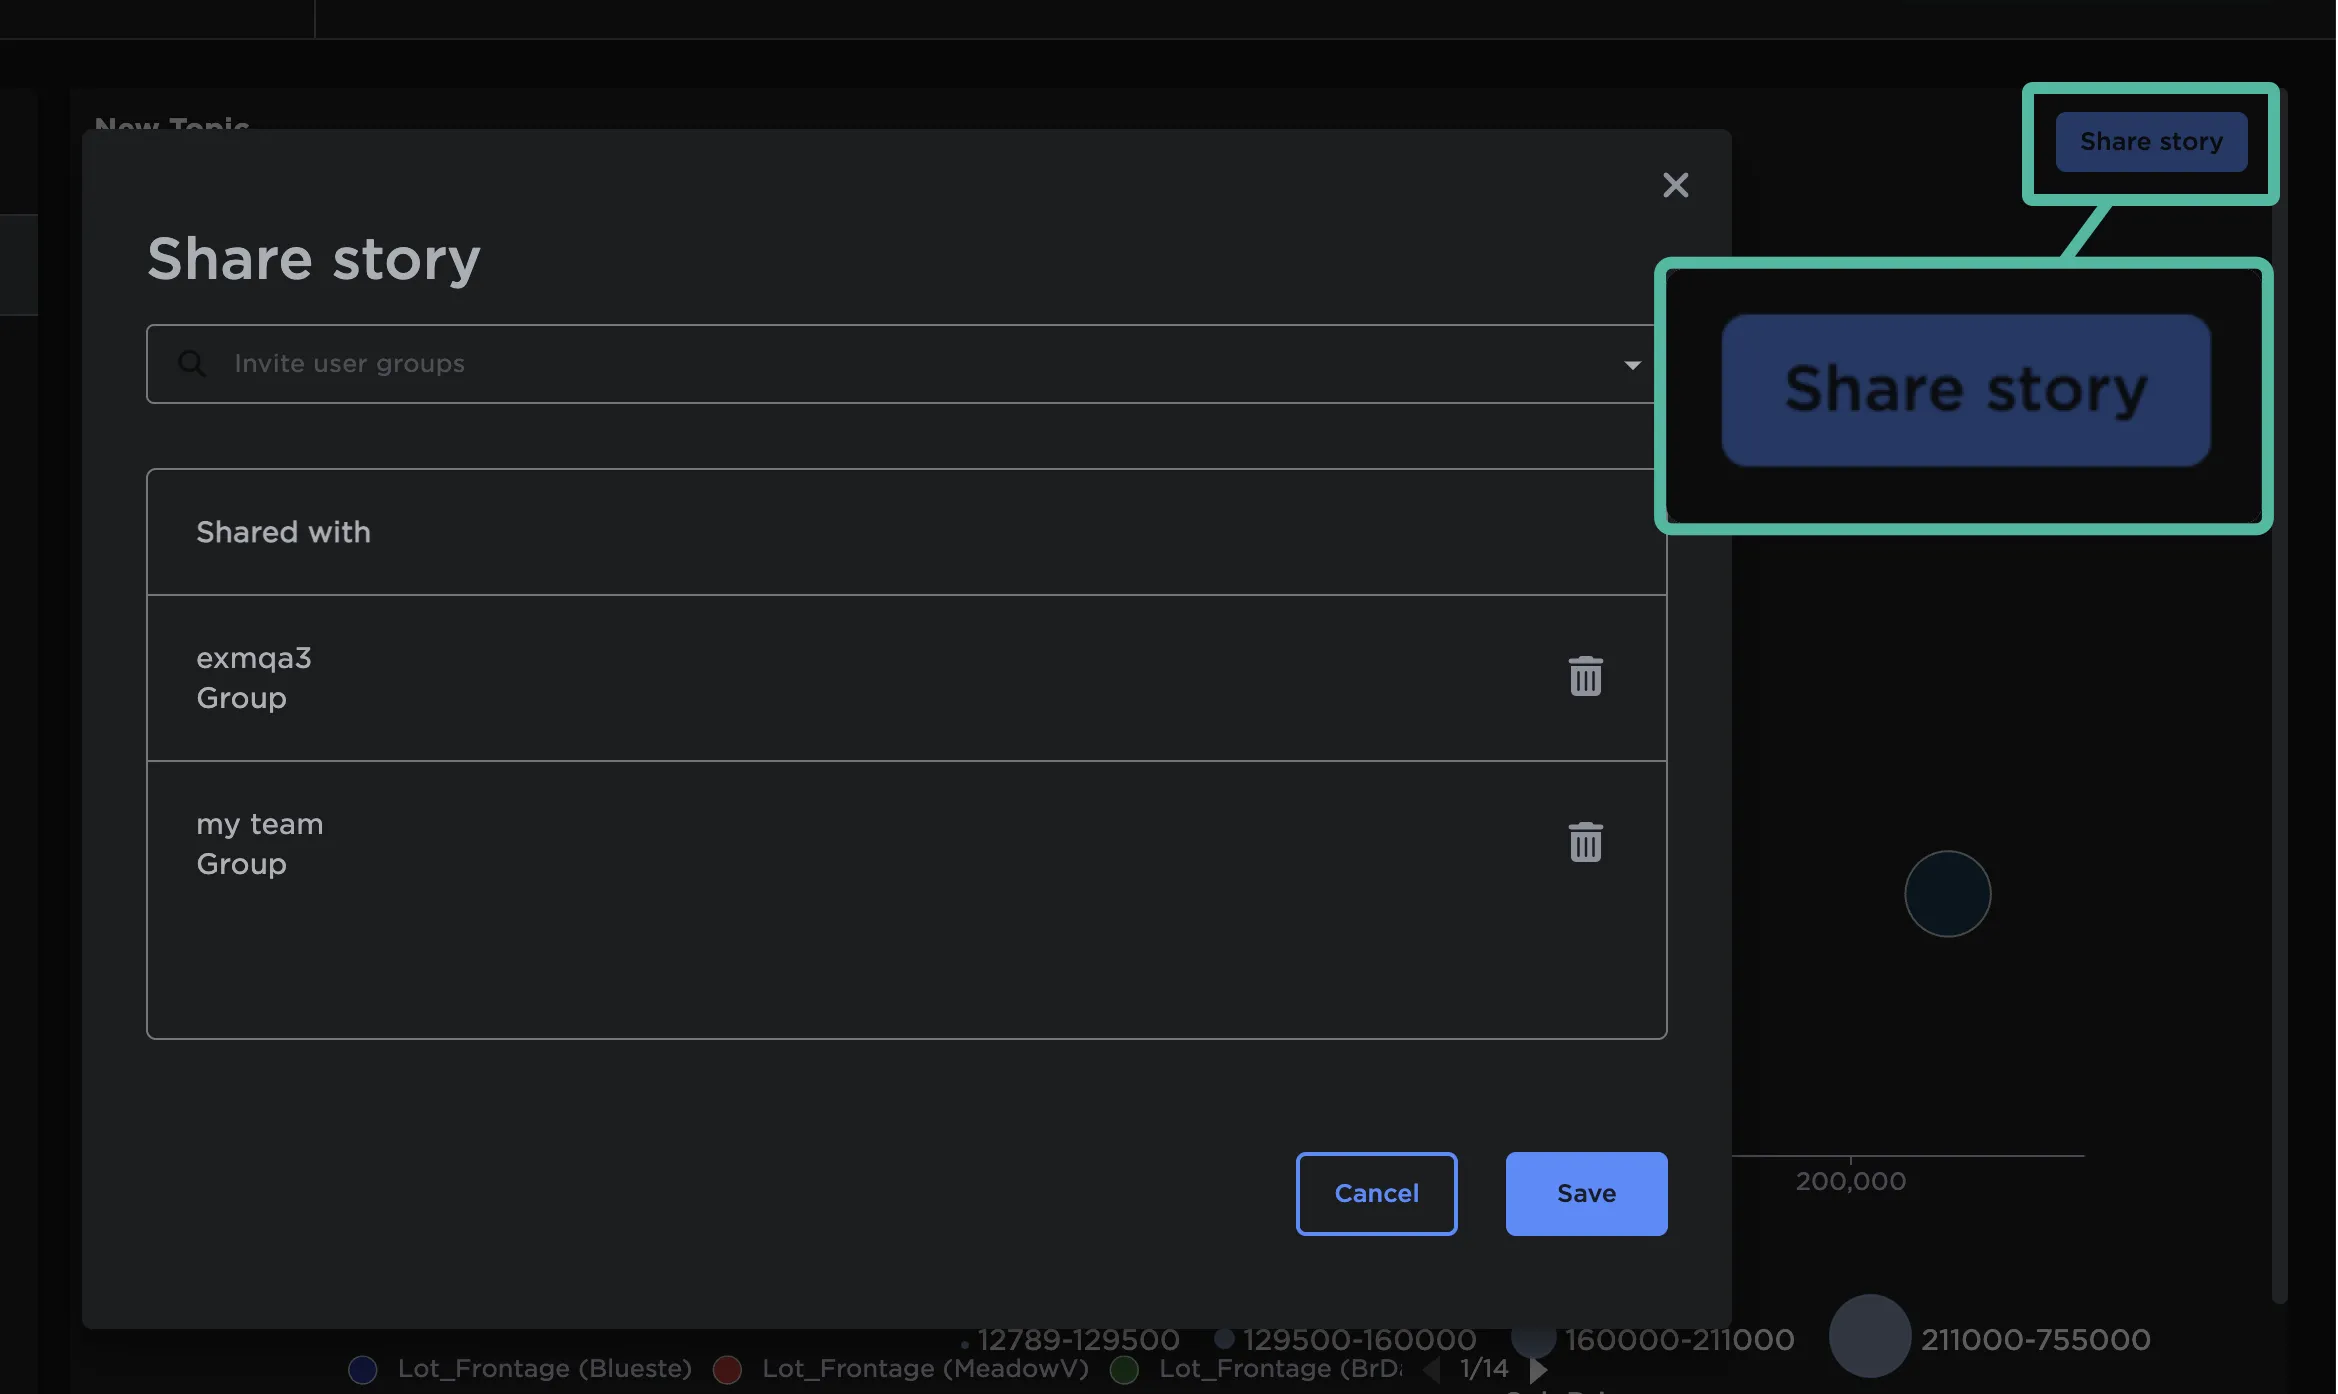
Figure 16: Share stories
Use the Show the latest as of field at the top of a story to see what the story looked like at another point in time.
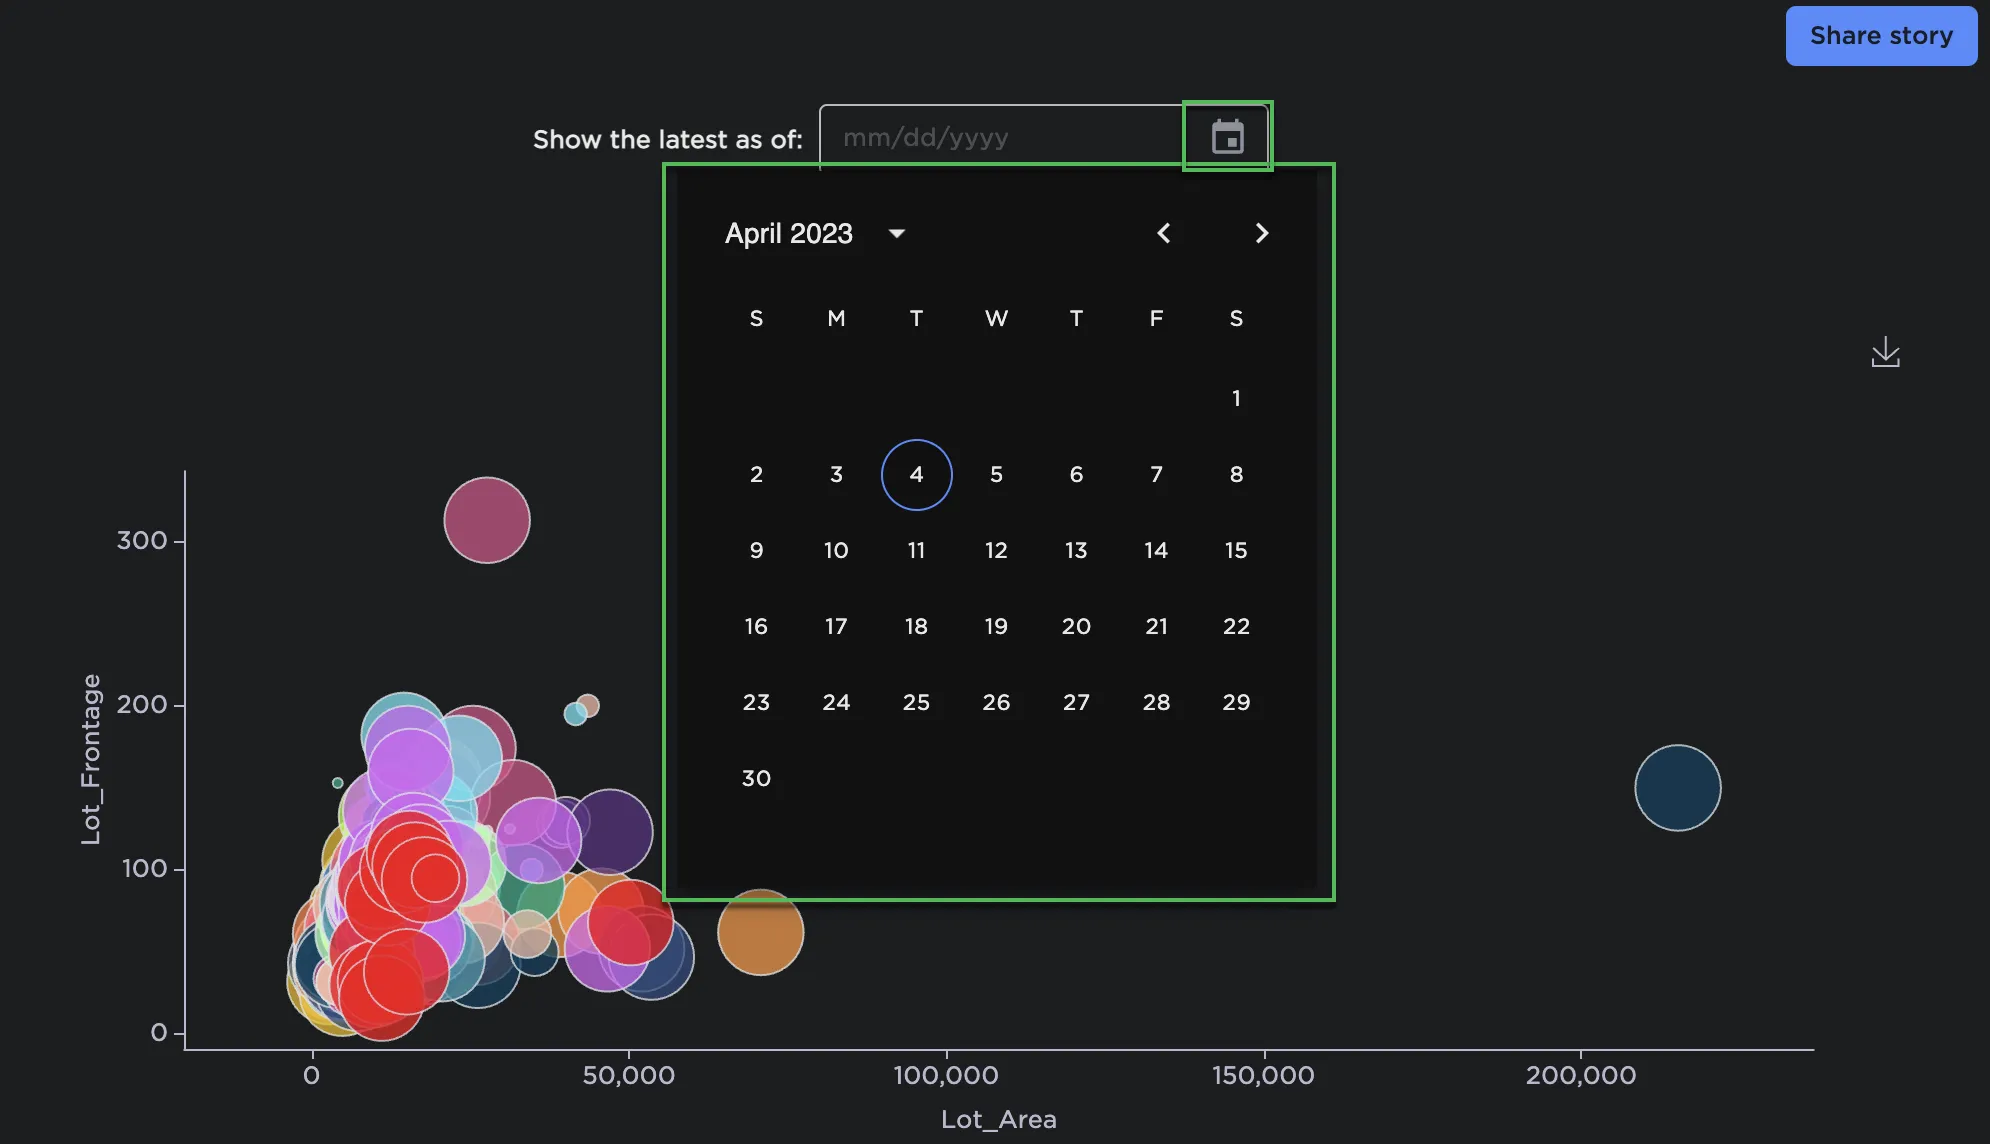
Figure 17: View a story as of a certain date
If the visualizations in the story were not yet created on the date selected, No Visualization Available appears.