Stories and Datasets in Visual Notebooks
Stories—Visual Notebooks Dashboards
Visual Notebooks stories, depicted in Figure 1, are native dashboards created from visualizations defined within Visual Notebooks projects. Stories can be shared with team members as a means of distributing Visual Notebooks insights. Stories can be viewed at any time without the need to activate the Visual Notebooks workspace. Stories are automatically updated each time a visual notebook with an associated visualization is run and updated.
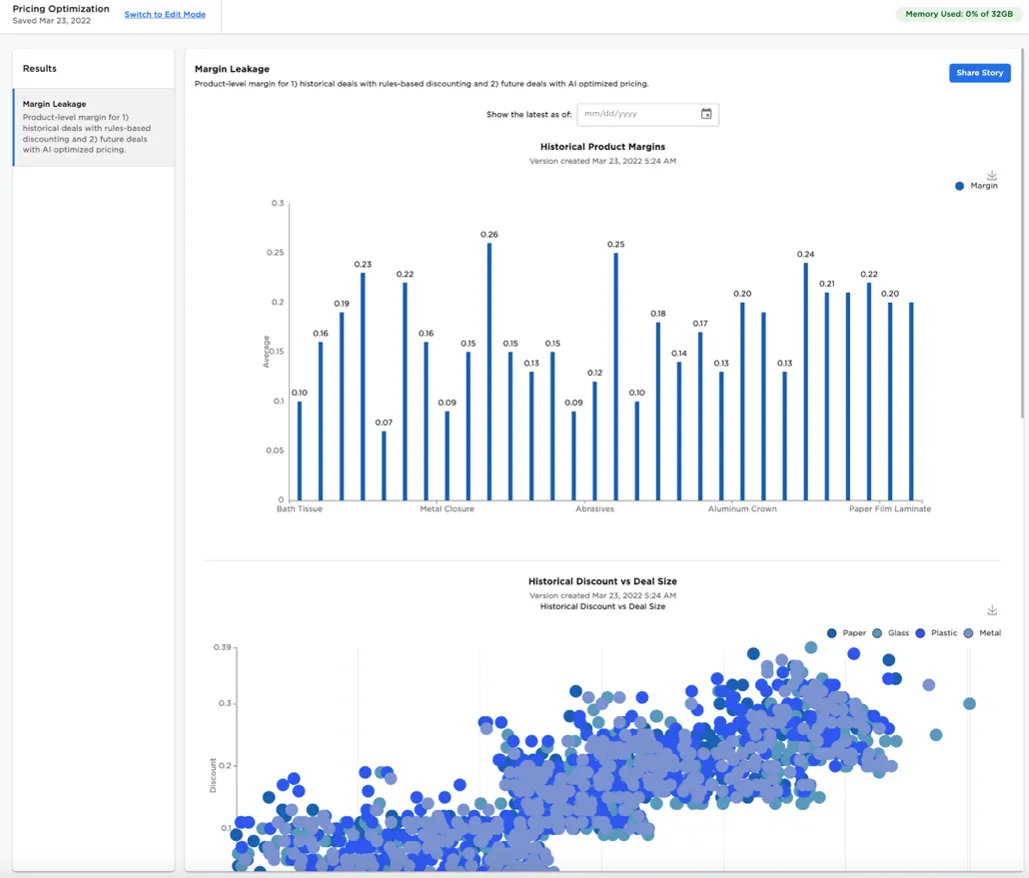
Figure 1: Visual Notebooks story
Creating and Accessing Stories
You can access stories from the dedicated stories page, depicted in Figure 2. From the stories menu you can:
- Select Create story to create a new Visual Notebooks story dashboard
- Filter stories by those created by the user--"Owned" by the user--or those that have been "Shared"
- Share a story with colleagues within the same account.
- A story can only be shared by the "Owner" or creator of the story
- Select Open story to view or edit a story
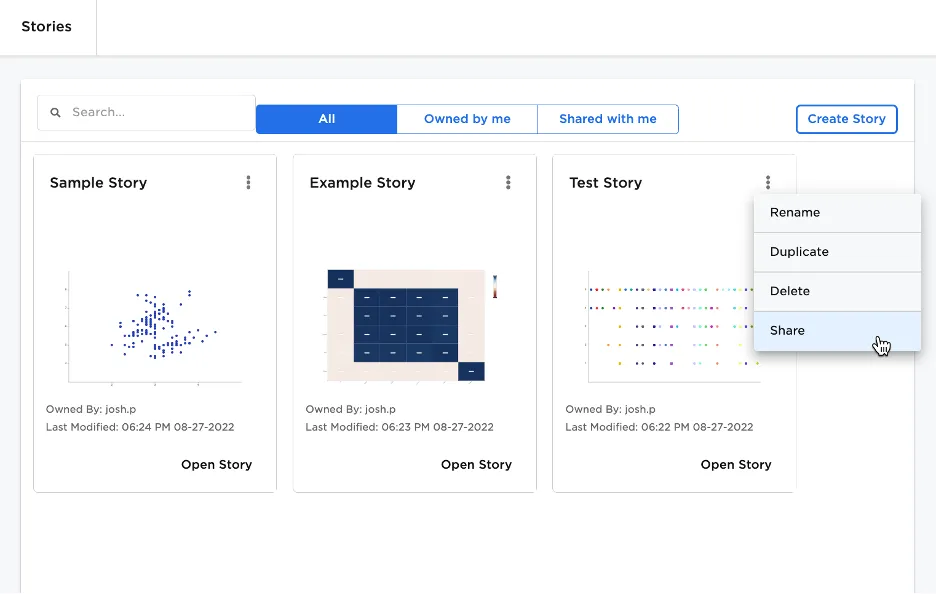
Figure 2: Access, create, and share stories from the stories page
Editing Stories
To use a visualization within an Visual Notebooks story, flag the visualization node within the visual notebook canvas by adding it to a "collection", as depicted in Figure 3.
Visualization collections can be thought of as folders/directories used to organize visualizations. For example, a collection may represent a topic or use case.
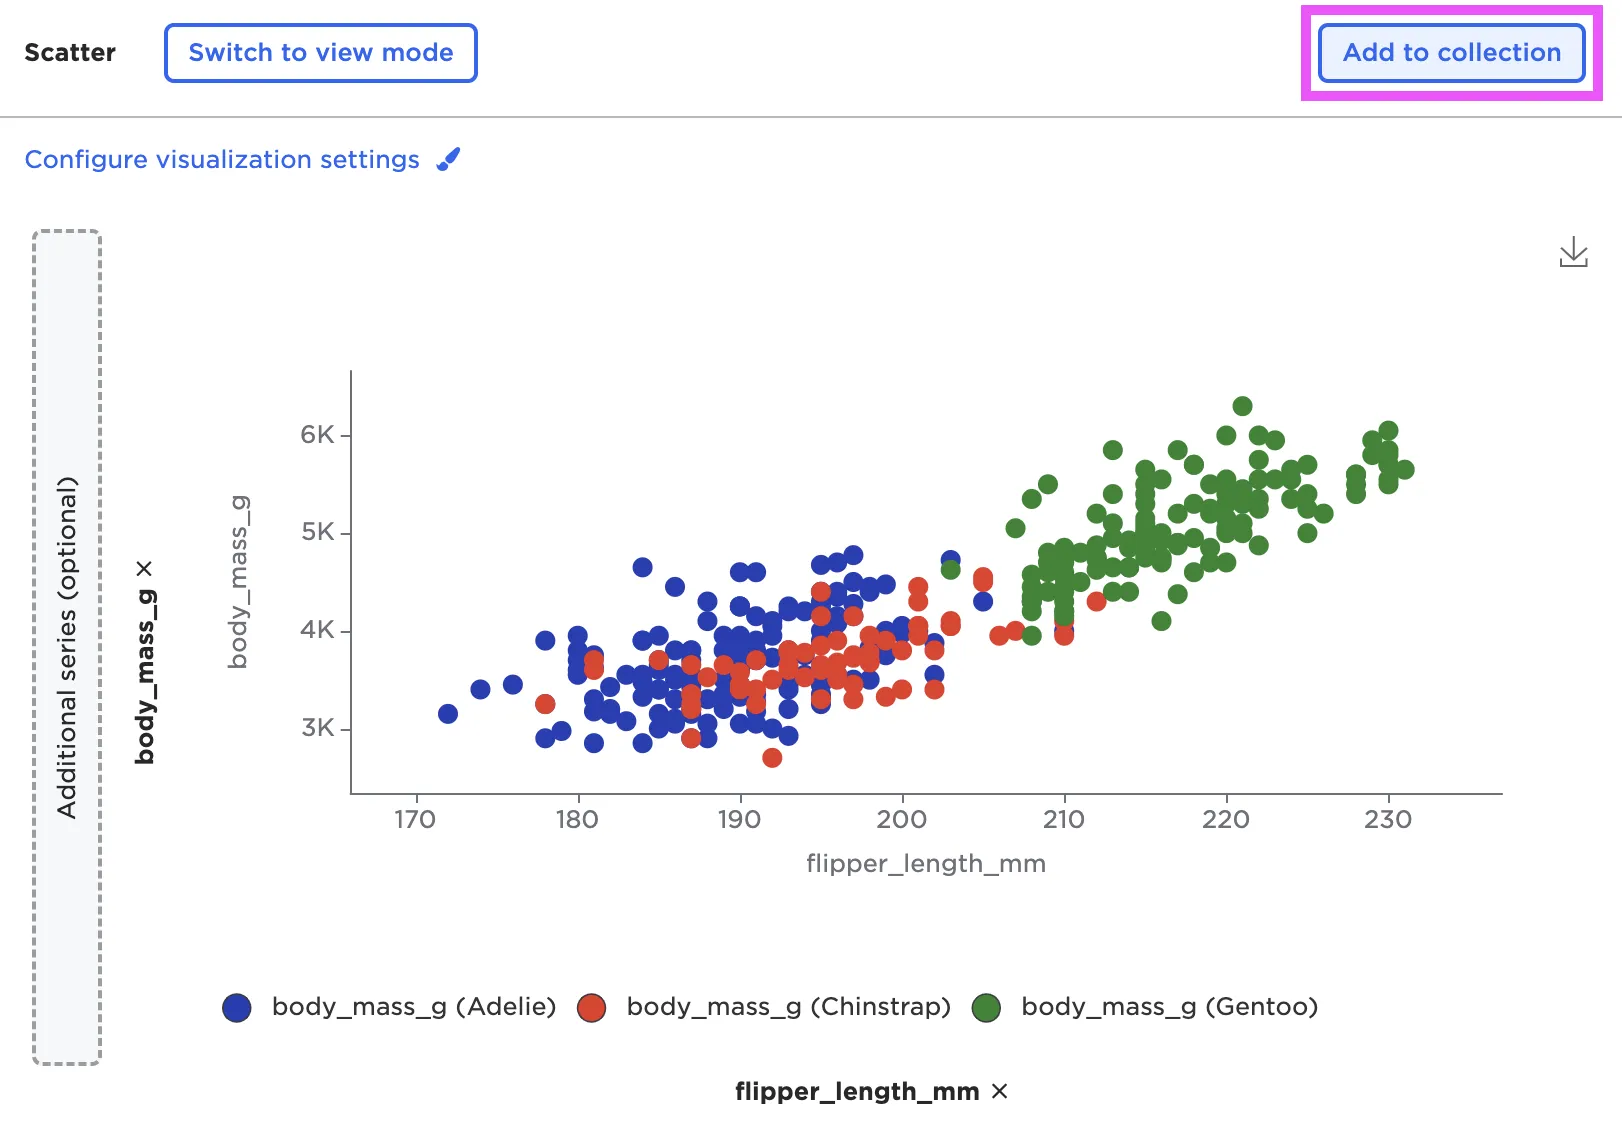
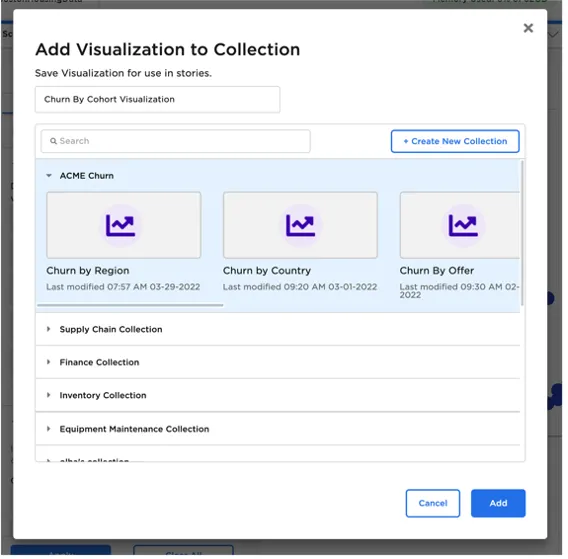
Figure 3: Publish image to collection
When creating or editing a visualization, drag visualizations "added to a collection" from the Visualizations Collection panel as depicted in Figure 4. Visualizations can be added from more than one collection to a story.
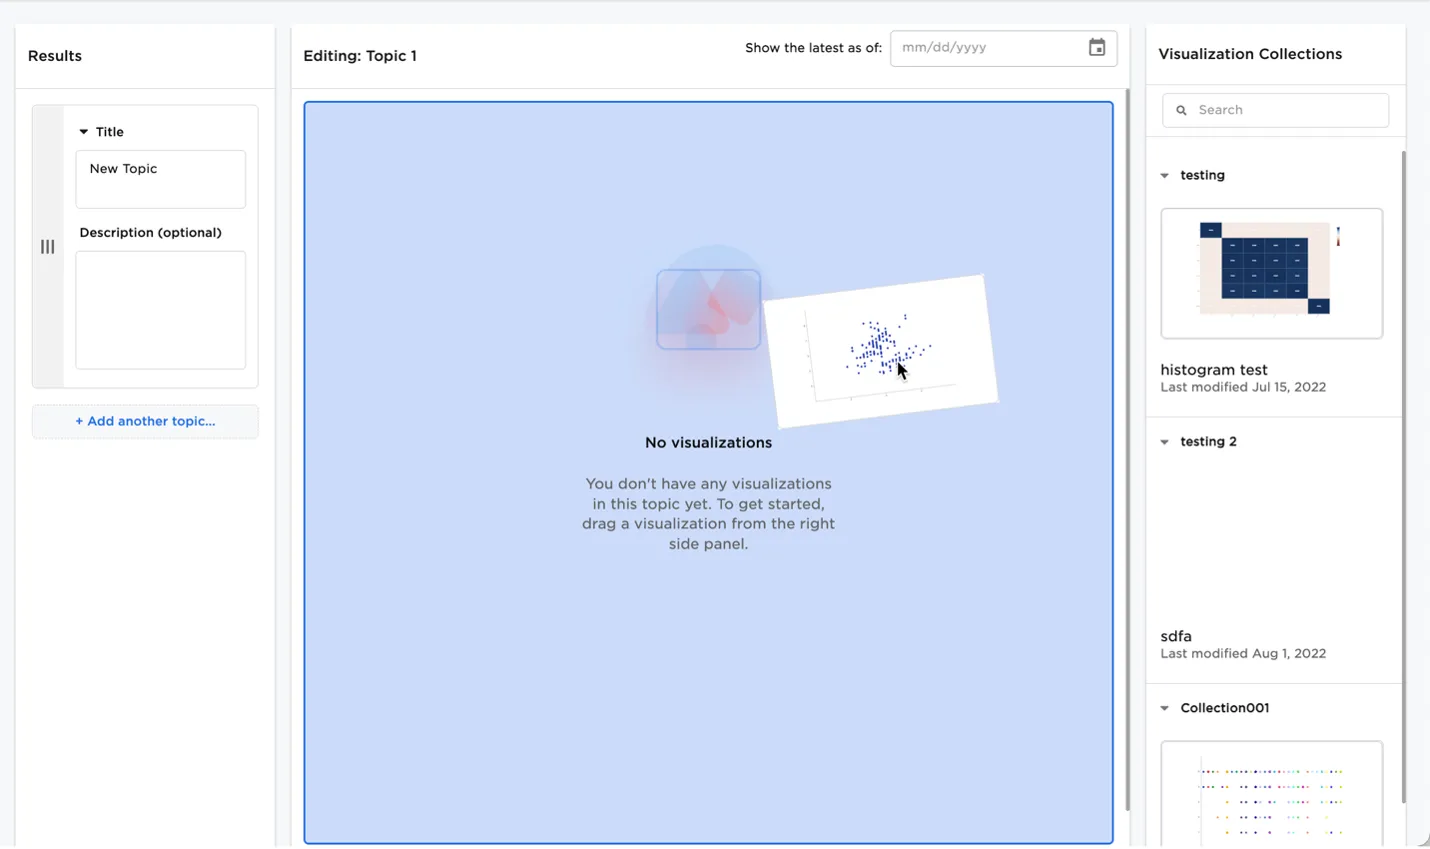
Figure 4: Add a visualization to a story
Datasets—Visual Notebooks Feature Store
Visual Notebooks supports a means of persisting a snapshot of a dataframe which can be versioned and shared across team members. This feature is analogous to a feature store whereby select team members are responsible for building visual notebooks to materialize data and features, while other team members are responsible for consuming features.
Behind the scenes, Visual Notebooks datasets leverage blob storage for cost effective storage of shared datasets.
Datasets can be created by using the Save Dataset node under the Cloud Storage node category.
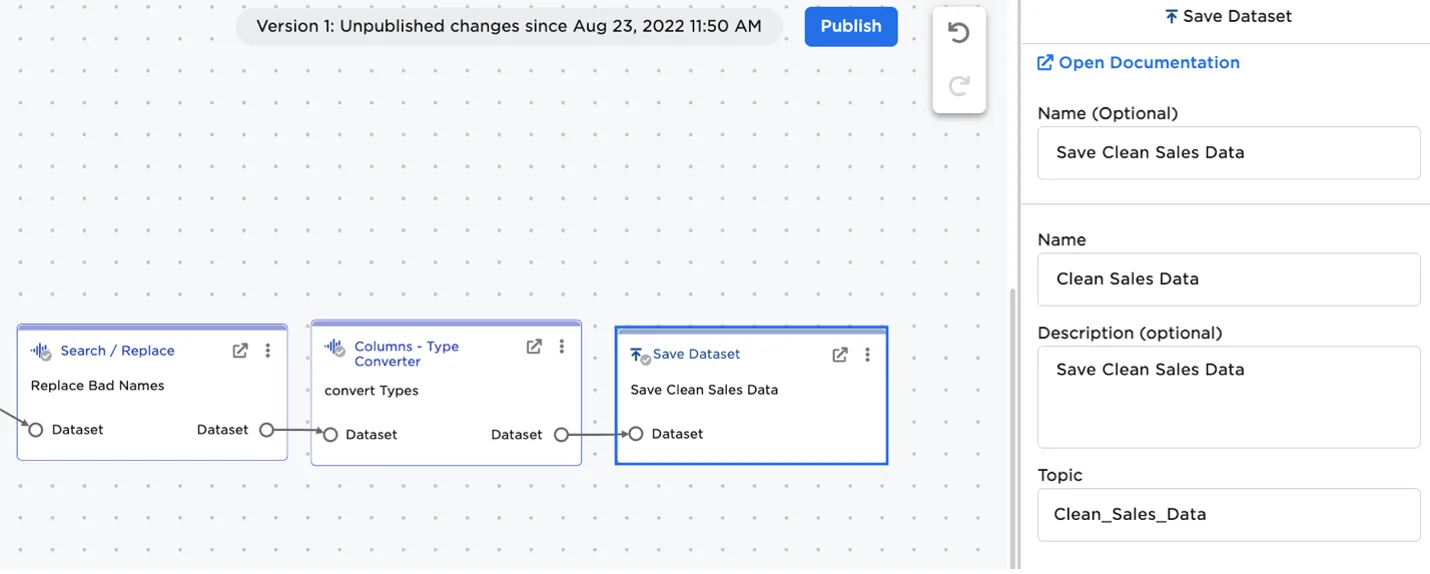
Figure 5: Save a dataframe as a versioned Visual Notebooks dataset
Filtering and Using Visual Notebooks Datasets
Visual Notebooks datasets are readily accessed by switching to Assets in the Visual Notebooks node menu and dragging the desired dataset onto the canvas.
Datasets can be filtered using the Search assets filter menu. You can toggle between datasets you "own," or created, and datasets that have been shared by colleagues.
Additionally, select datasets used as part of Visual Notebooks's training program are available under the Public toggle.
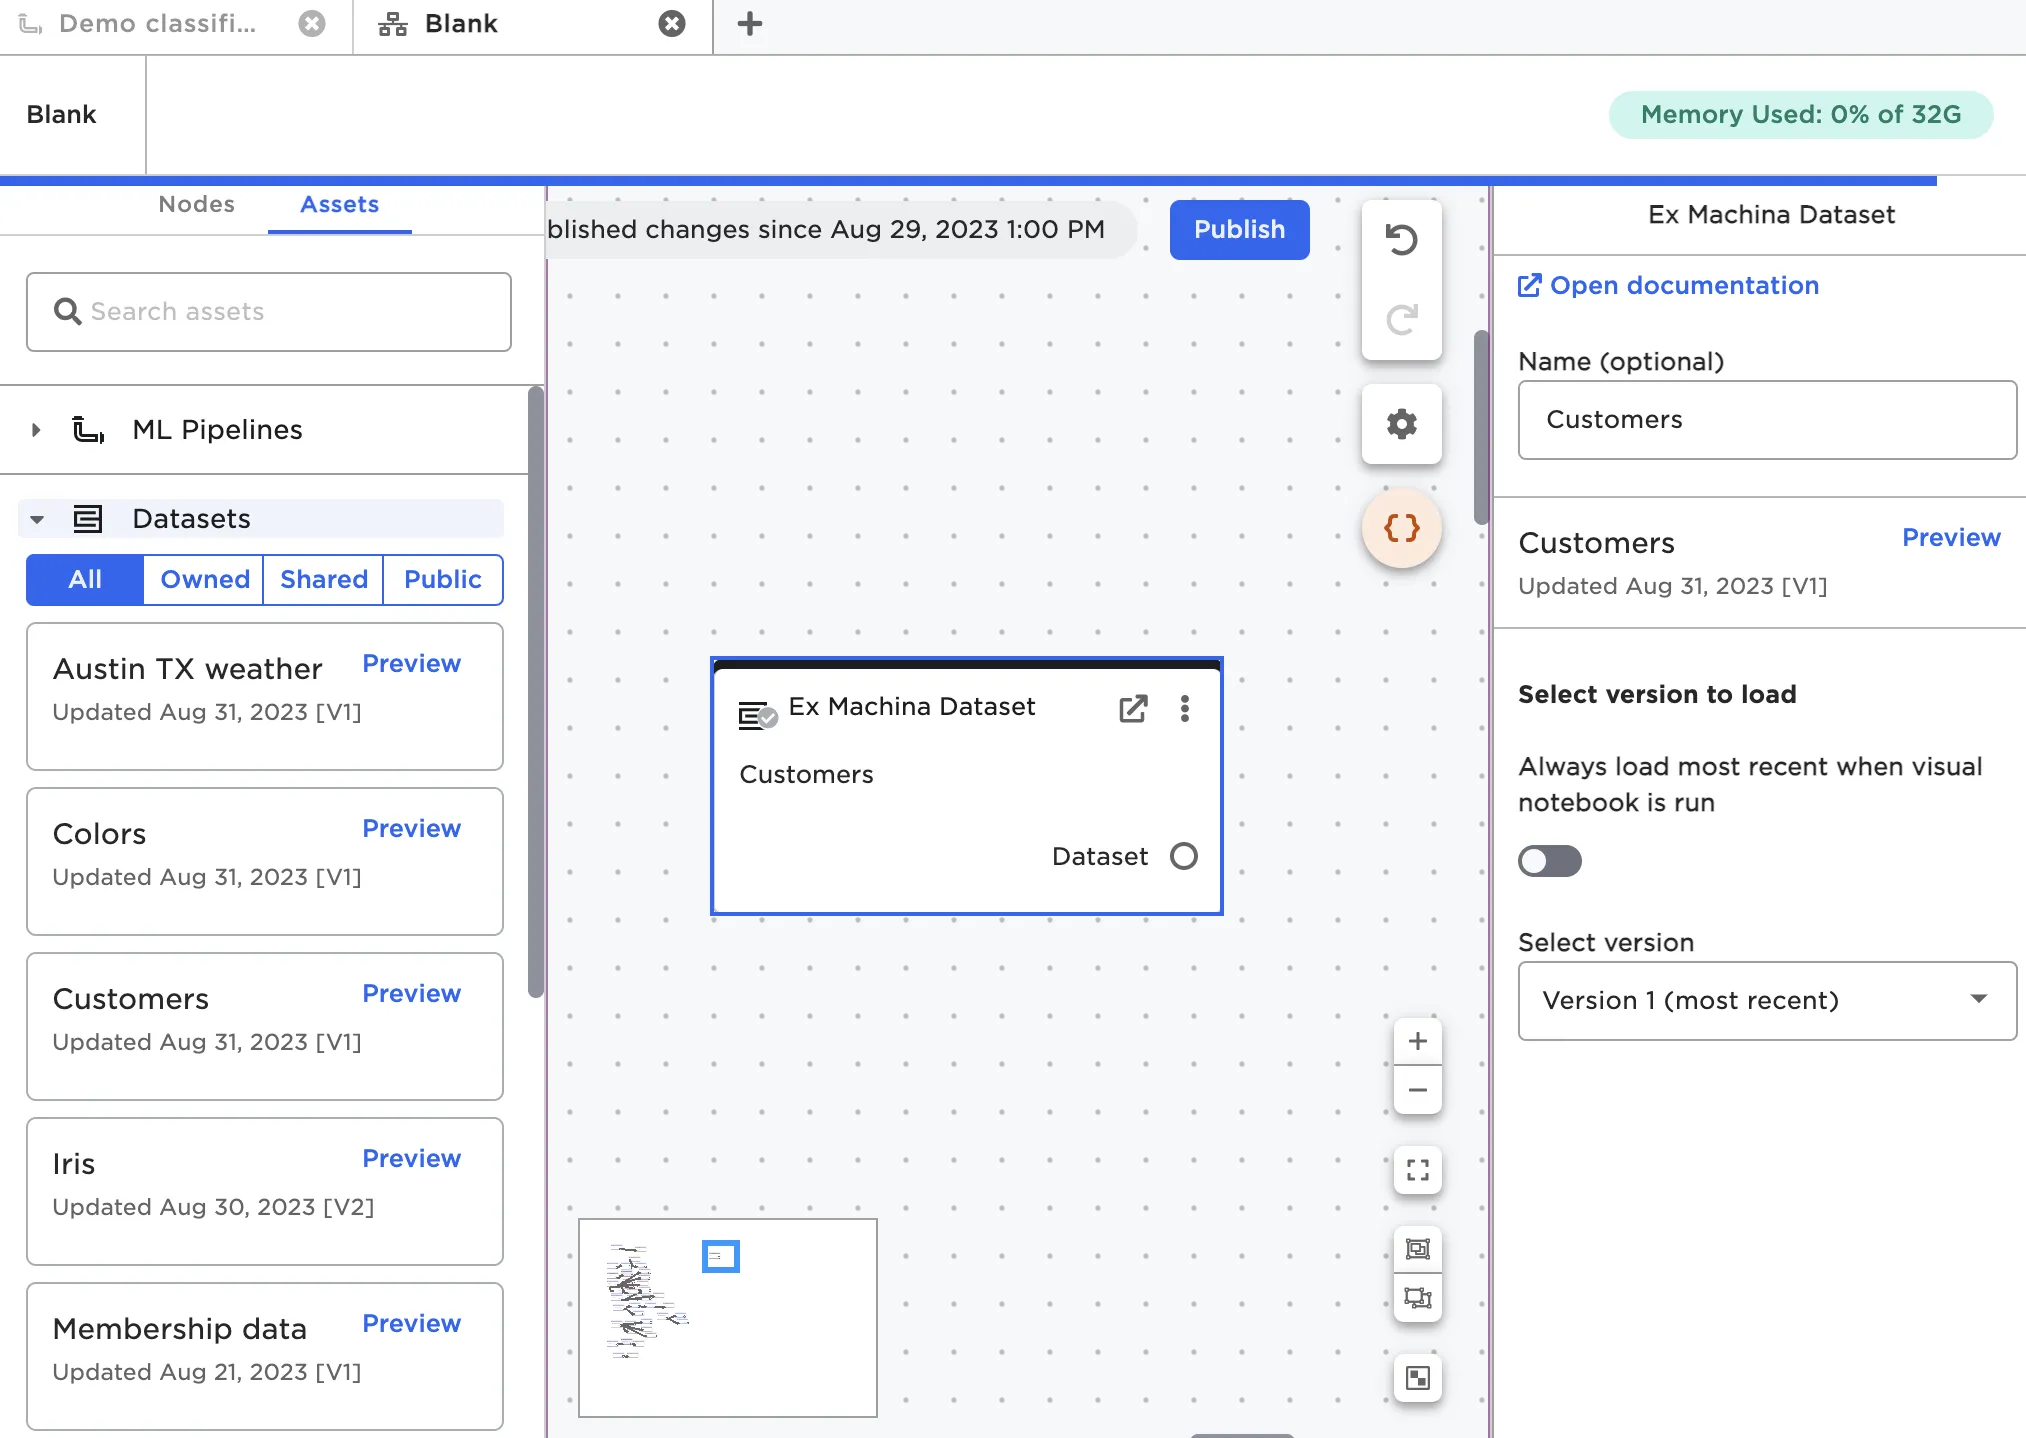
Figure 6: Accessing an Visual Notebooks dataset from the Assets tab