Timeseries - Resample and Interpolate
The Timeseries - Resample and Interpolate node in Visual Notebooks gives you the ability to resample (upsample and downsample) and align irregularly spaced data.
Resampling is a technique that allows you to define how granularly or generally you want the data to be.
- Upsample: Increase the frequency of the timestamps. For example, convert 5-minute data into 1-minute data and add new datapoints for the new time intervals. Upsampling expands the dataset.
- Downsample: Decrease the frequency like converting 5-minute data into 10-minute data by selecting how to treat existing datapoints (mean, sum, nearest value, etc). Downsampling condenses the dataset.
Interpolation is a method that generates missing values between points already present in a dataset. For example if your dataset has values for points at
1 pm,2 pm, and4 pmyou can create a new value for 3 pm by selecting an interpolation method.
Configuration
| Field | Description |
|---|---|
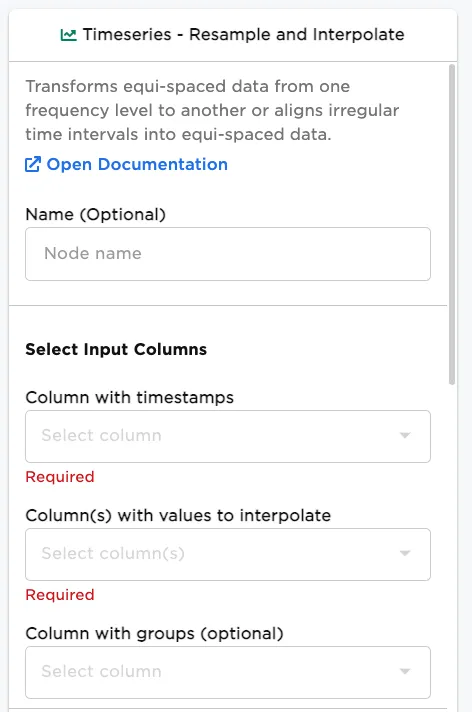
| Name | Name of the node A user-specified node name displayed in the workspace, both on the node and in the dataframe as a tab. |
| Column with timestamps | Timestamp column Select a column with timestamps from the dropdown menu. |
| Column(s) with values to interpolate | Column with missing values Select columns with values to interpolate in the dataset. |
| Column with groups (optional) | Column to group by If you would like to group the results, select the column to group by. |
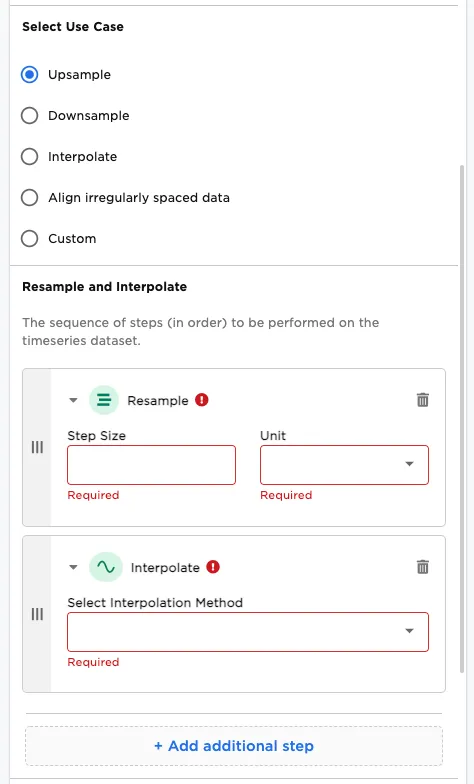
Select Use Case / Resample and Interpolate
| Field | Description |
|---|---|
| Upsample | Select upsample Select whether to upsample the dataset. Choosing Upsample updates the Resample and Interpolate section. Additional selections are: Resample Step Size: The selection should be a numeric whole number > 0.Unit: The available selection spans from Years to Nanoseconds:Years``Semi-annual``Quarters``Months``Weeks``Business days``Days``Hours``Minutes``Seconds``Milliseconds``Microseconds``Nanoseconds Interpolate Select Interpolation Method. Available selections:Nearest value (rounding to the nearest value)Previous value (fill values with the previous value)Next value (fill values with the next value)Linear (create a linear progression of values)Quadratic (create a quadratic progression of values) |
| Downsample | Select downsample Select whether to downsample the dataset. Choosing Downsample updates the Resample and Interpolate section. Additional selections are: Resample (see Upsample for details)Aggregate. Select Aggregation Method. Available selections include:Sum``Average``Maximum``Minimum``First``Last``Count``Product``Standard Deviation``Variance``25% Percentile``75% Percentile |
| Interpolate | Select interpolate Select whether to interpolate the dataset. Choosing Interpolate updates the Resample and Interpolate section. Additional selections are:Interpolate****Select Interpolation Method. See details in Upsample. |
| Align irregularly spaced data | Select align irregularly spaced data Select whether to align irregularly spaced data in the dataset. Choosing Align irregularly spaced data updates the Resample and Interpolate section. Additional selections are:Resample: See details in Upsample.Aggregate: See details in Downsample.Interpolate: See details in Upsample. |
| Custom | Select custom methods Select whether to customize the methods applied in the dataset. Choosing Custom updates the Resample and Interpolate section to + Add additional step. Additional selections are:Aggregate: See details in Downsample.Resample: See details in Upsample.Interpolate: See details in Upsample. |
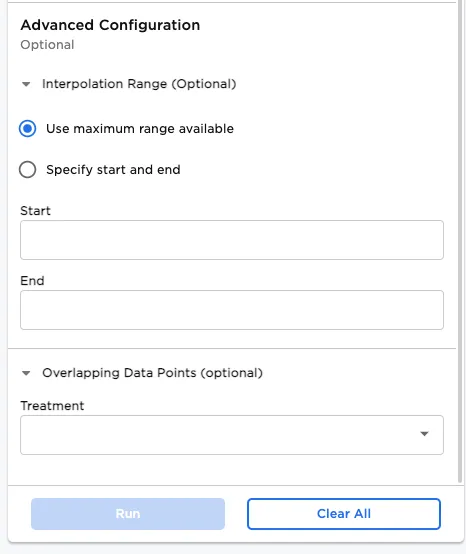
Advanced Configuration
| Field | Description |
|---|---|
| Interpolation Range (Optional) | Select time range Select whether to Use maximum range available, or to Specify start and end dates. |
| Overlapping Data Points (optional) | Select treatment of overlapping data points Select how to handle to duplicate timestamps. Available selections are:Average``Sum``Minimum``Maximum``Count |
Node Inputs/Outputs
| Input | A Visual Notebooks dataframe |
|---|---|
| Output | A dataframe with resampled and/or interpolated data |
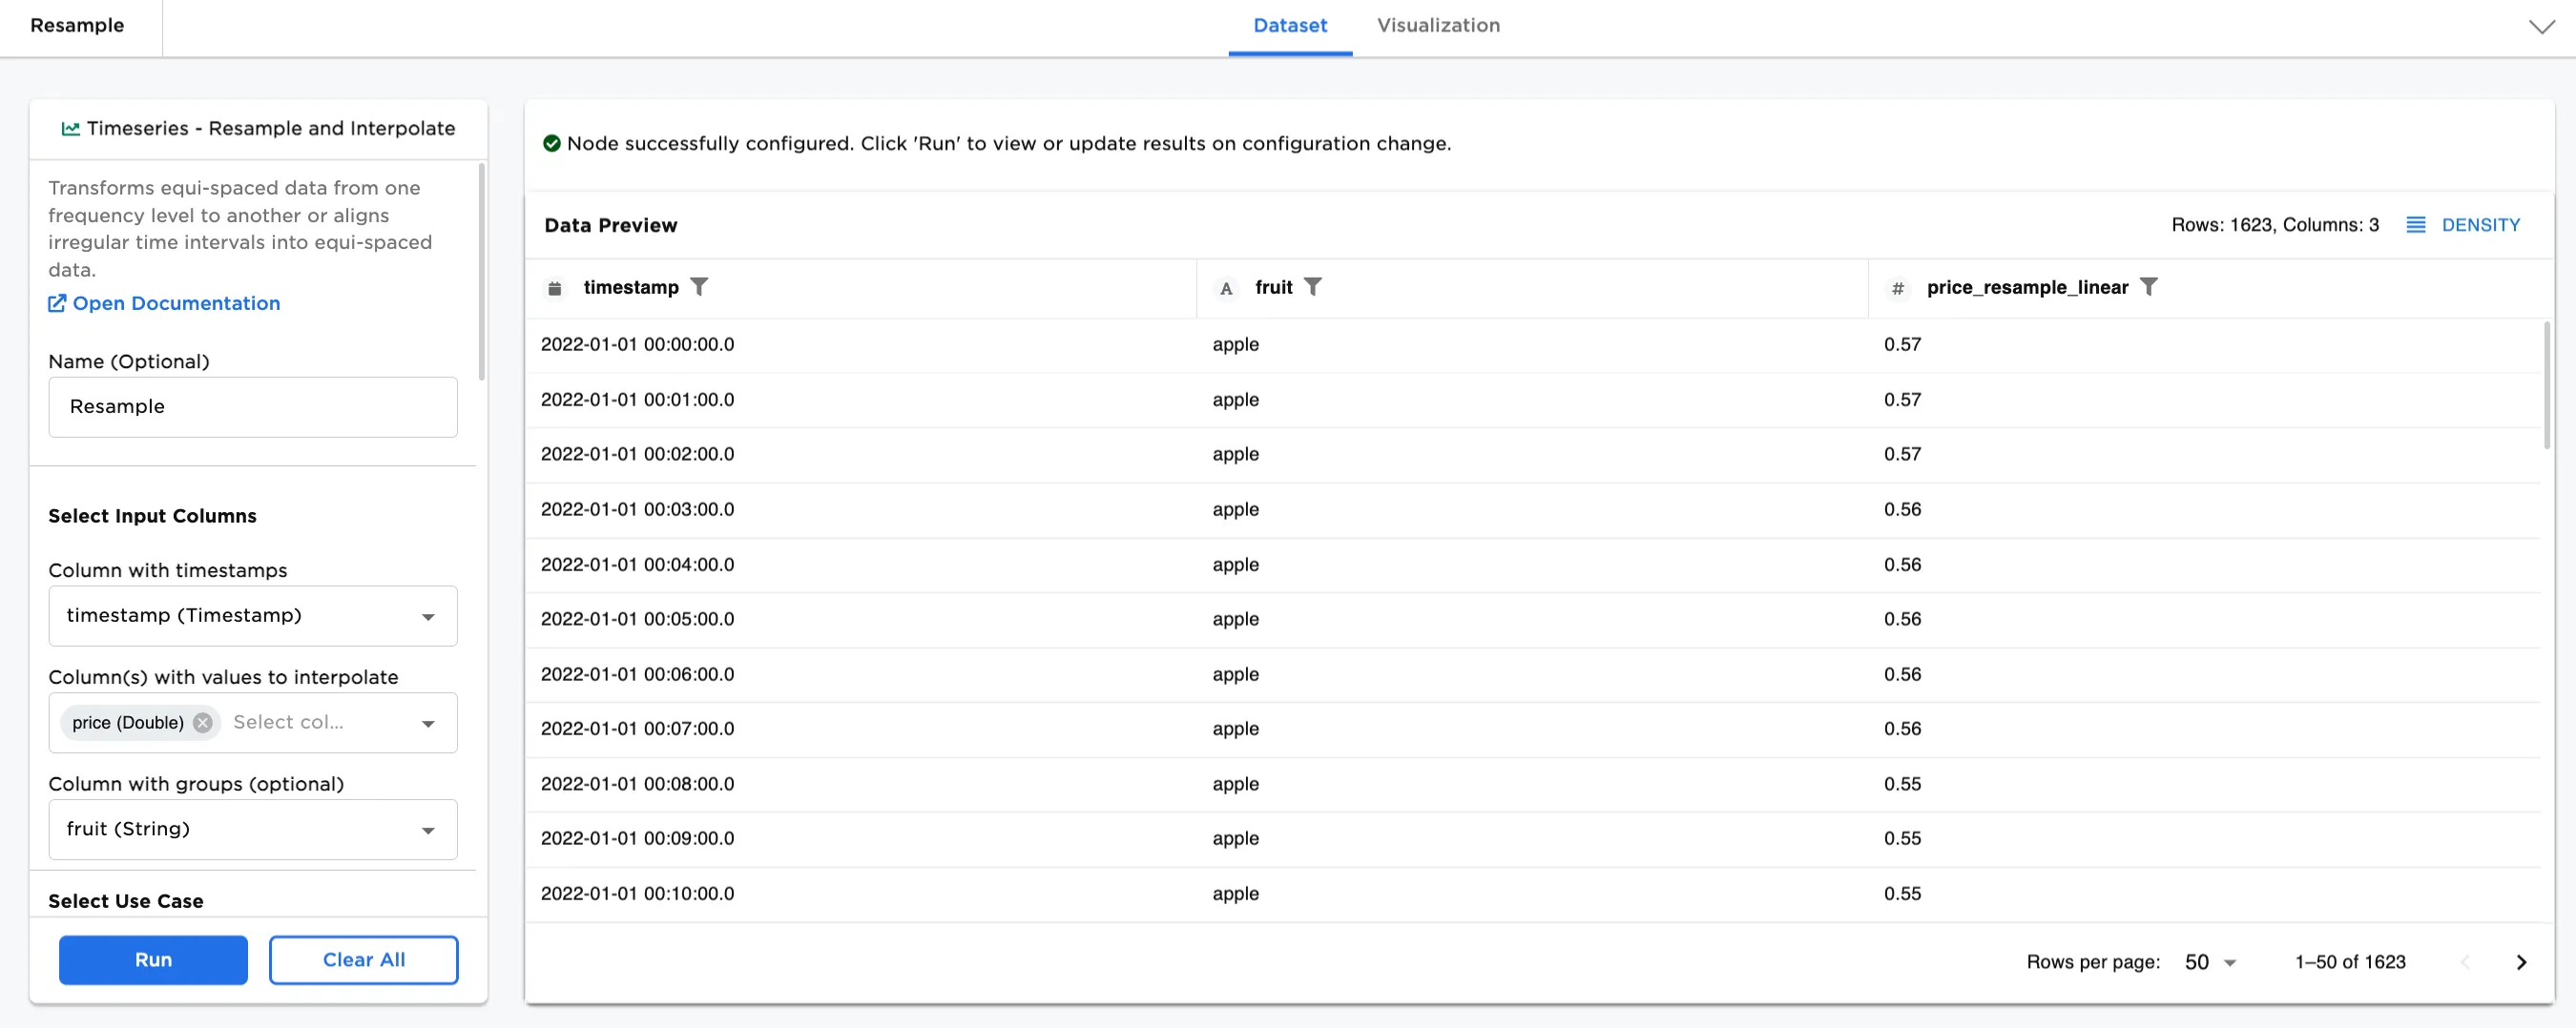
Figure 1: Example output
Examples
In machine learning, at times we have datasets are too granular or too broad, or that have missing values for periods of time. The datasets can be augmented to accommodate your needs by expanding (upsampling) or condensing (downsampling) the time frame, or filling in missing values (interpolation). In our example, we have a dataset that includes 30 rows of hourly prices for apples, oranges, and bananas from midnight to 9:00am on the same day (January 1, 2022).
Note:
- There are many different configurations and selections in this node. Our purpose is to share a sample of configurations to introduce you to how to use this node for upsampling, downsampling, and interpolation.
- The timestamp column should be formatted as: mm/dd/yyyy*hh:mm:ss
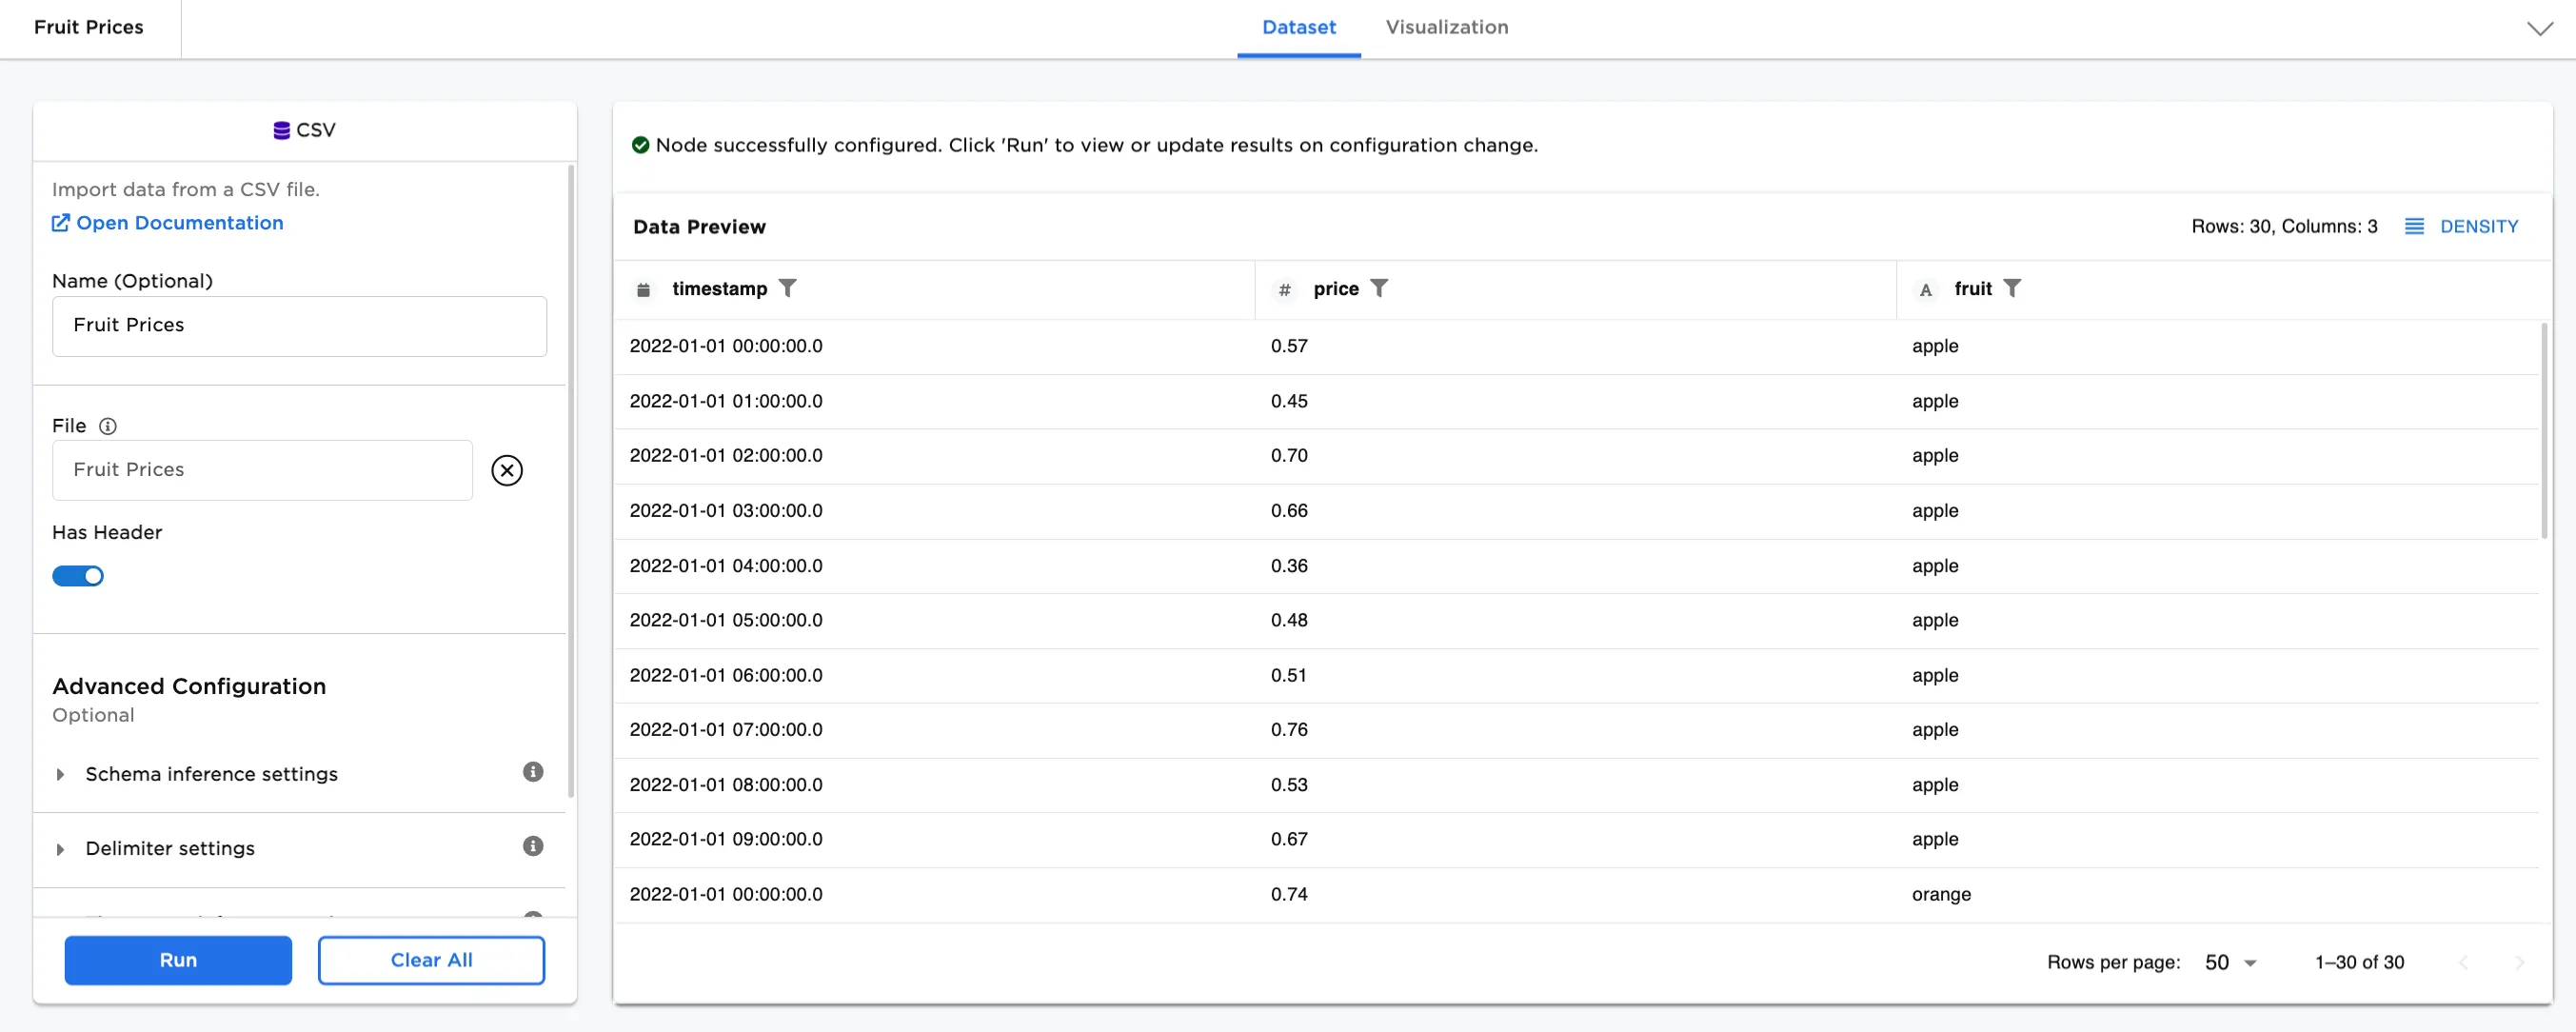
Figure 2: Example input data
First, let's try upsampling.
- Connect a Timeseries - Resample and Interpolate node to an existing node. In this case, it is connected to a CSV node with the
Fruit Pricesfile. - Optionally, name the Timeseries - Resample and Interpolate node. In the example, the node is named,
Resample. - Select the input columns:
- Column with Timestamps field. Figure 3 shows
timestamp (Timestamp)selected for this field. - Column with values to interpolate field. Figure 3 shows
price (Double)selected for this field.
- Select Upsample for the Select Use Case options. For the Resample and Interpolate options, select:
- Step Size:
1 - Unit:
Minutes - Select Interpolation Method:
Linear
- Select Run
Notice:
- The original dataset in Figure 2 has 30 rows of data and Figure 3a now has 541 rows of data.
- The original timestamp column in Figure 2 is broken down by hour. The new timestamp column is broken down by minute.
- The price column is renamed in the dataset: price_resample_linear
- The interpolation method generates missing values between the points already present in the dataset to complete the upsampling.
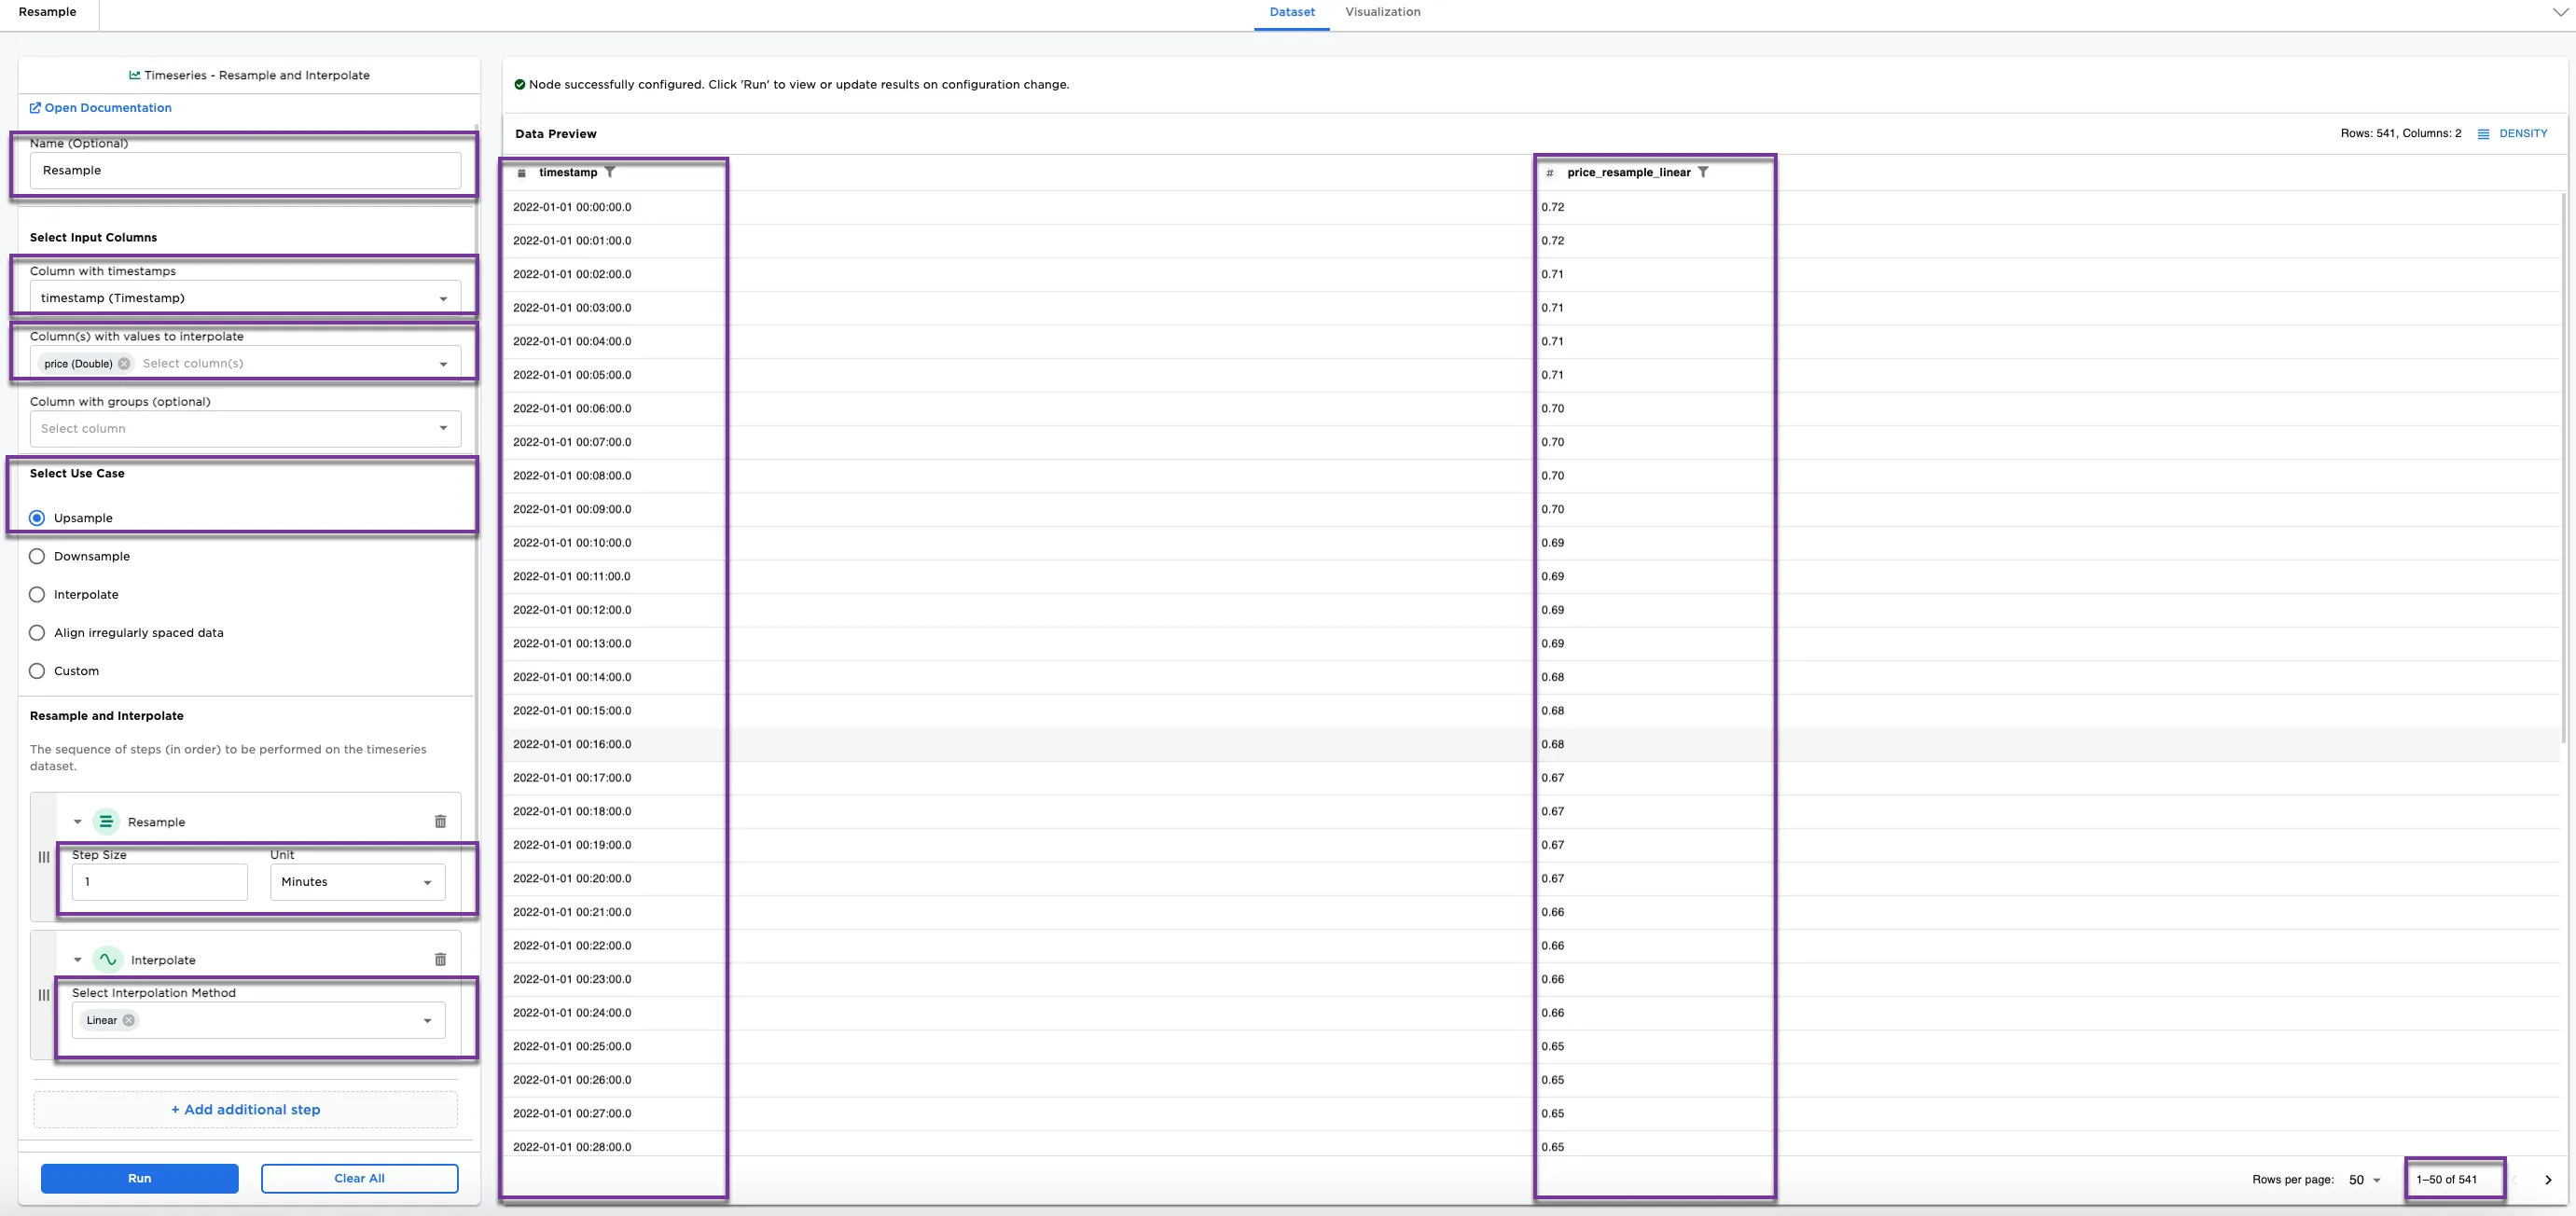 Figure 3a: Example of upsampling
- Optionally, select
fruit (String)in Column with groups (optional). - Add additional interpolation methods. Under Select Interpolation Method, select:
Linear,Quadratic, andNearest. - Select Run
Notice that Figure 3b groups the data by fruit type (apple, orange, and banana), which makes 1623 rows and adds a column called fruit, and there are two additional price columns in the dataset: price_resample_quadratic and price_resample_nearest.
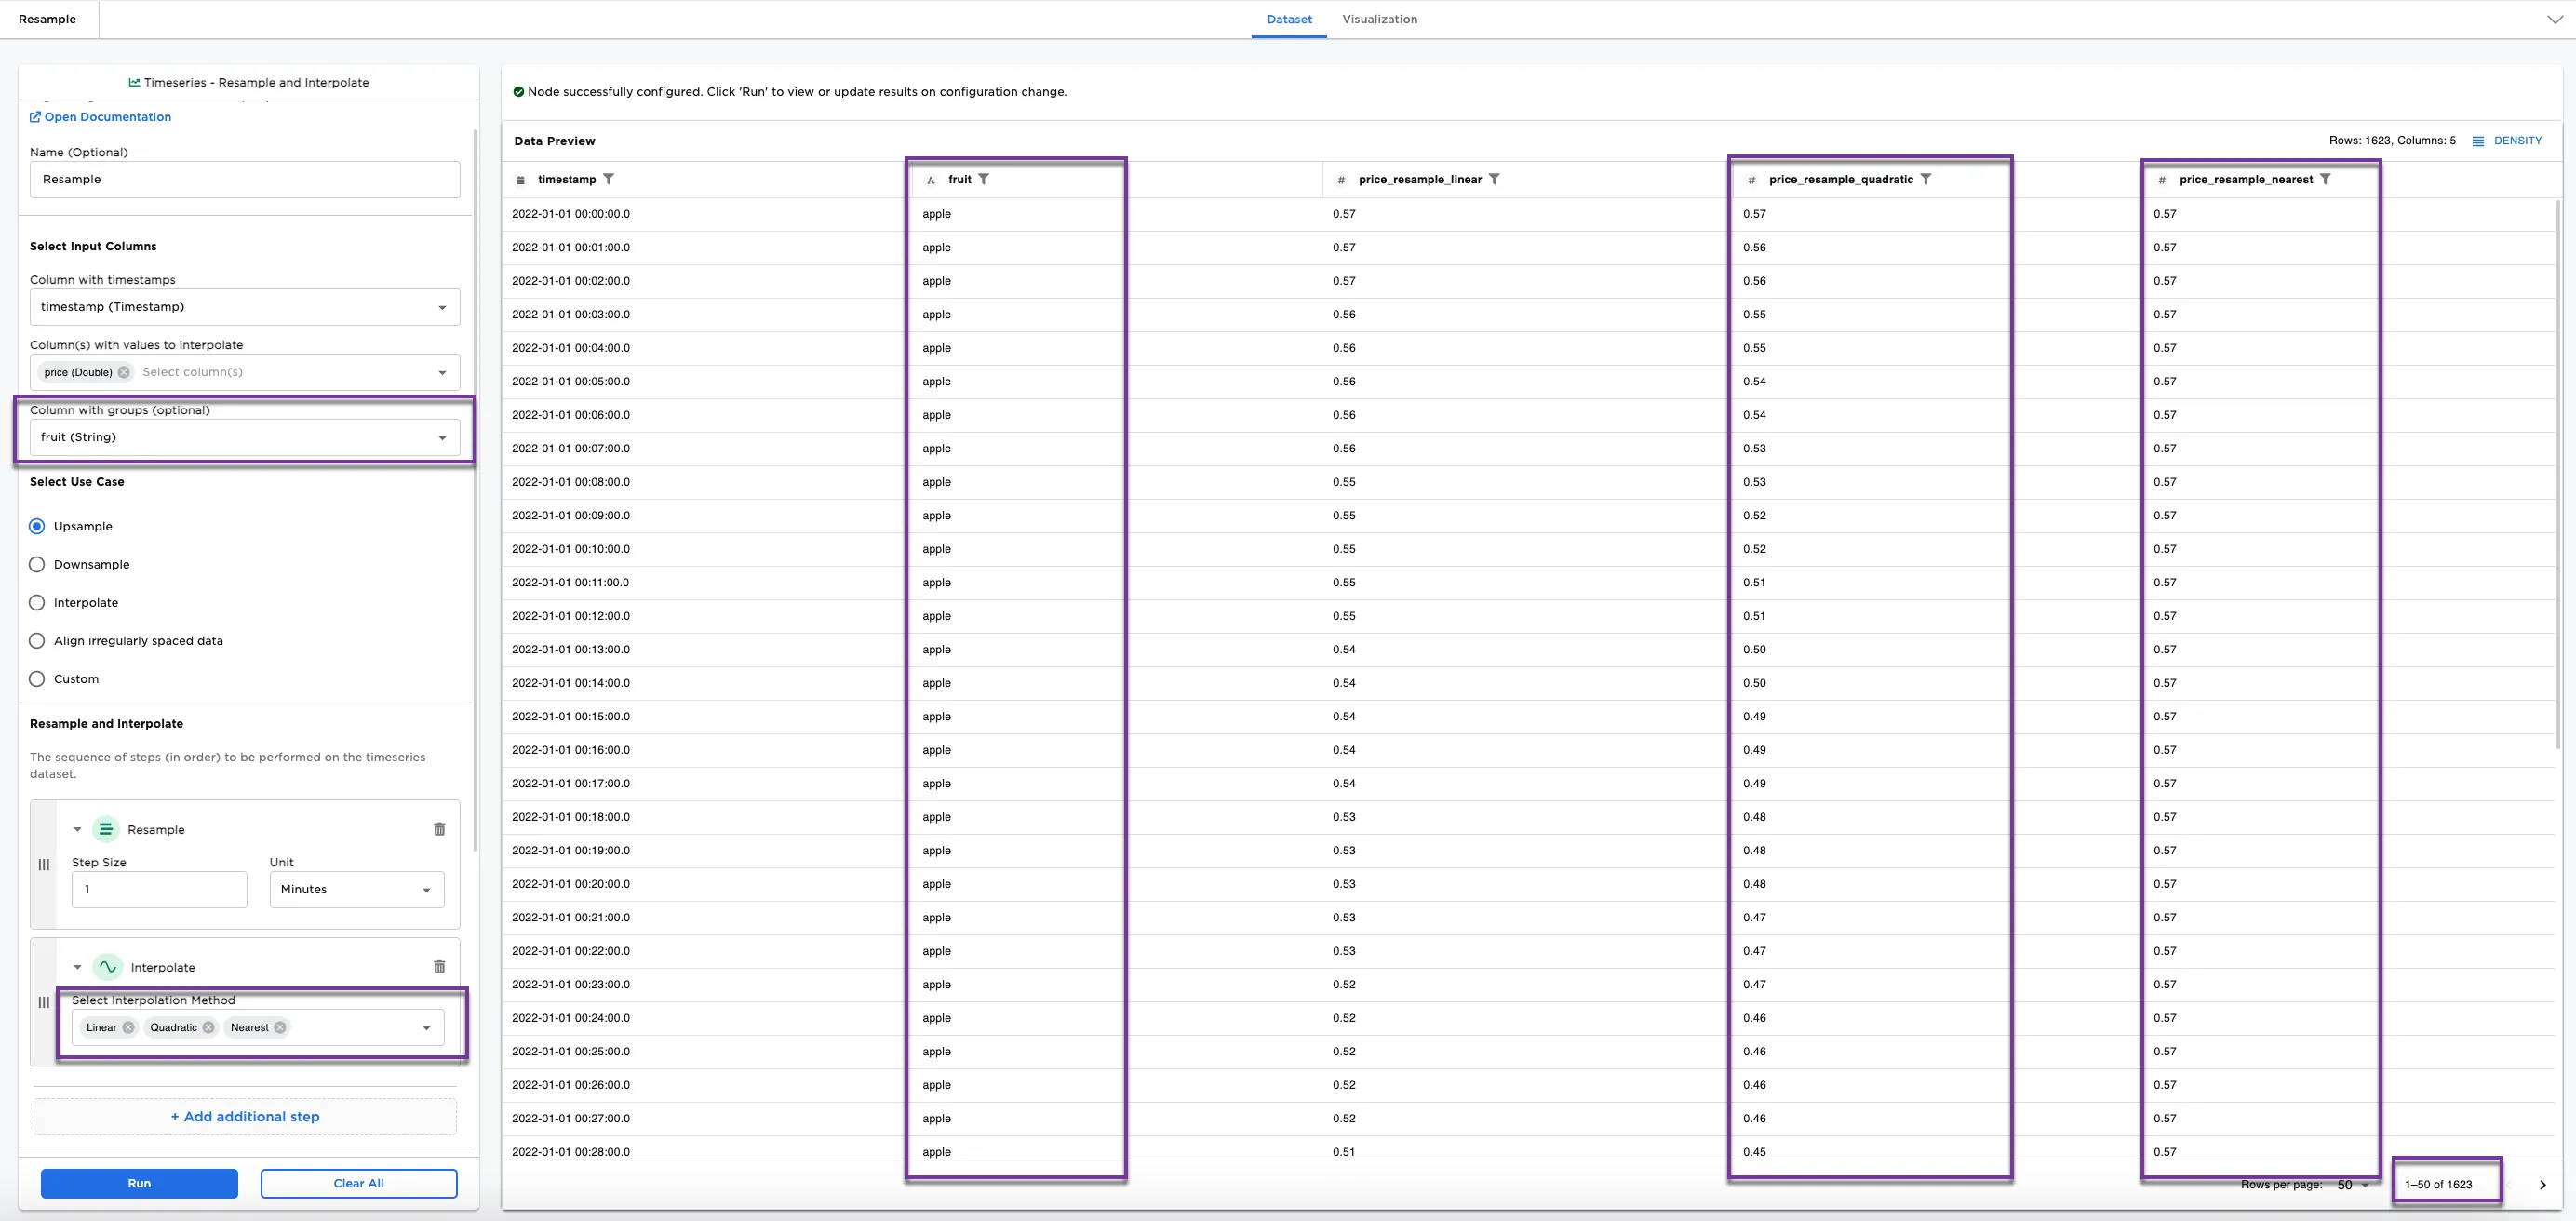 Figure 3b: Example of upsampling with group by and additional interpolation methods
Next, we explore downsampling. Here, instead of interpolating (filling in missing values), we condense the datapoints using an aggregation method. Make the following selection changes to try downsampling the dataset.
- Select Use Case:
Downsample - Resample and Interpolate:
- Keep Step Size as
1, and change Unit toDay - For Select Aggregation Method, choose
Average
- Keep Step Size as
- Select Run
Figure 4 shows the original 30 rows from Figure 2 condensed to 3 rows, downsampling the data to the average price of each fruit by the one day in the dataset (if there were multiple days in the dataset, the results would show the average prices each day for each fruit).
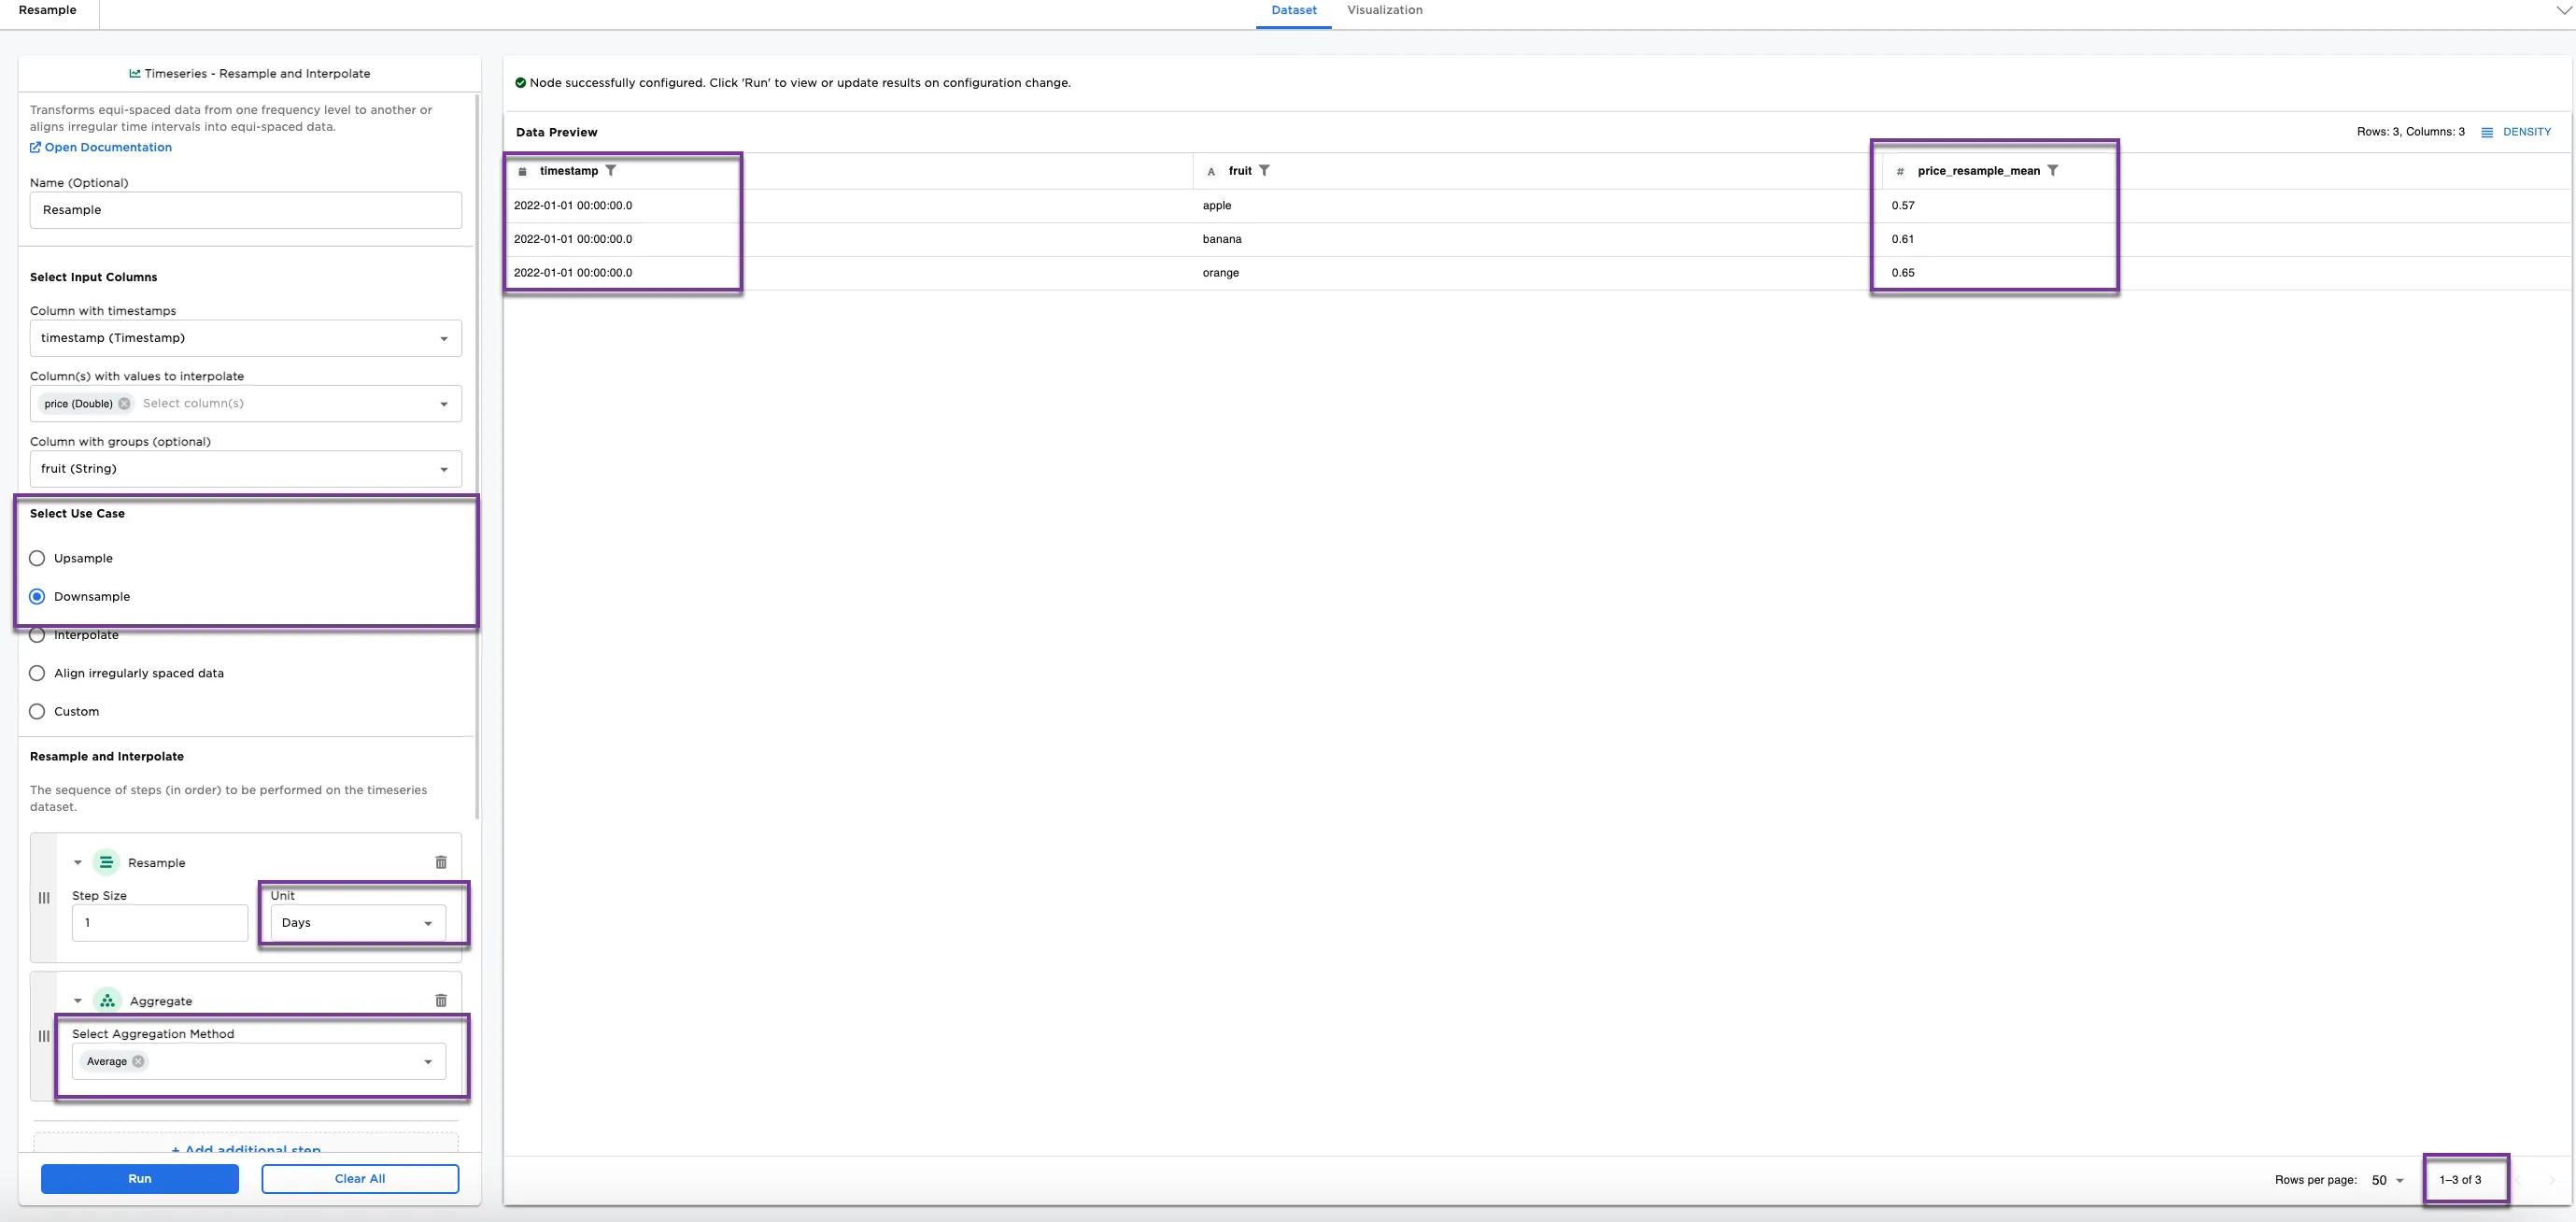 Figure 4: Example of downsampling
Next, we explore interpolation. Notice in Figure 3, we see an example of upsampling the data. One of the options for upsampling is interpolation, which is filling in missing values. Another option is to use use Interpolate on its own. For this example a dataset that contains timestamps with missing prices is used.
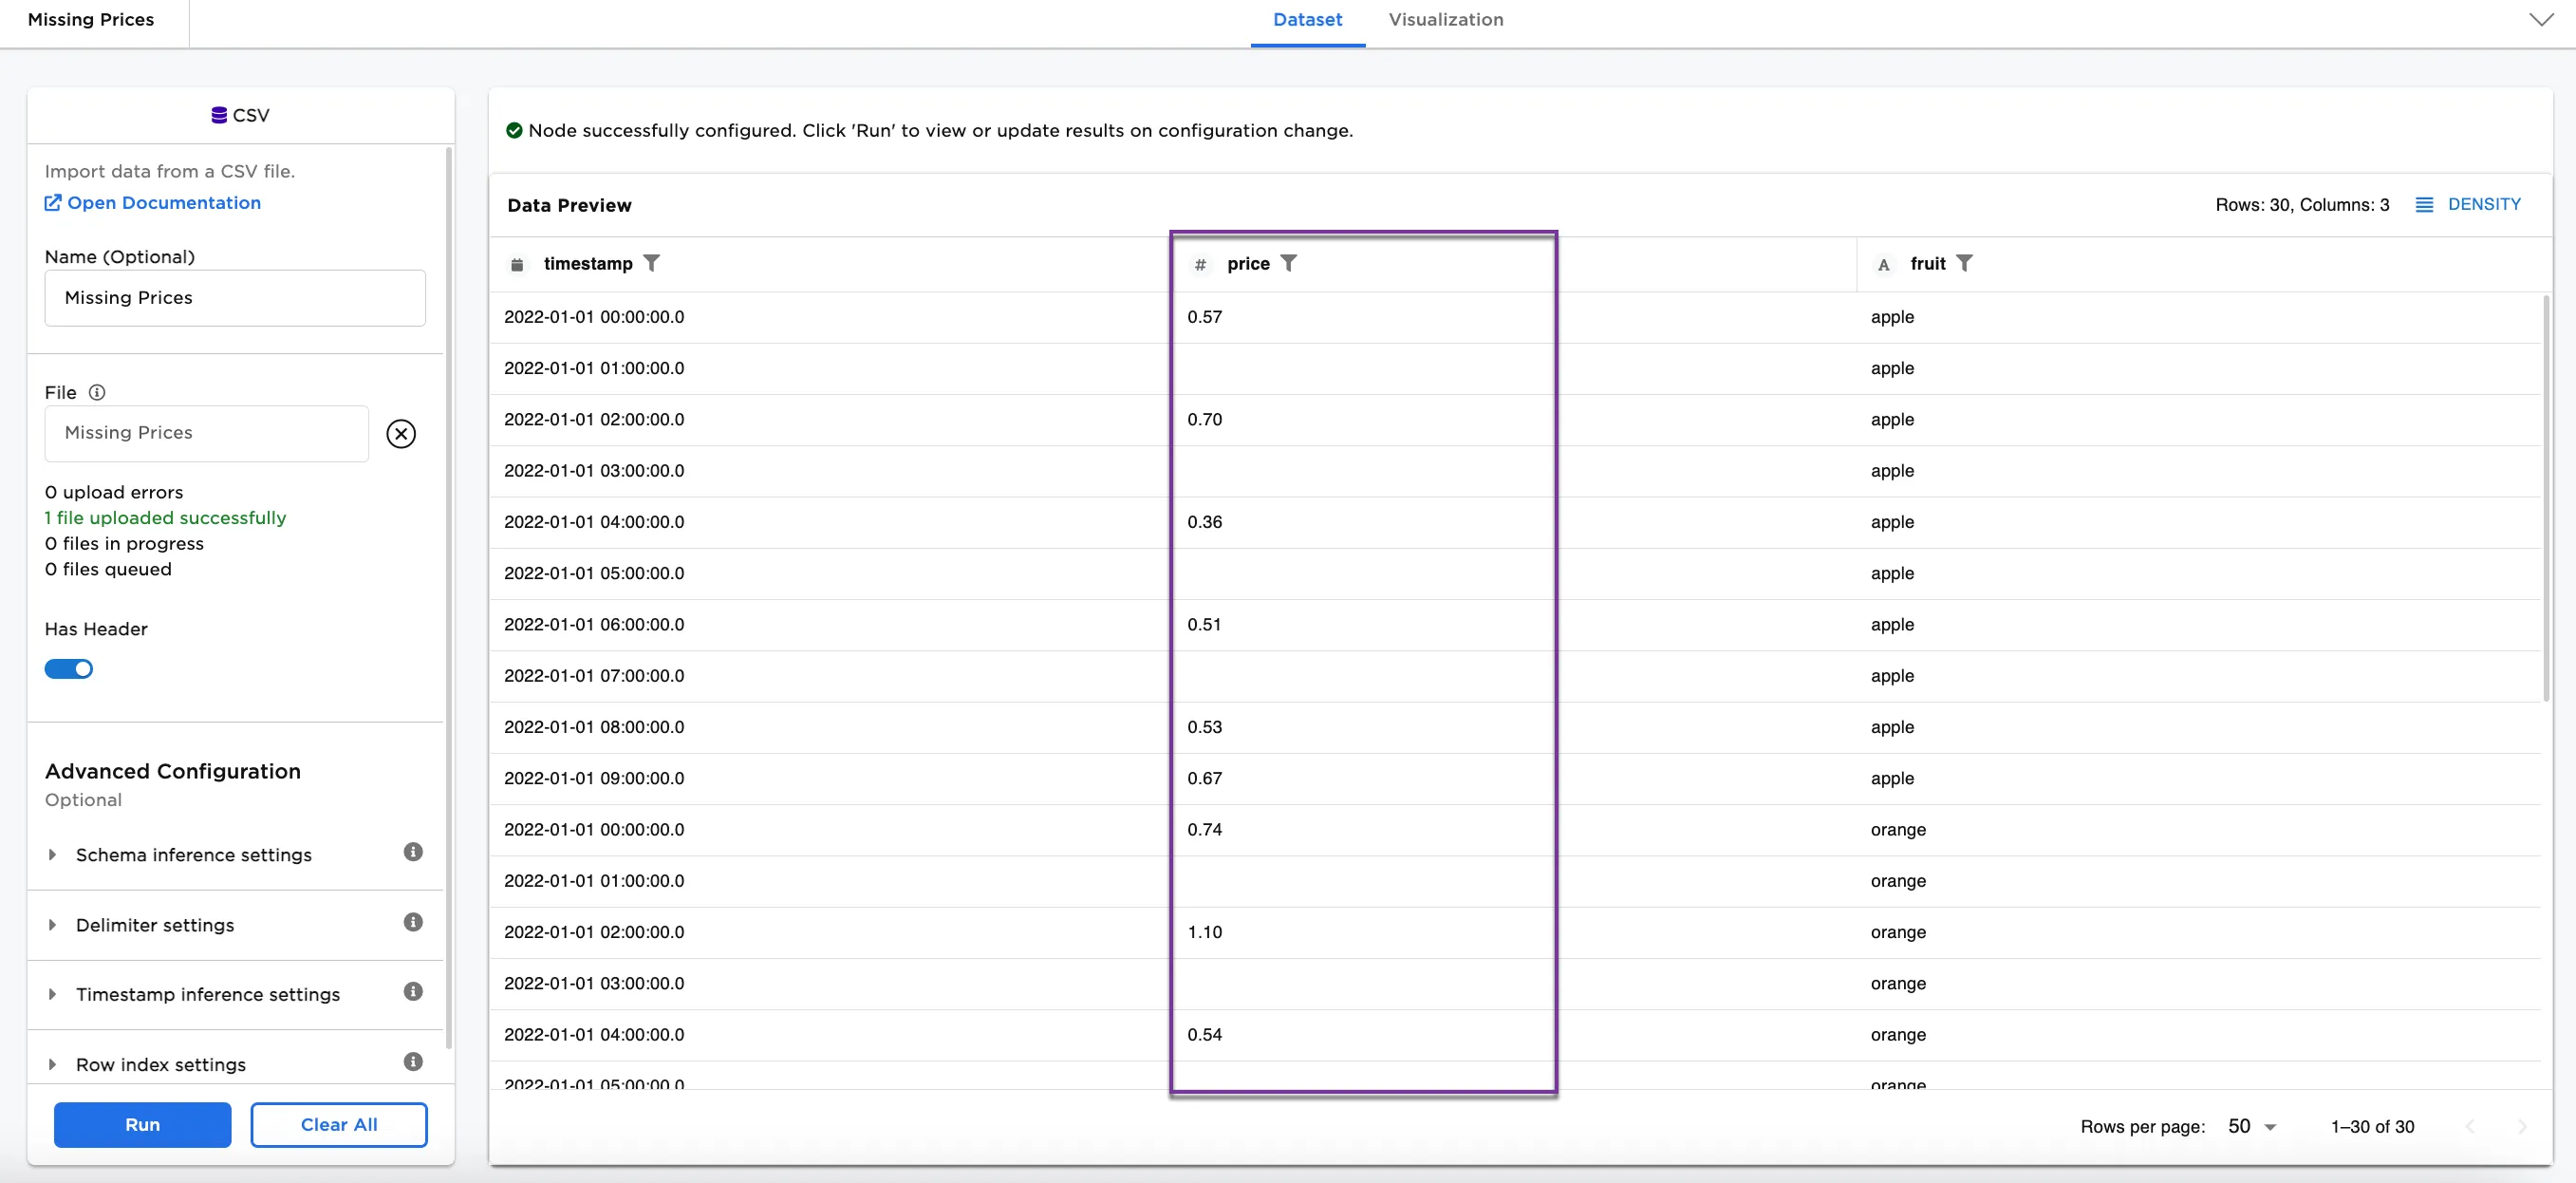 Figure 5: Example input with missing prices
- Select Interpolate for the Select Use Case options.
- For the Resample and Interpolate options, select all of the following under Select Interpolation Method:
Linear,Quadratic,Next,Previous, andNearest. - Select Run
Notice that there are five price columns appended with each interpolation method. The different interpolation methods are filling in values for the missing data at 01:00:00.0, 03:00:00.0, 05:00:00.0, and 07:00:00.0 for apples, oranges, and bananas.
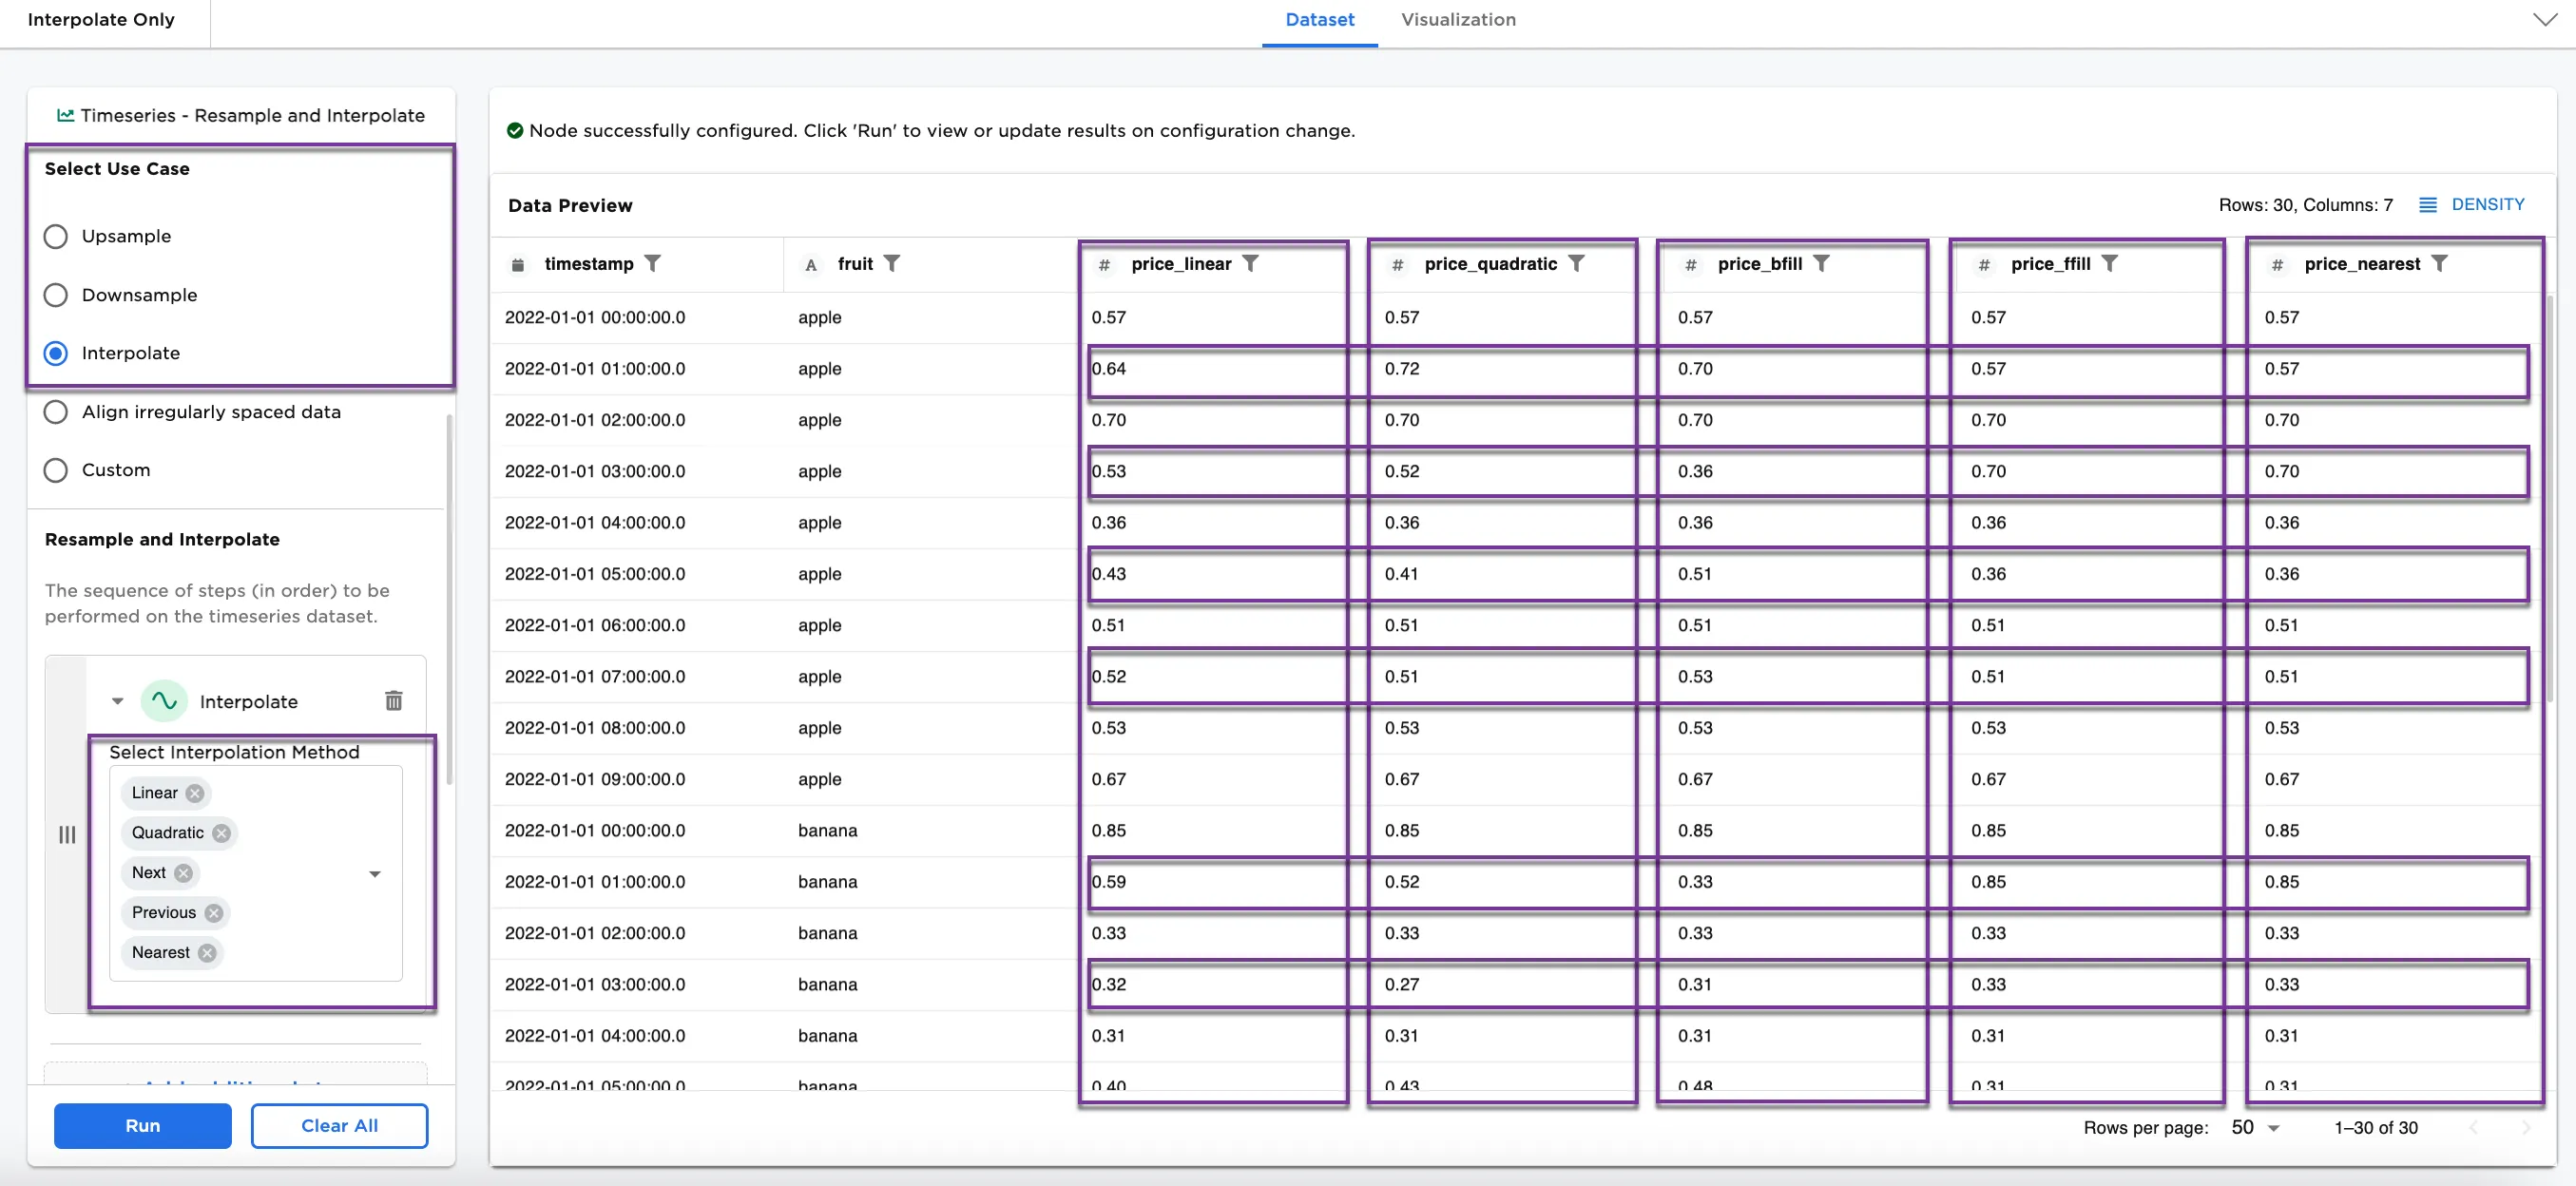 Figure 6: Example with interpolation