Timeseries and Sequence Split
The Timeseries and Sequence Split node in Visual Notebooks splits one timeseries dataset into two datasets that can be used for training and testing in machine learning.
Configuration

| Field | Description |
|---|---|
| Name | Field to name the node An optional user-specified node name displayed in the workspace, both on the node and in the dataframe as a tab. |
| Column with Timestamps or Sequence (x axis) | Select column(s) Select the column with the desired timestamp or sequence from the auto-populated dropdown menu. If all columns in the menu appear dimmed, use a Columns - Type Converter node to convert the desired column to the timestamp data type or a Columns - Sort and Index node to create an index. |
| Drop rows with missing values in the selected Timestamps or Sequence column | Handling rows with missing values Toggle on to drop rows with missing values, or leave off (default) to keep all rows. |
| Group by | Grouping selection Select whether to view the data in a single series or grouped by data in another column. |
| Select column to partition with | Column to group by If grouping by a column (Group data by column is selected in Group by), then select a column to partition the data. |
| Split Percentage | Select split percentage Select the percentage to split the dataset. The percentage chosen is for the First Dataset; the remainder is for the Second Dataset. Both datasets are a total of 100%, for example, 65/35, 70/30, 75/25, and so on. A smaller Split Percentage can be used as well, for example 30; however, it is recommended to have a larger First Dataset for training your model. |
Node Inputs/Outputs
| Input | A Visual Notebooks dataframe |
|---|---|
| Output | Two datasets: one for training and one for testing that can be used for machine learning |
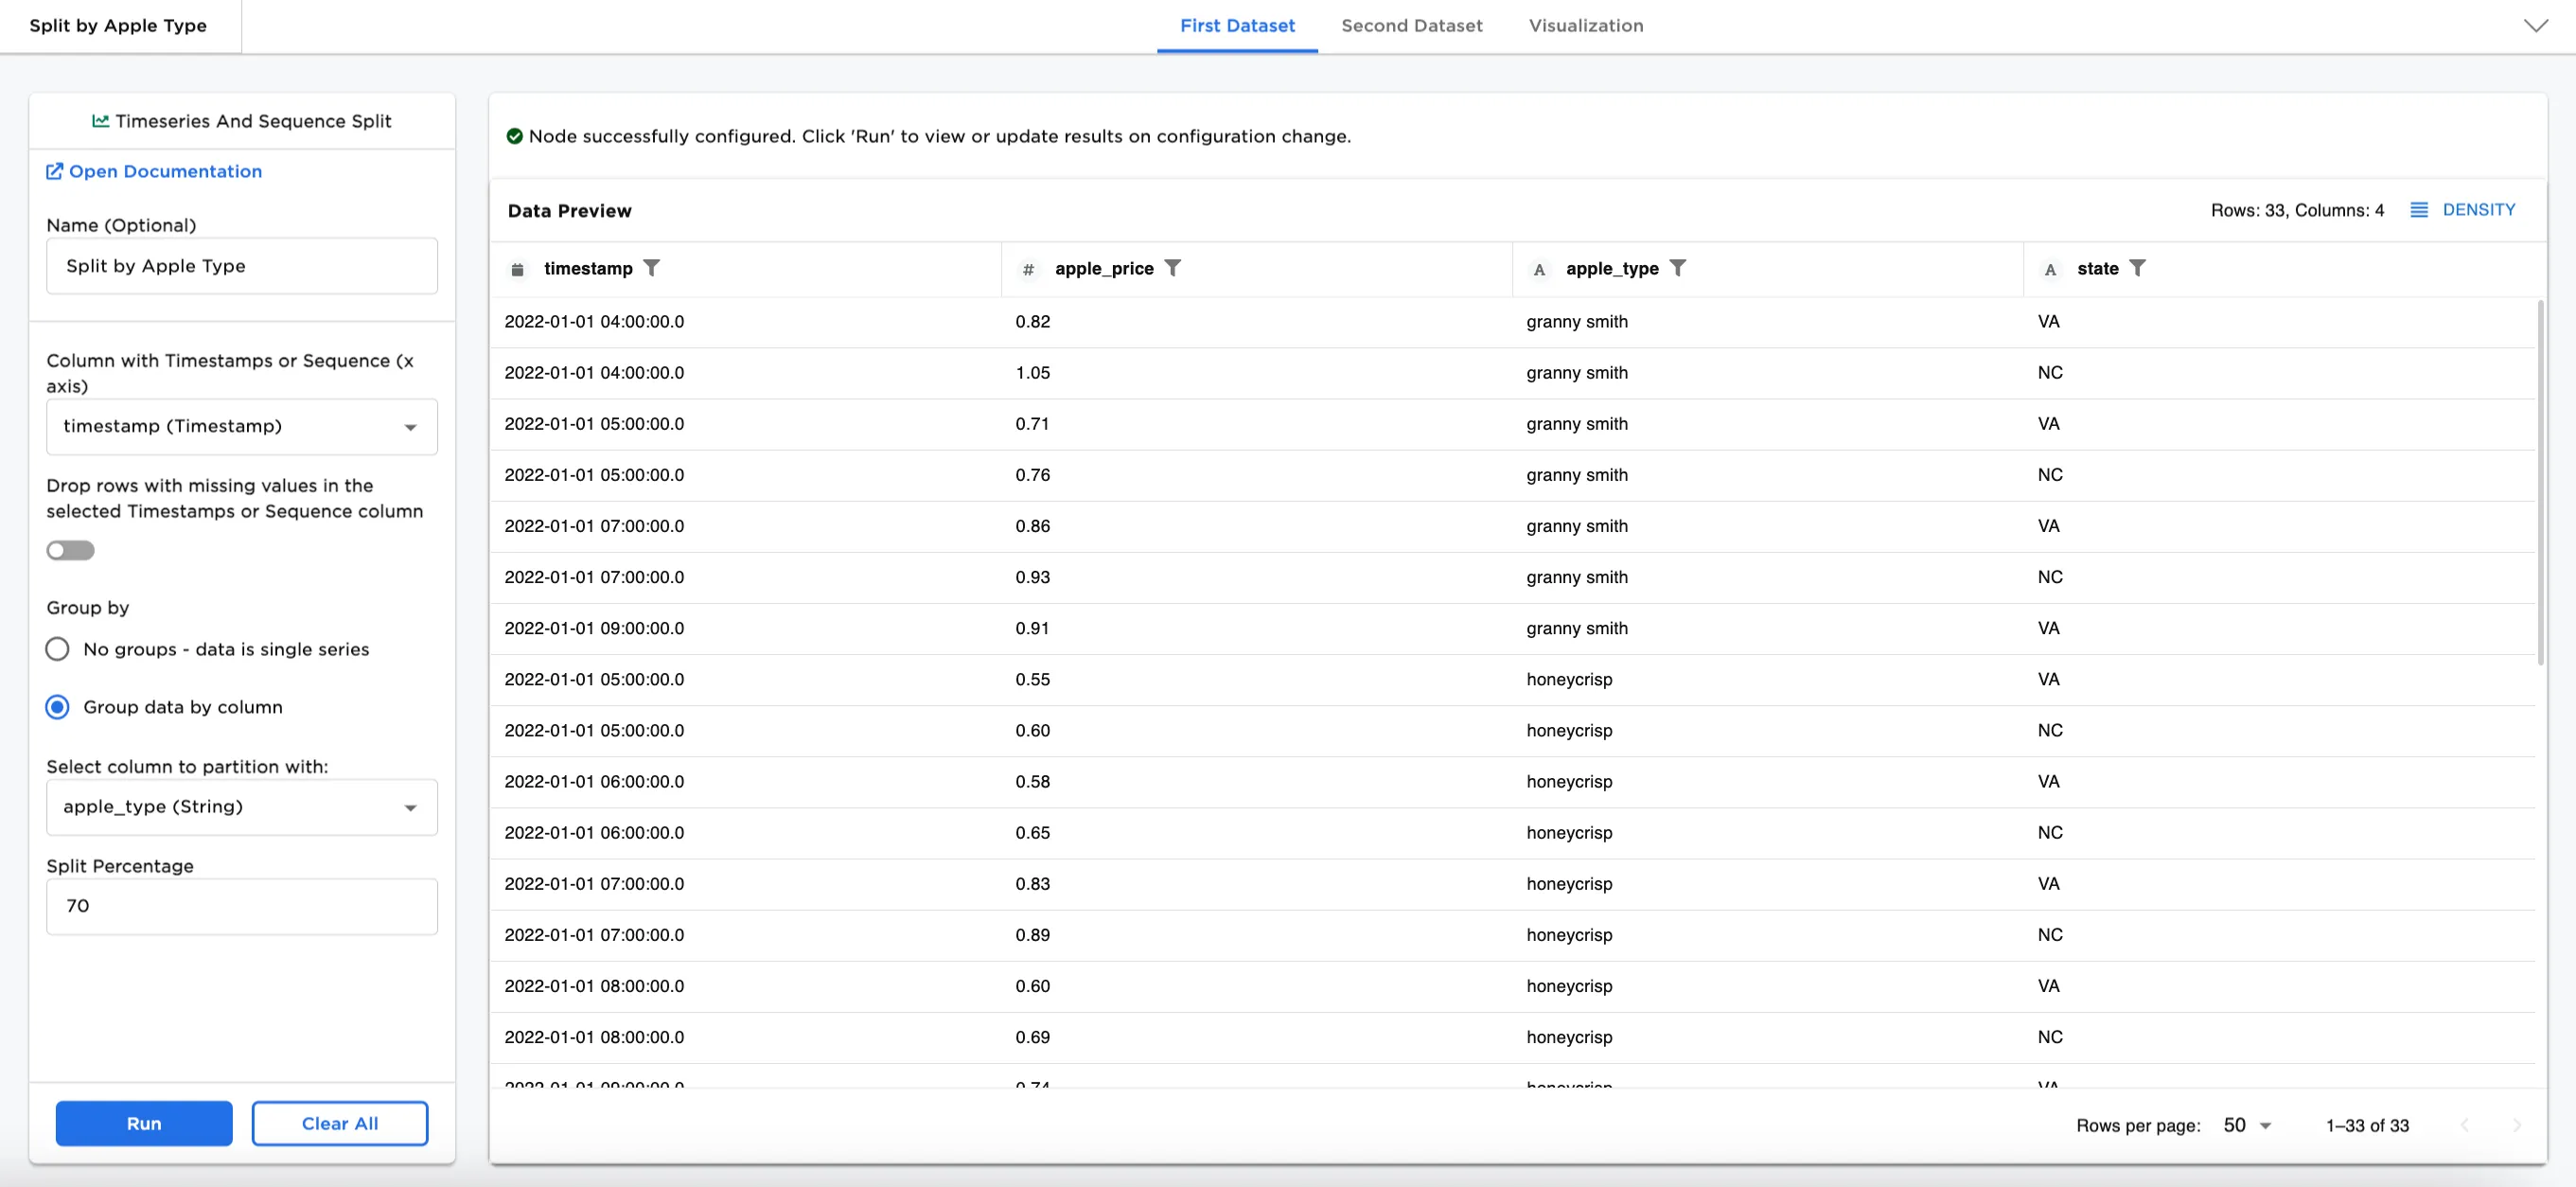 Figure 1a: Example dataframe output for First Dataset
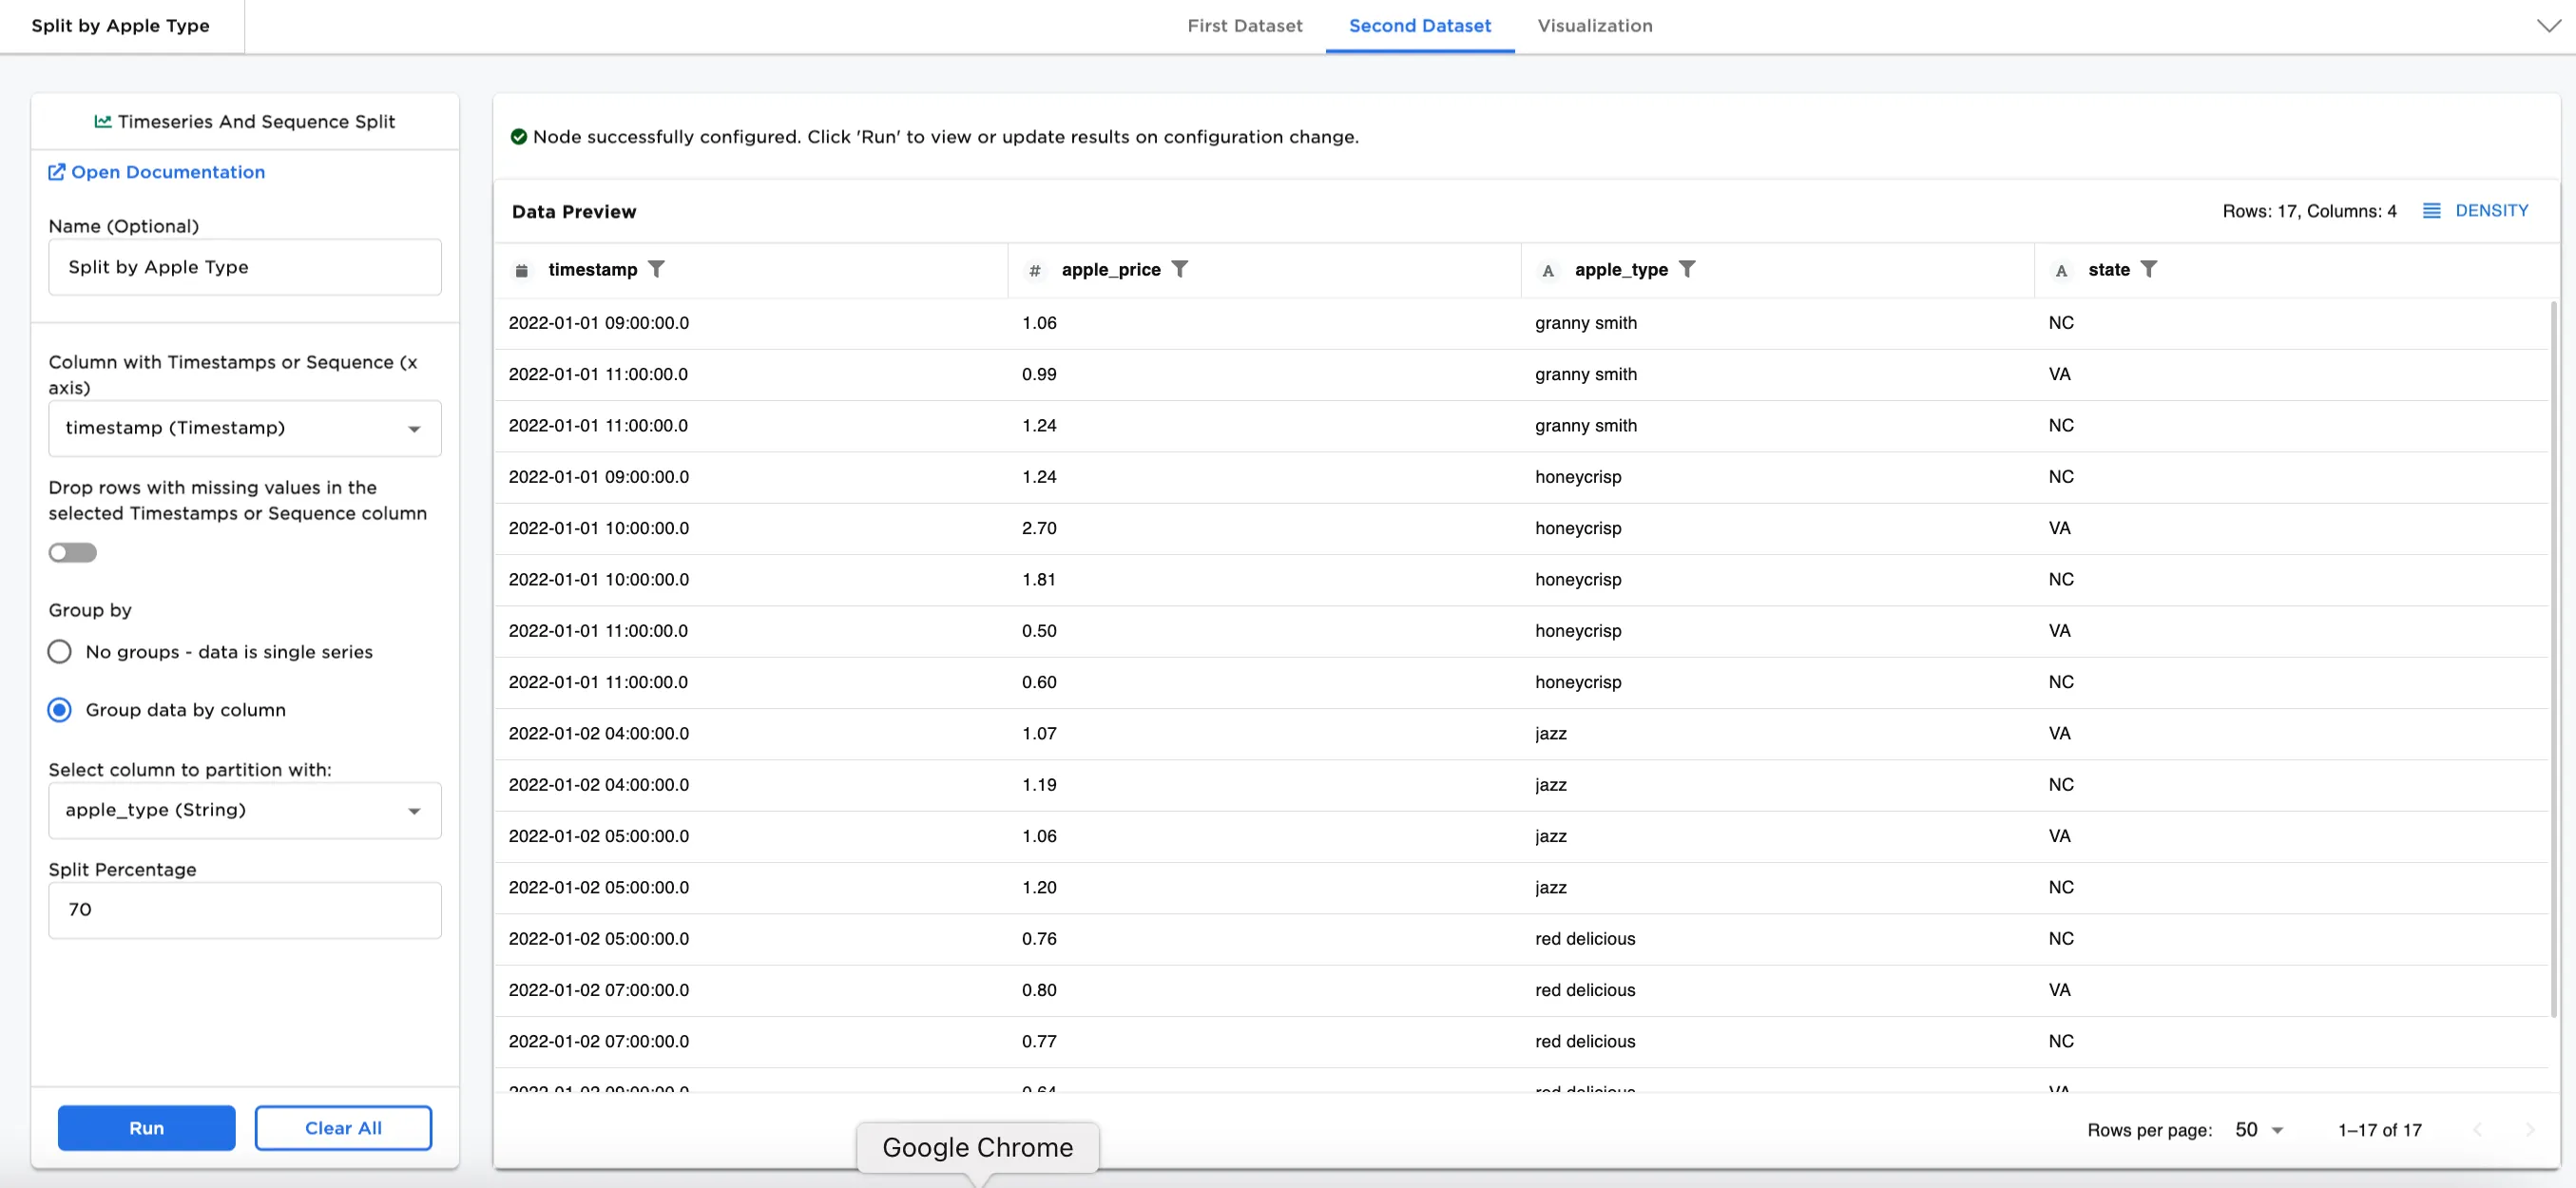 Figure 1b: Example dataframe output for Second Dataset
Examples
The dataset example uses a small sample of prices of apple varieties in two states. For more information about splitting data for training and testing, refer to the Random Split node.
Note: The Timeseries and Sequence Split node can be used to split more complex datasets than what we are showing in the example. Our purpose is to familiarize you with the node and how it can work to customize your larger datasets for machine learning.
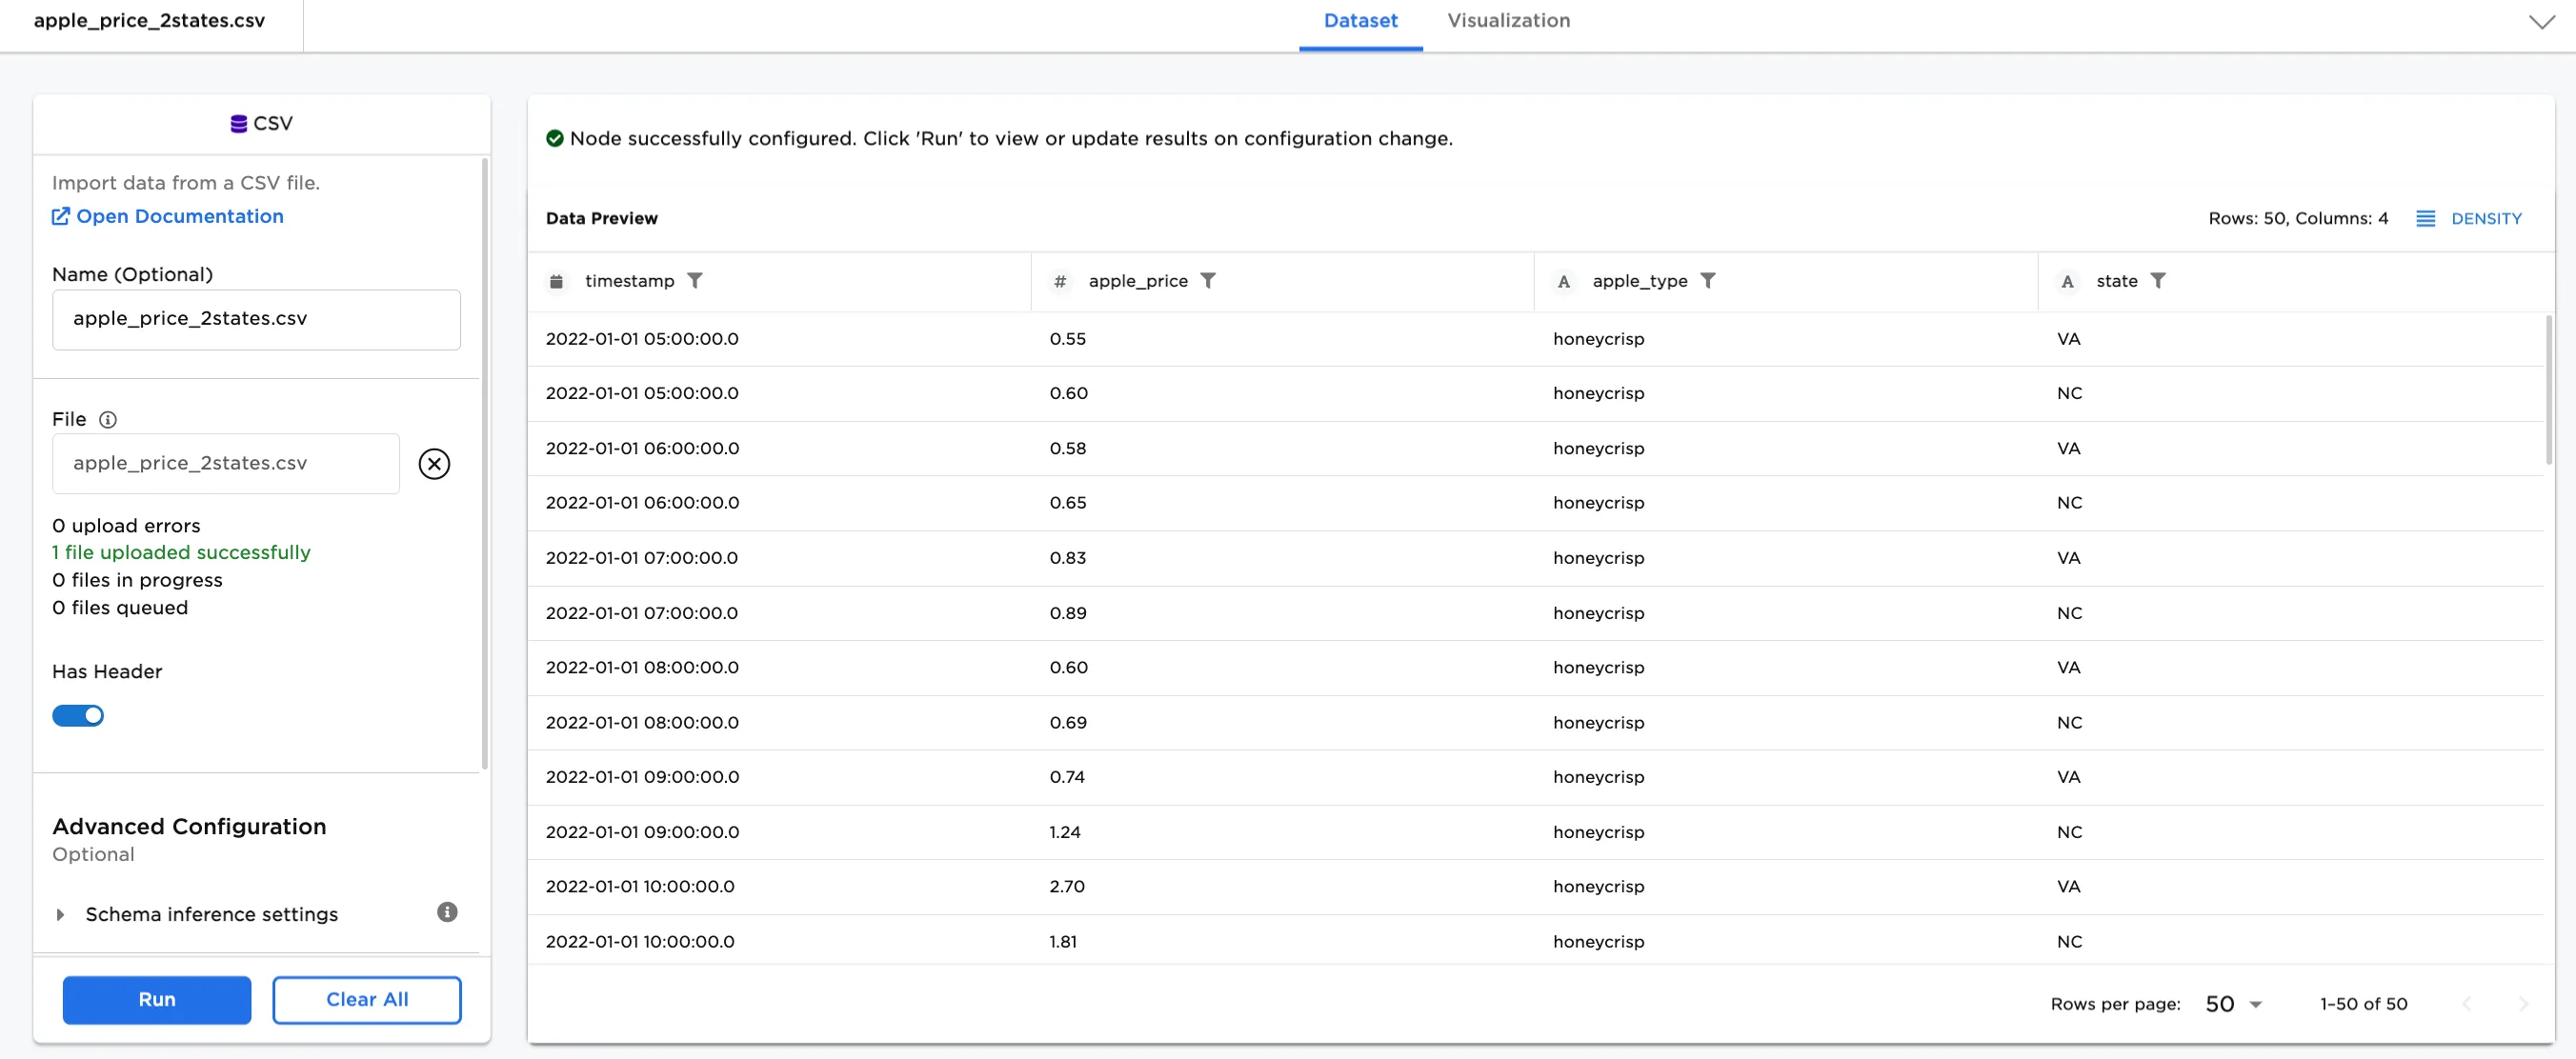 Figure 2: Example input data
- Connect a Timeseries and Sequence Split node to an existing node. In this case, it is connected to a CSV node with the
apple_price_2states.csvfile. This .csv file contains 50 rows of data. - Select the Timeseries and Sequence Split node. Optionally, add a name for the node. In this case, it is named,
Split apple prices over time. - Select a timestamp or sequence column in the Column with Timestamps or Sequence (x axis) dropdown menu.
- Select the Split Percentage. In this case,
70(default) is selected. - Select Run.
Notice that the original dataset contained 50 rows of date (see Figure 2). After splitting, the First Dataset contains 35 rows, and the Second Dataset contains 15 rows.
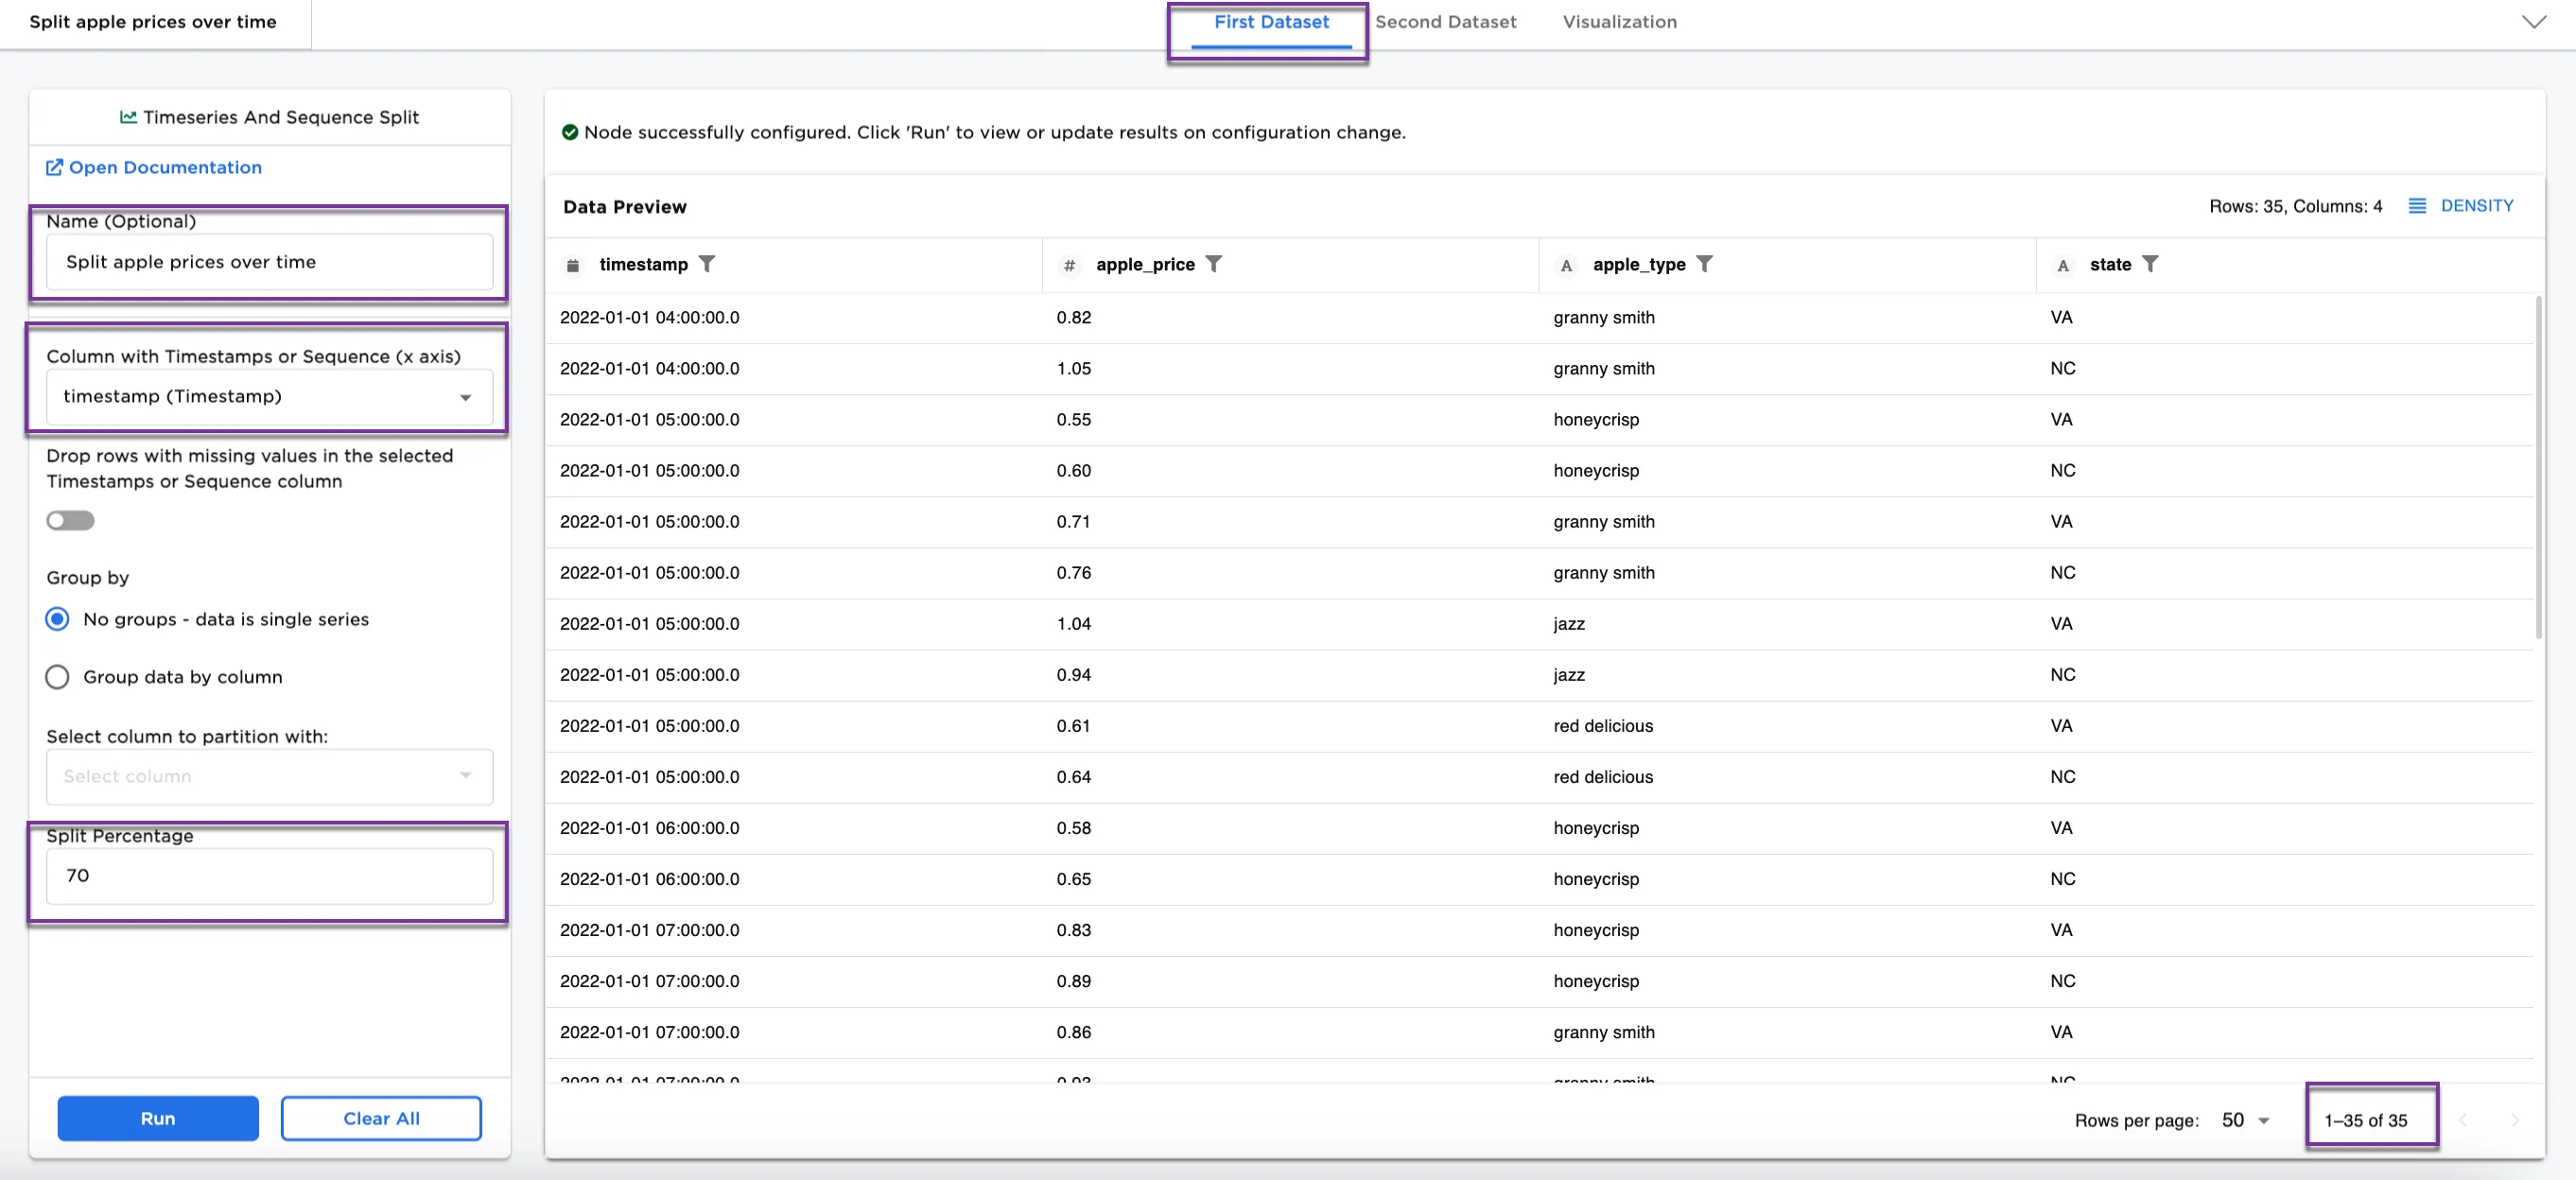 Figure 3a: Example dataframe output for First Dataset
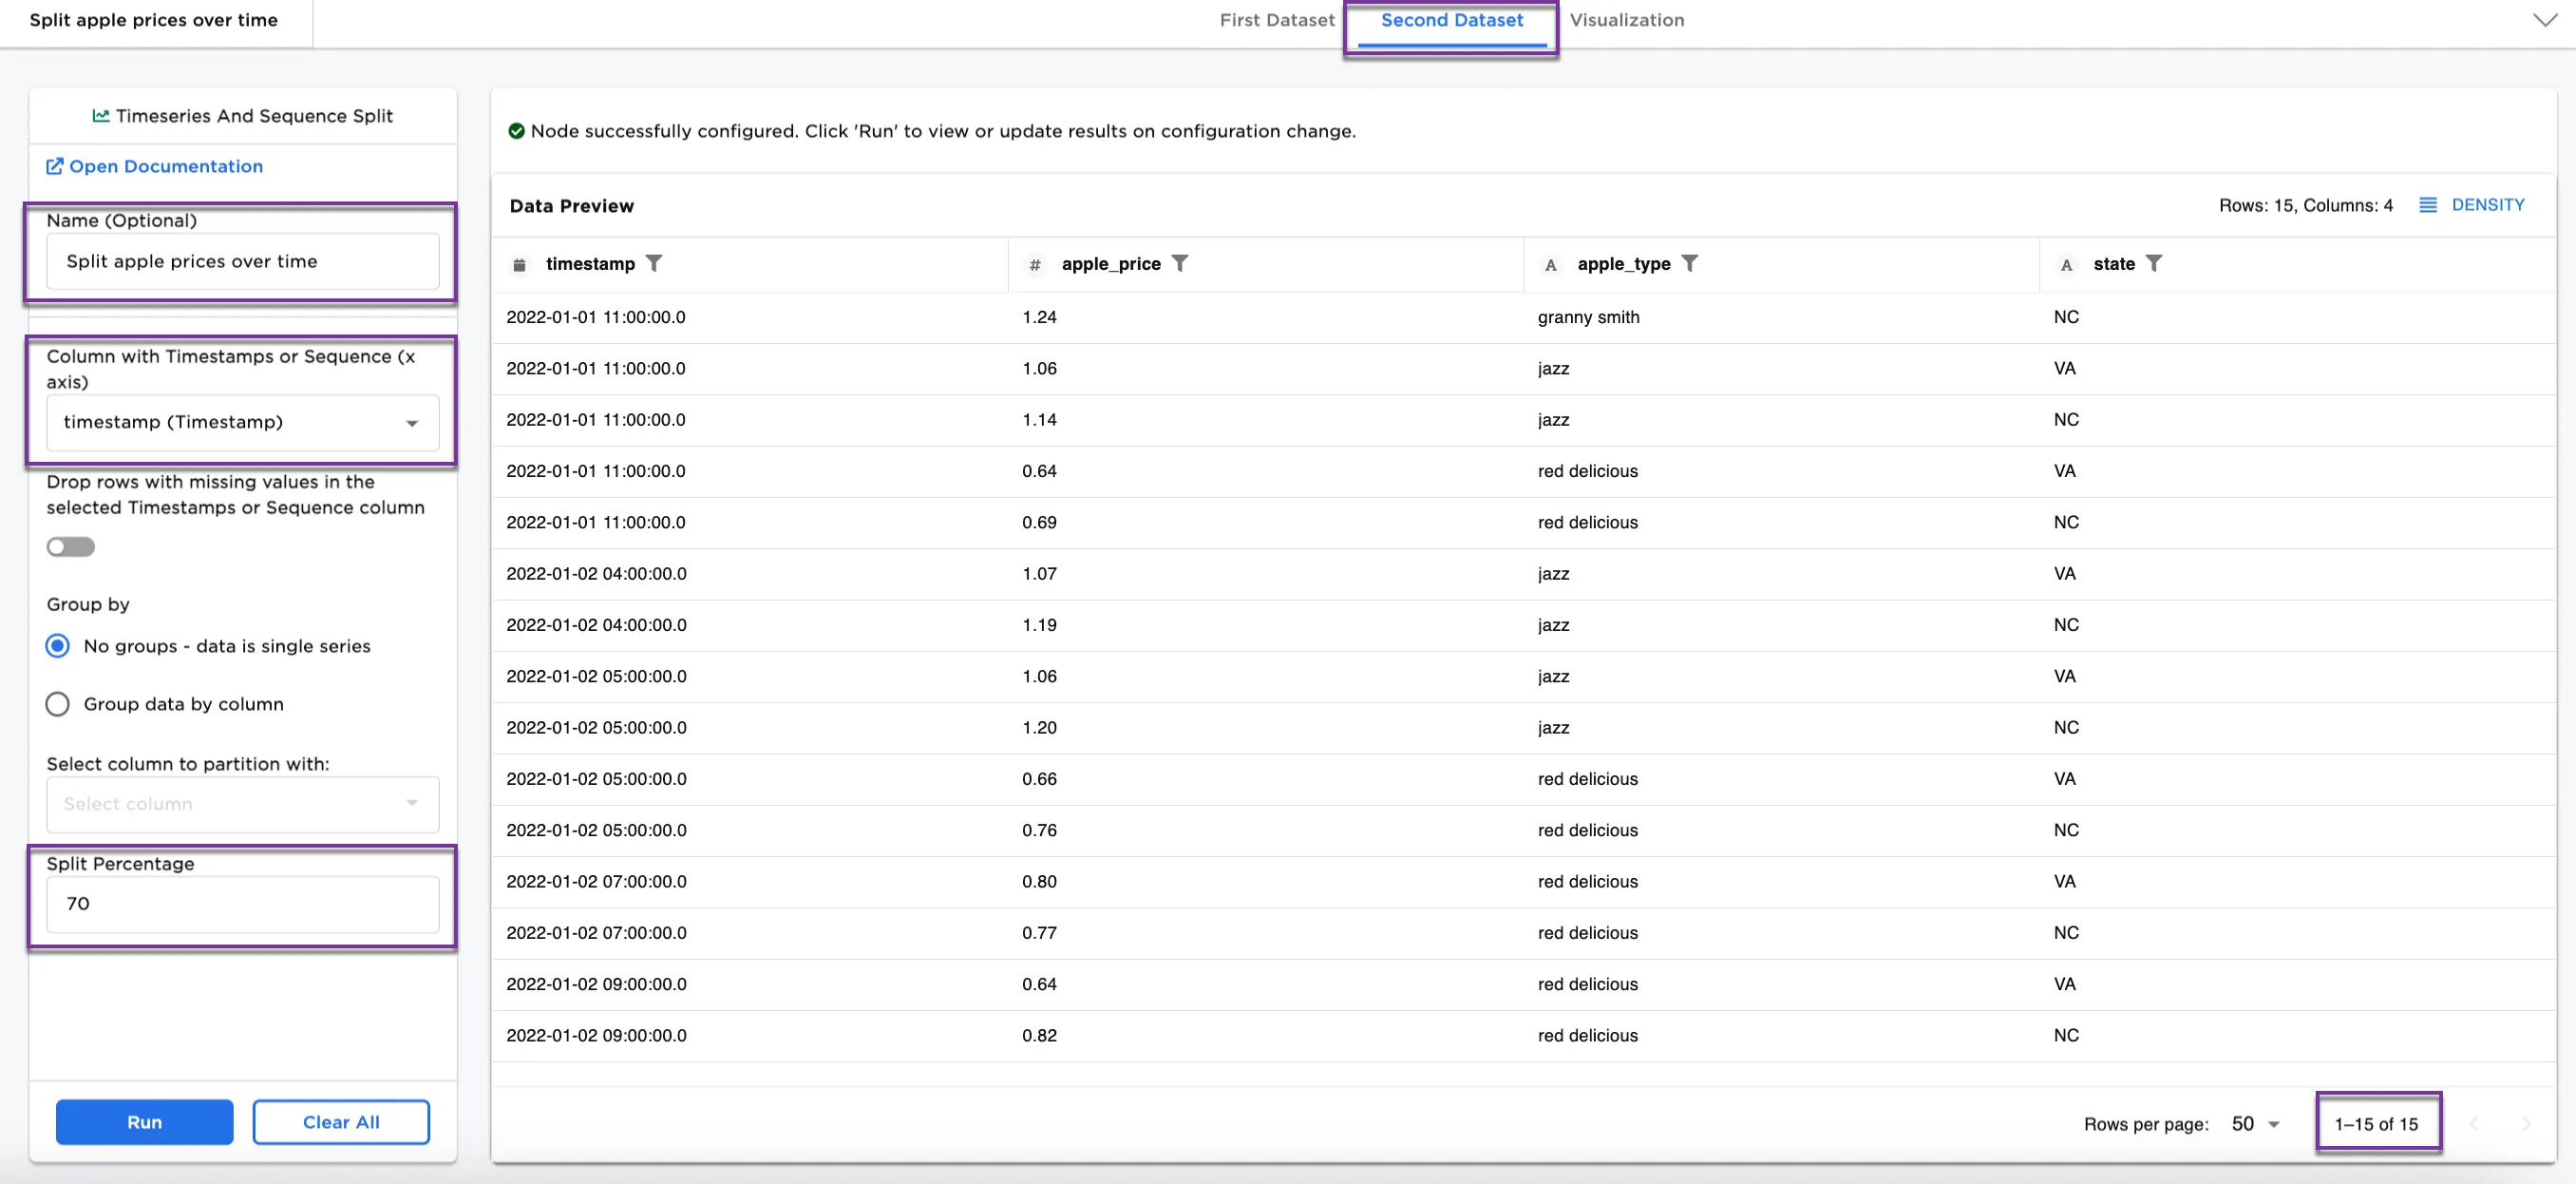 Figure 3b: Example dataframe output for Second Dataset
Next, we add a Group data by column partition to split the data.
- Optionally, rename the node. In this case, it is named,
Split by Apple Type. - Select Group data by column.
- Select
apple_type (String)for Select column to partition with.
Figure 4a and Figure 4b show the First Dataset and Second Dataset split by apple types. The content is different in each from Figure 3a and Figure 3b, and notice that the First Dataset contains 33 rows and the Second Dataset contains 17 rows.
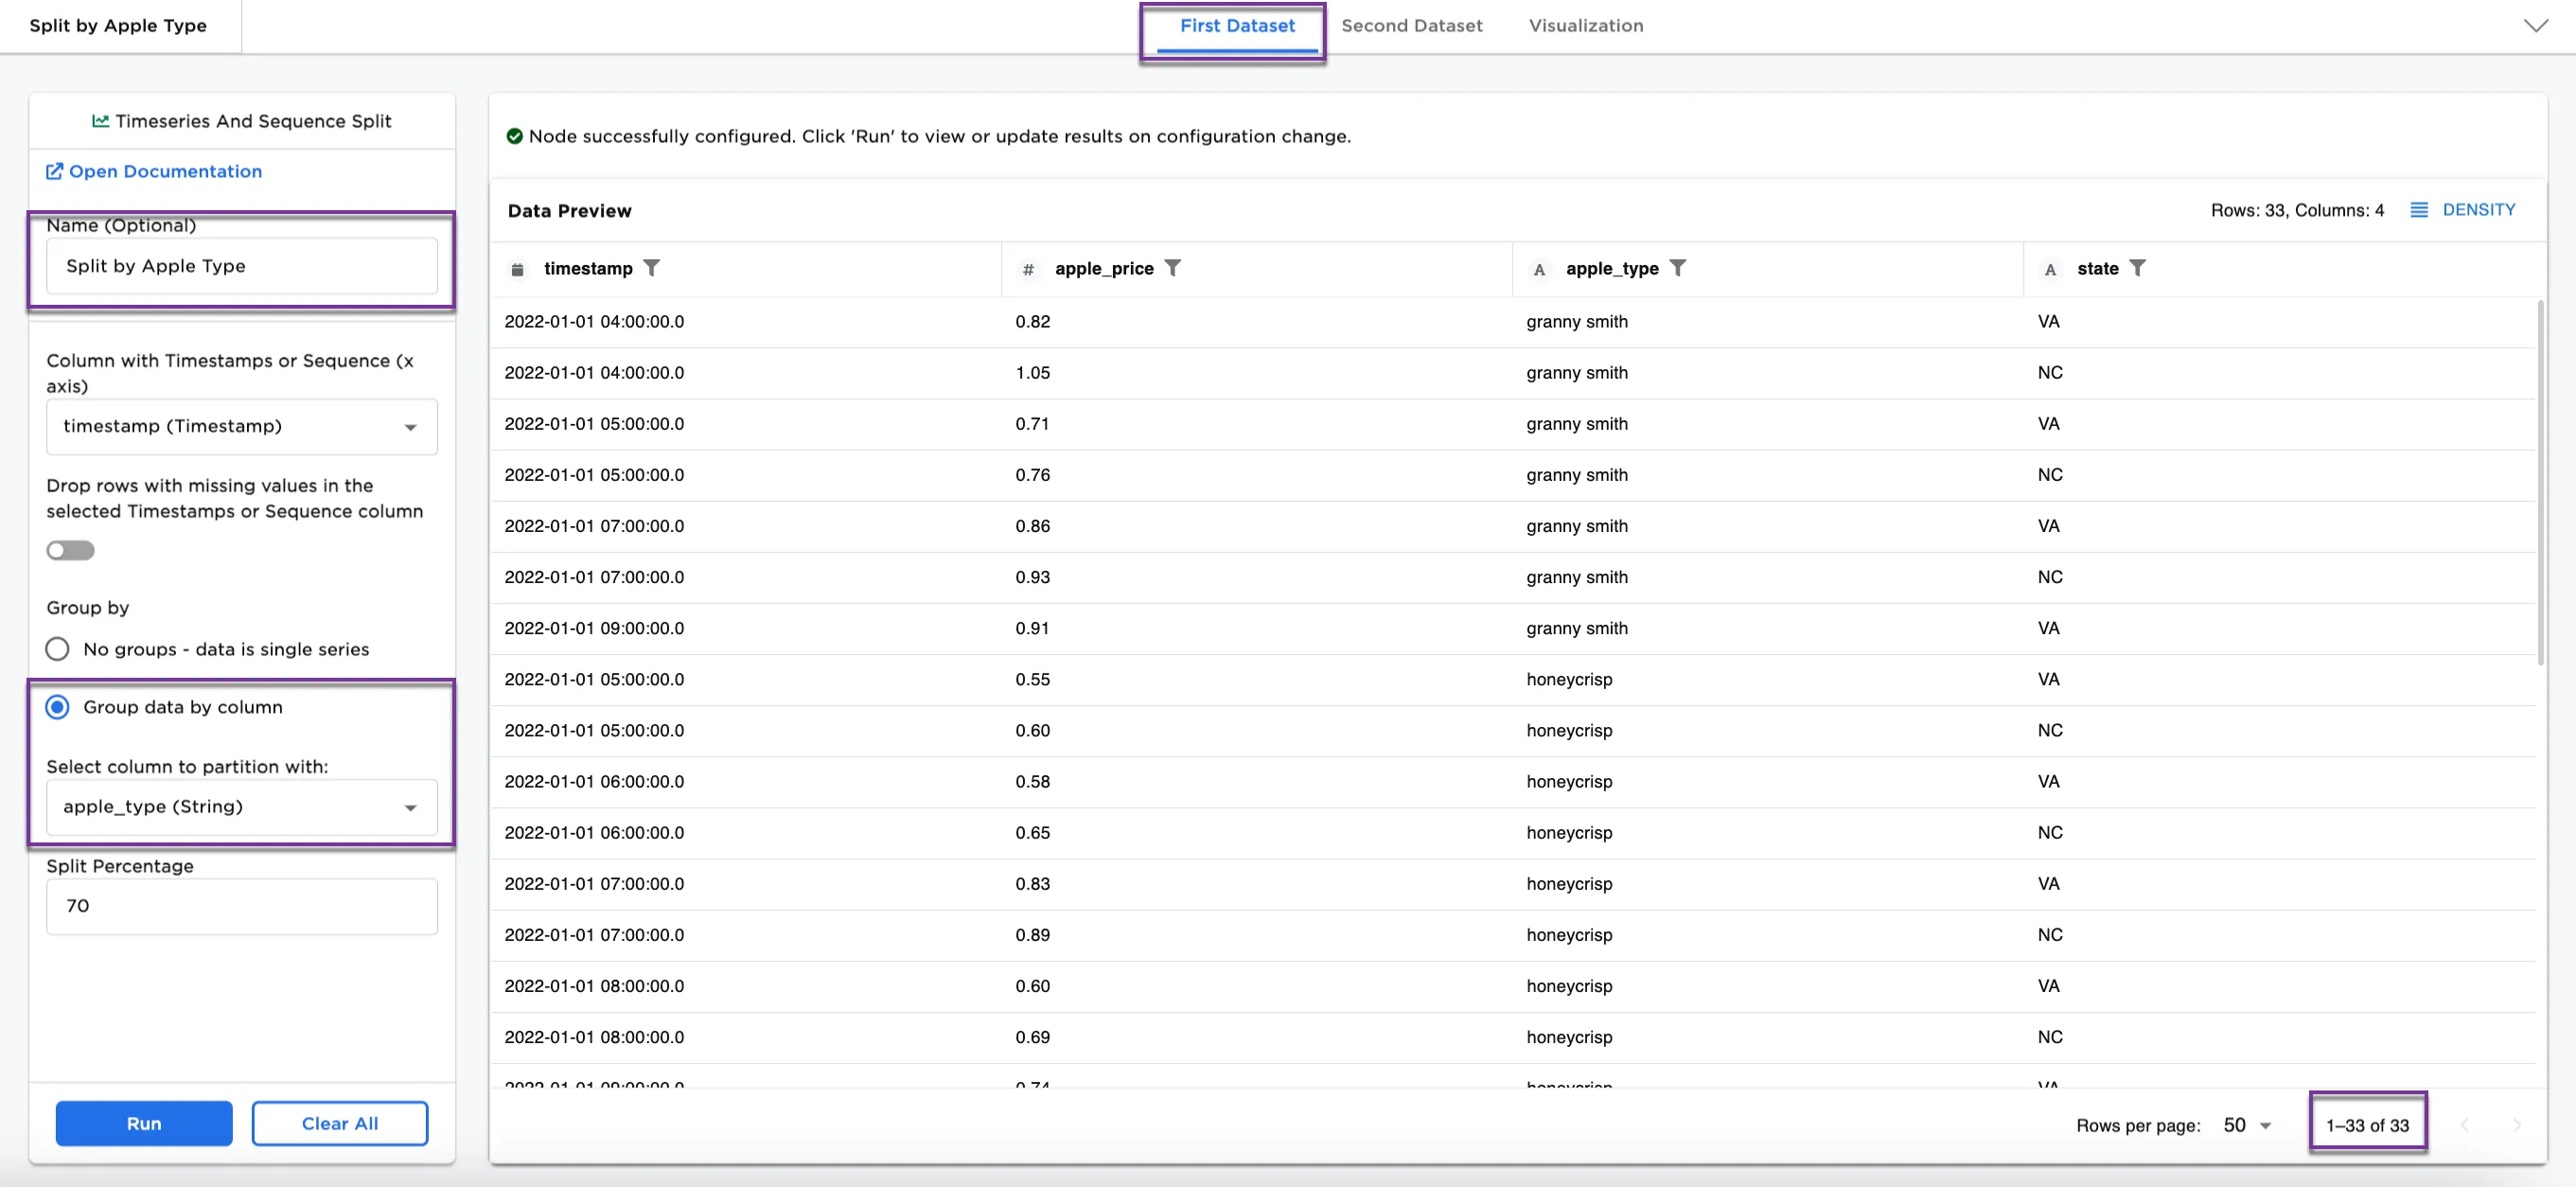 Figure 4a: Example dataframe output for First Dataset by apple type
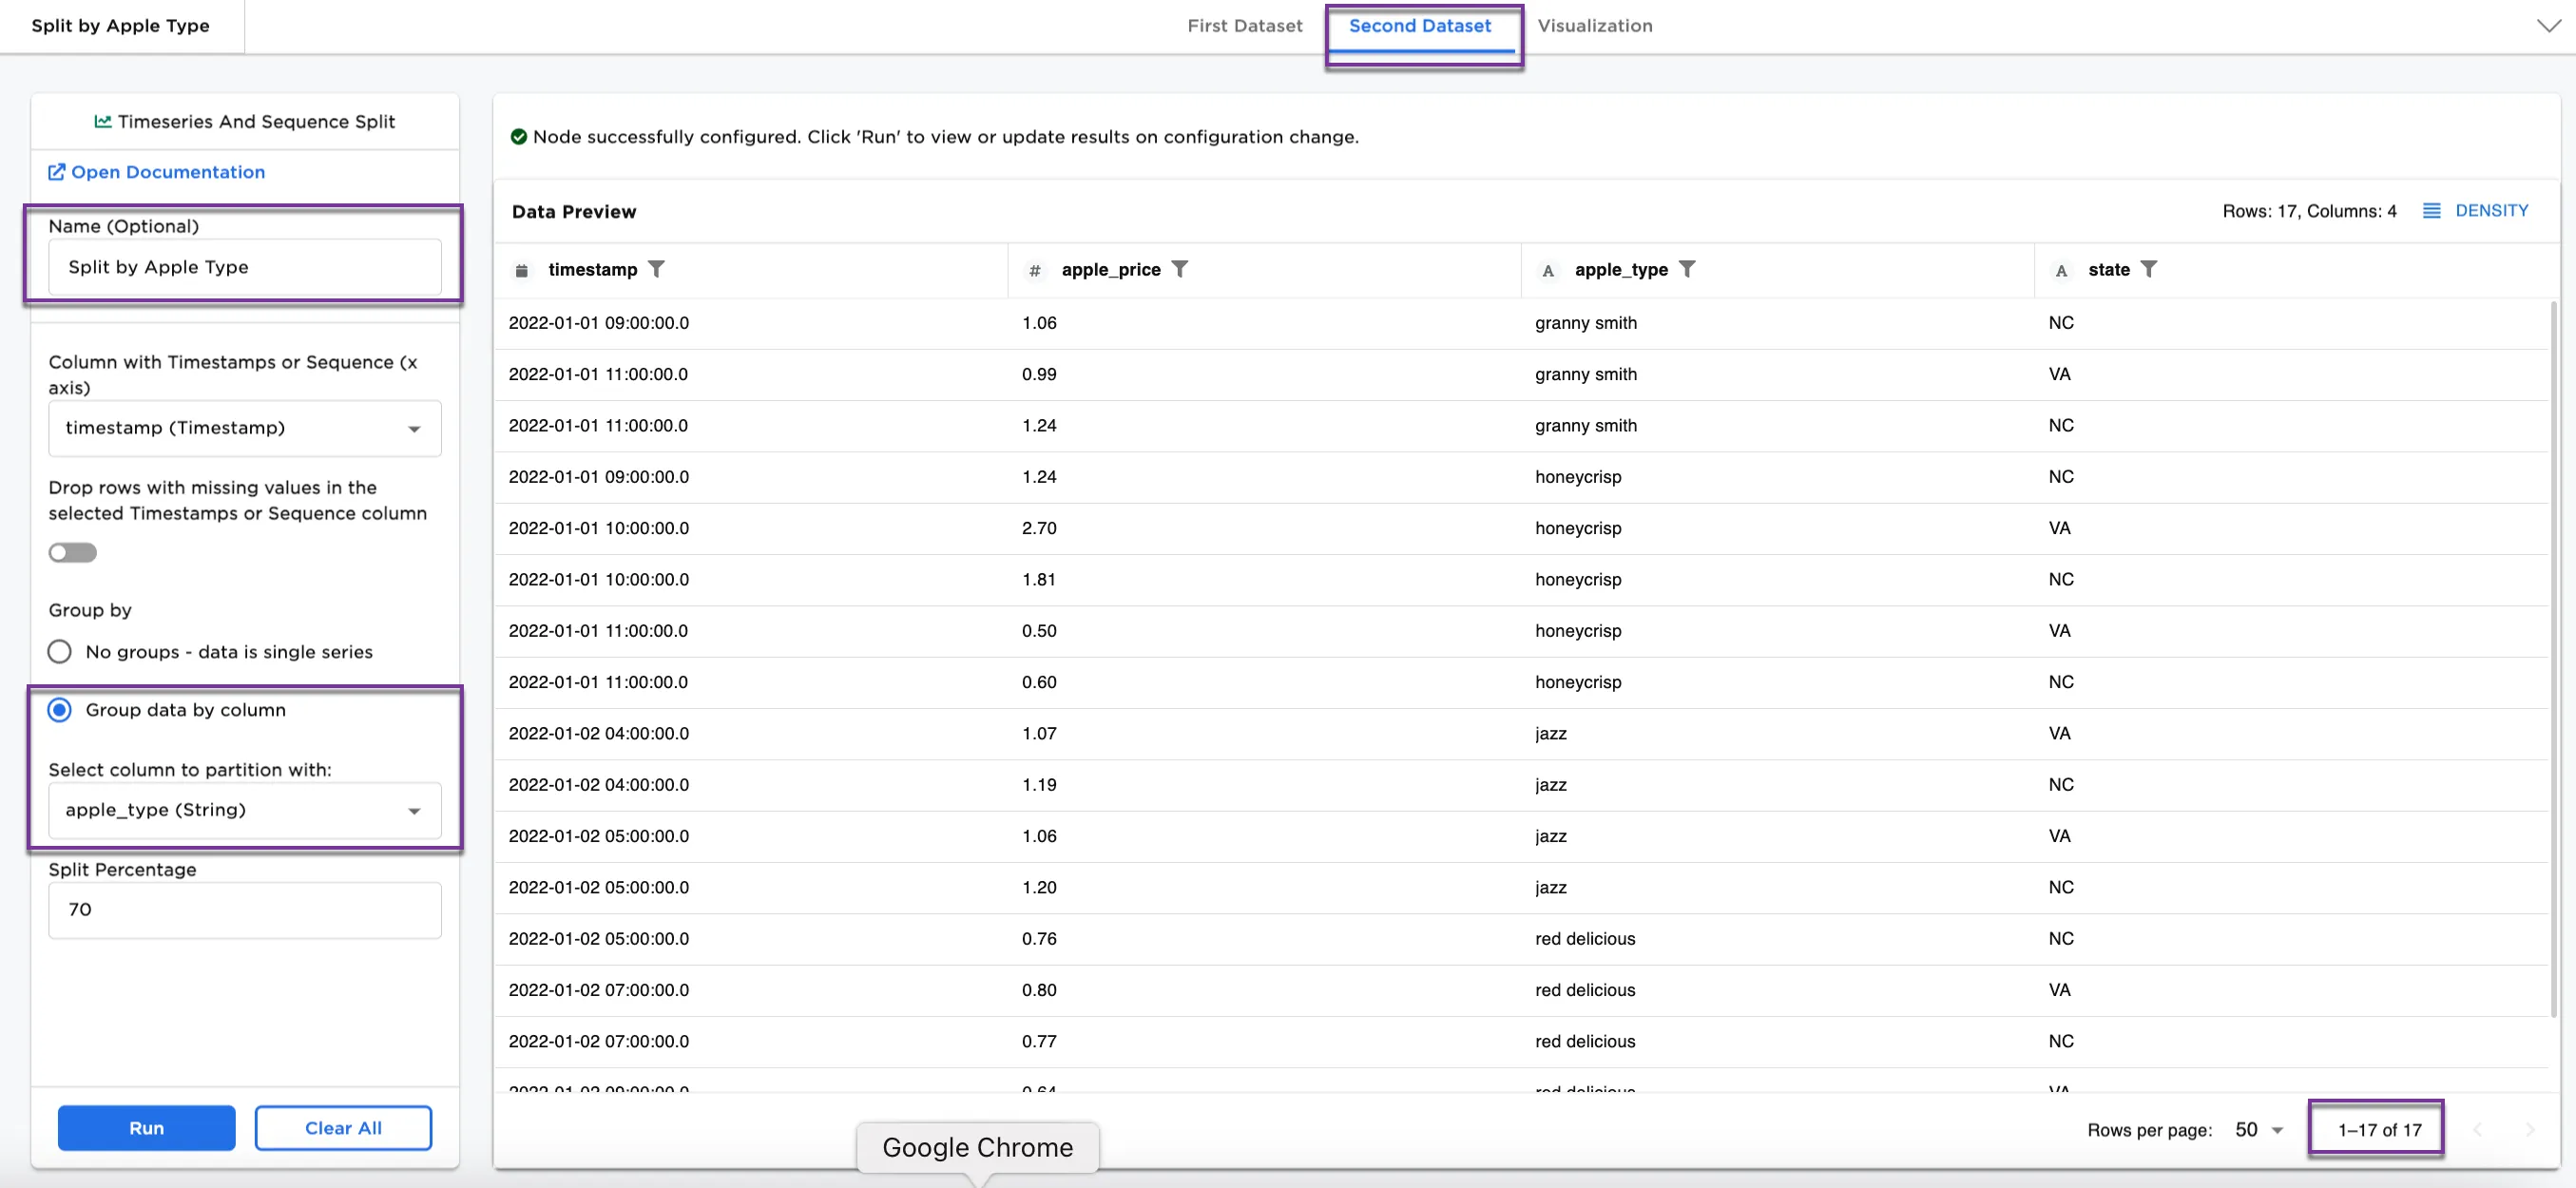 Figure 4b: Example dataframe output for Second Dataset by apple type
Next, we can try a different Group data by column partition to split the data.
- Optionally, rename the node. In this case, it is named,
Split by State. - Select Group data by column.
- Select
state (String)for Select column to partition with. - Optionally, update the Split Percentage to 60.
Figure 5a and Figure 5b show the First Dataset and Second Dataset split by state, different from the splits in Figures 3a, 3b, 4a, and 4b. Notice also with the different split percentage that there are 30 rows in the First Dataset and 20 rows in the Second Dataset.
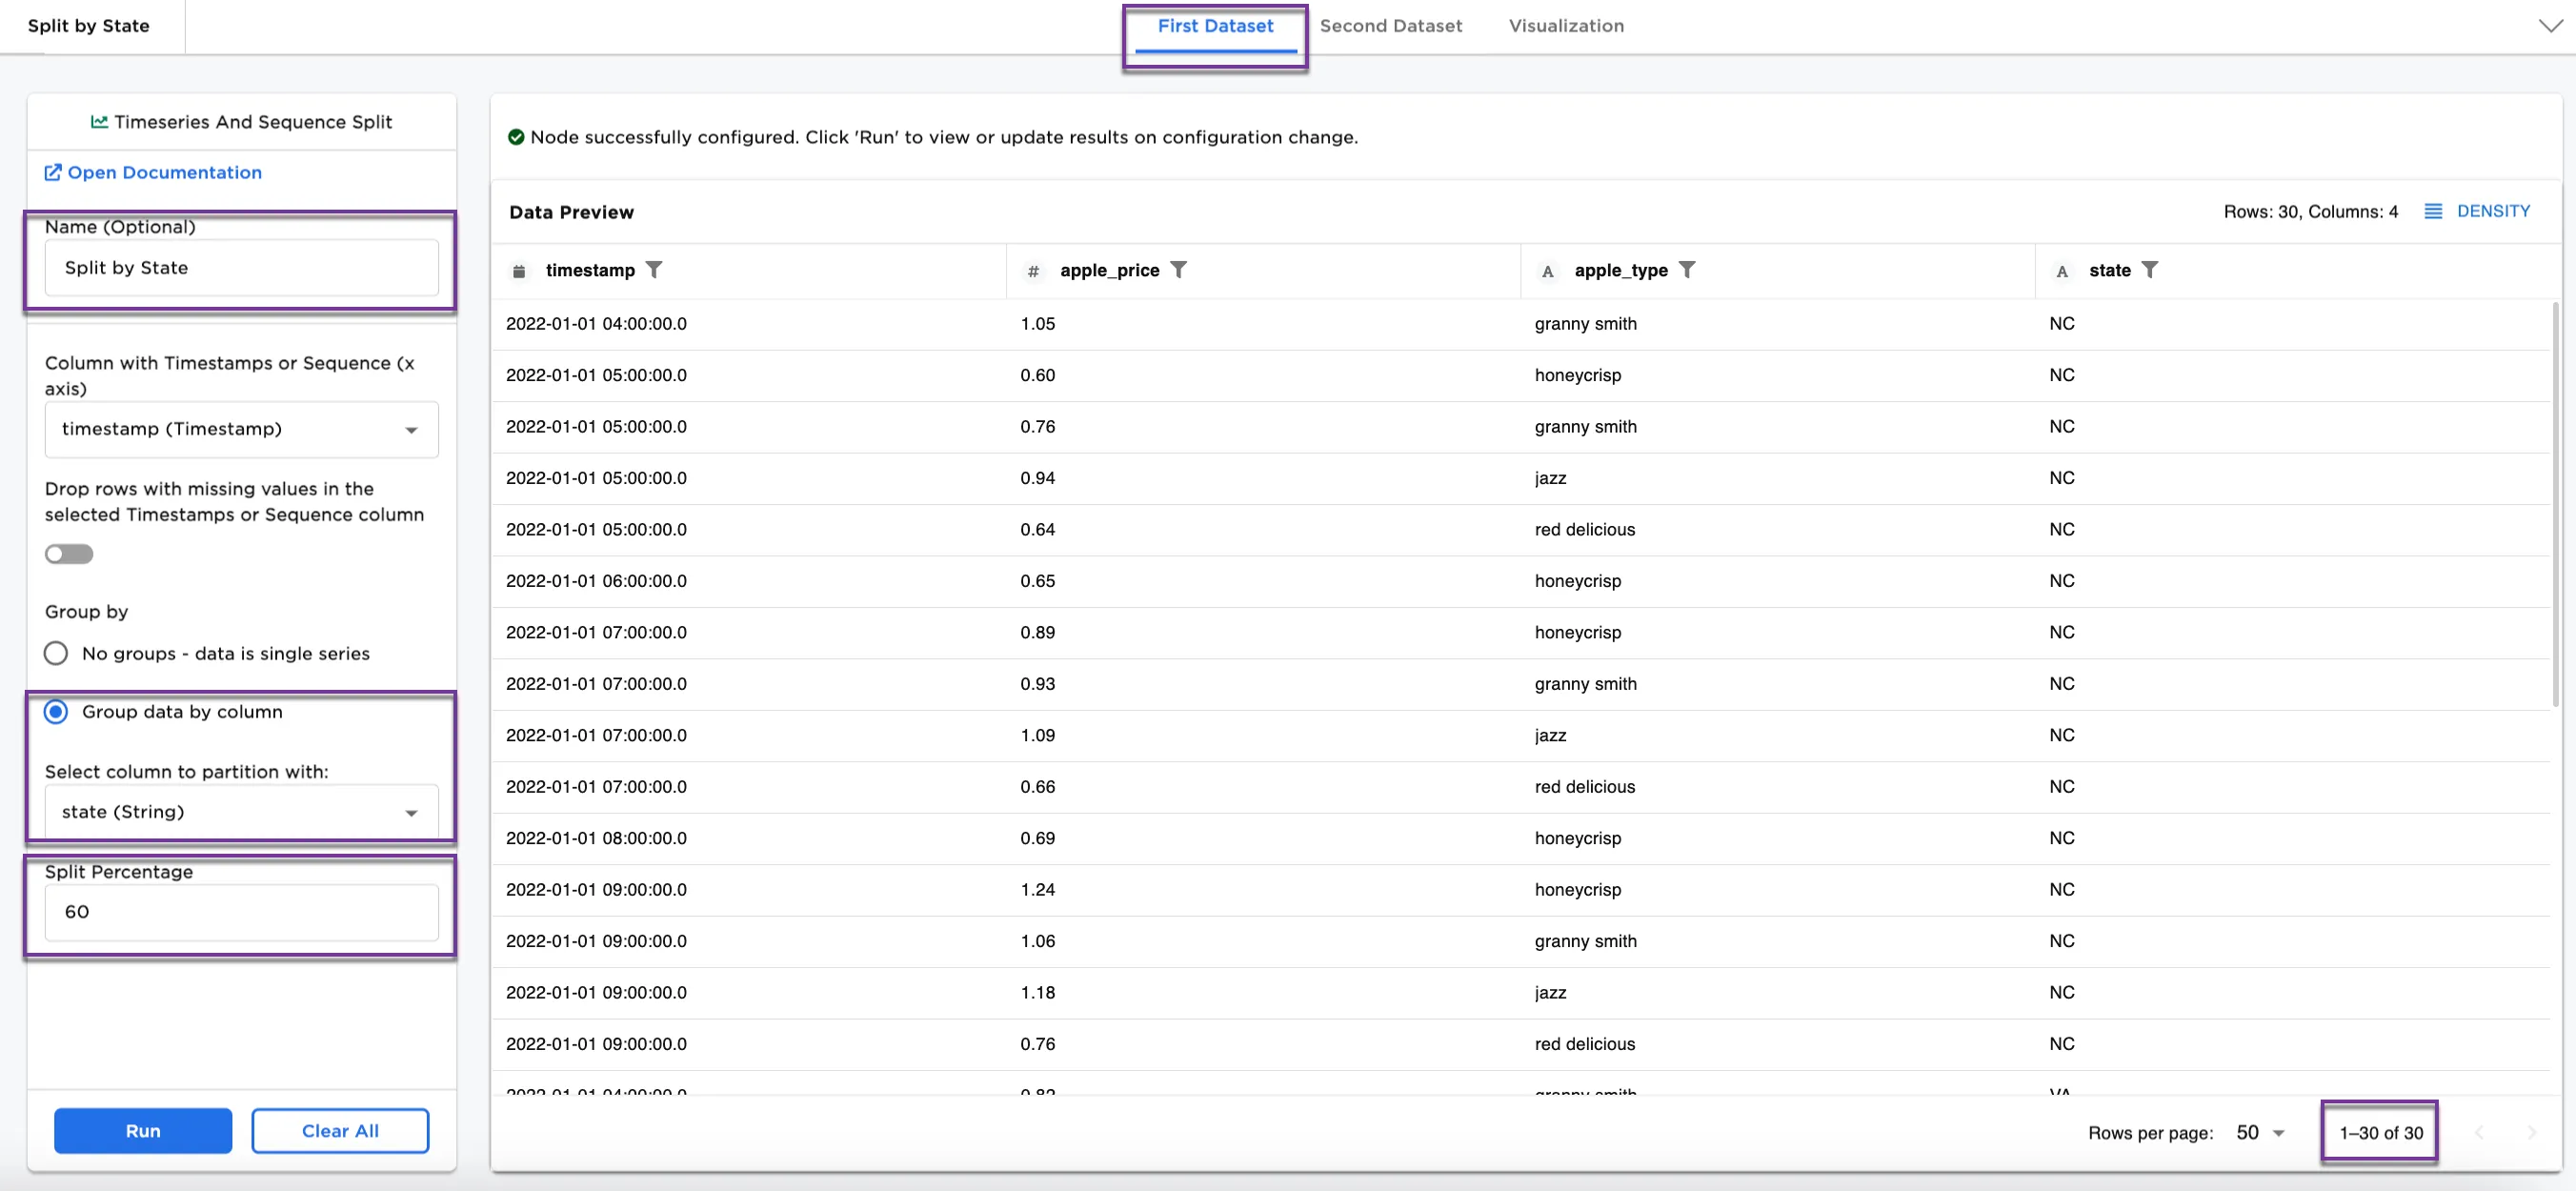 Figure 5a: Example dataframe output for First Dataset by state
 Figure 5b: Example dataframe output for Second Dataset by state