Remote Debugger with the C3 AI VS Code Extension
Debuggers are tools developers use to identify issues with code and inspect variable values while code executes. Use the remote debugger with the C3 AI VS Code Extension to debug code run on the server using VS Code. The debugger supports JavaScript (RhinoJS) and Python (Py4j). The debugger updates automatically when you make changes to code. You can make changes to code without restarting the debugger.
To use the debugger:
- Start the debugger.
- Trigger a C3 AI action. This can include running code from a C3 AI Notebook or running a test through the VS Code Extension tester.
After you start the debugger and trigger a C3 AI action, the C3 AI VS Code Extension debugger pauses on actions that have a valid breakpoint set.
The debugger supports JavaScript (RhinoJS) and Python (Py4j).
Start debugger
There are three ways to start the debugger:
- Connect to your environment and start your application. For more information, see the Develop a C3 AI Application topic.
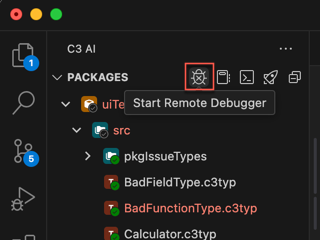
- In the C3 AI VSCE tab, select the Start Remote Debugger icon.
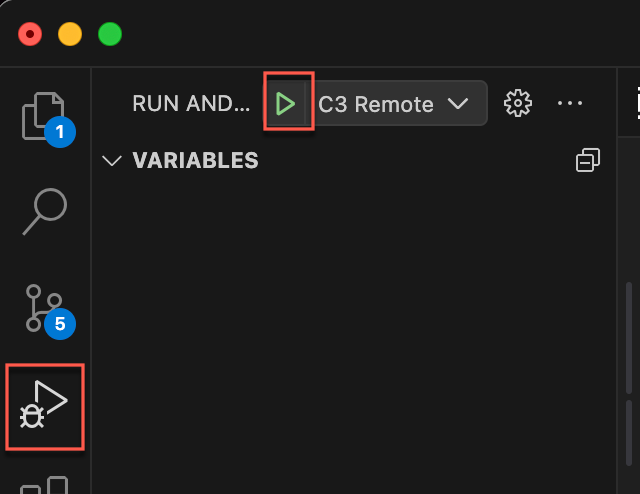
- Navigate to the Run and Debug tab, then select the green play icon.
When you start the remote debugger, a floating action bar for the debugger displays at the top of your VS Code window.

Set breakpoints
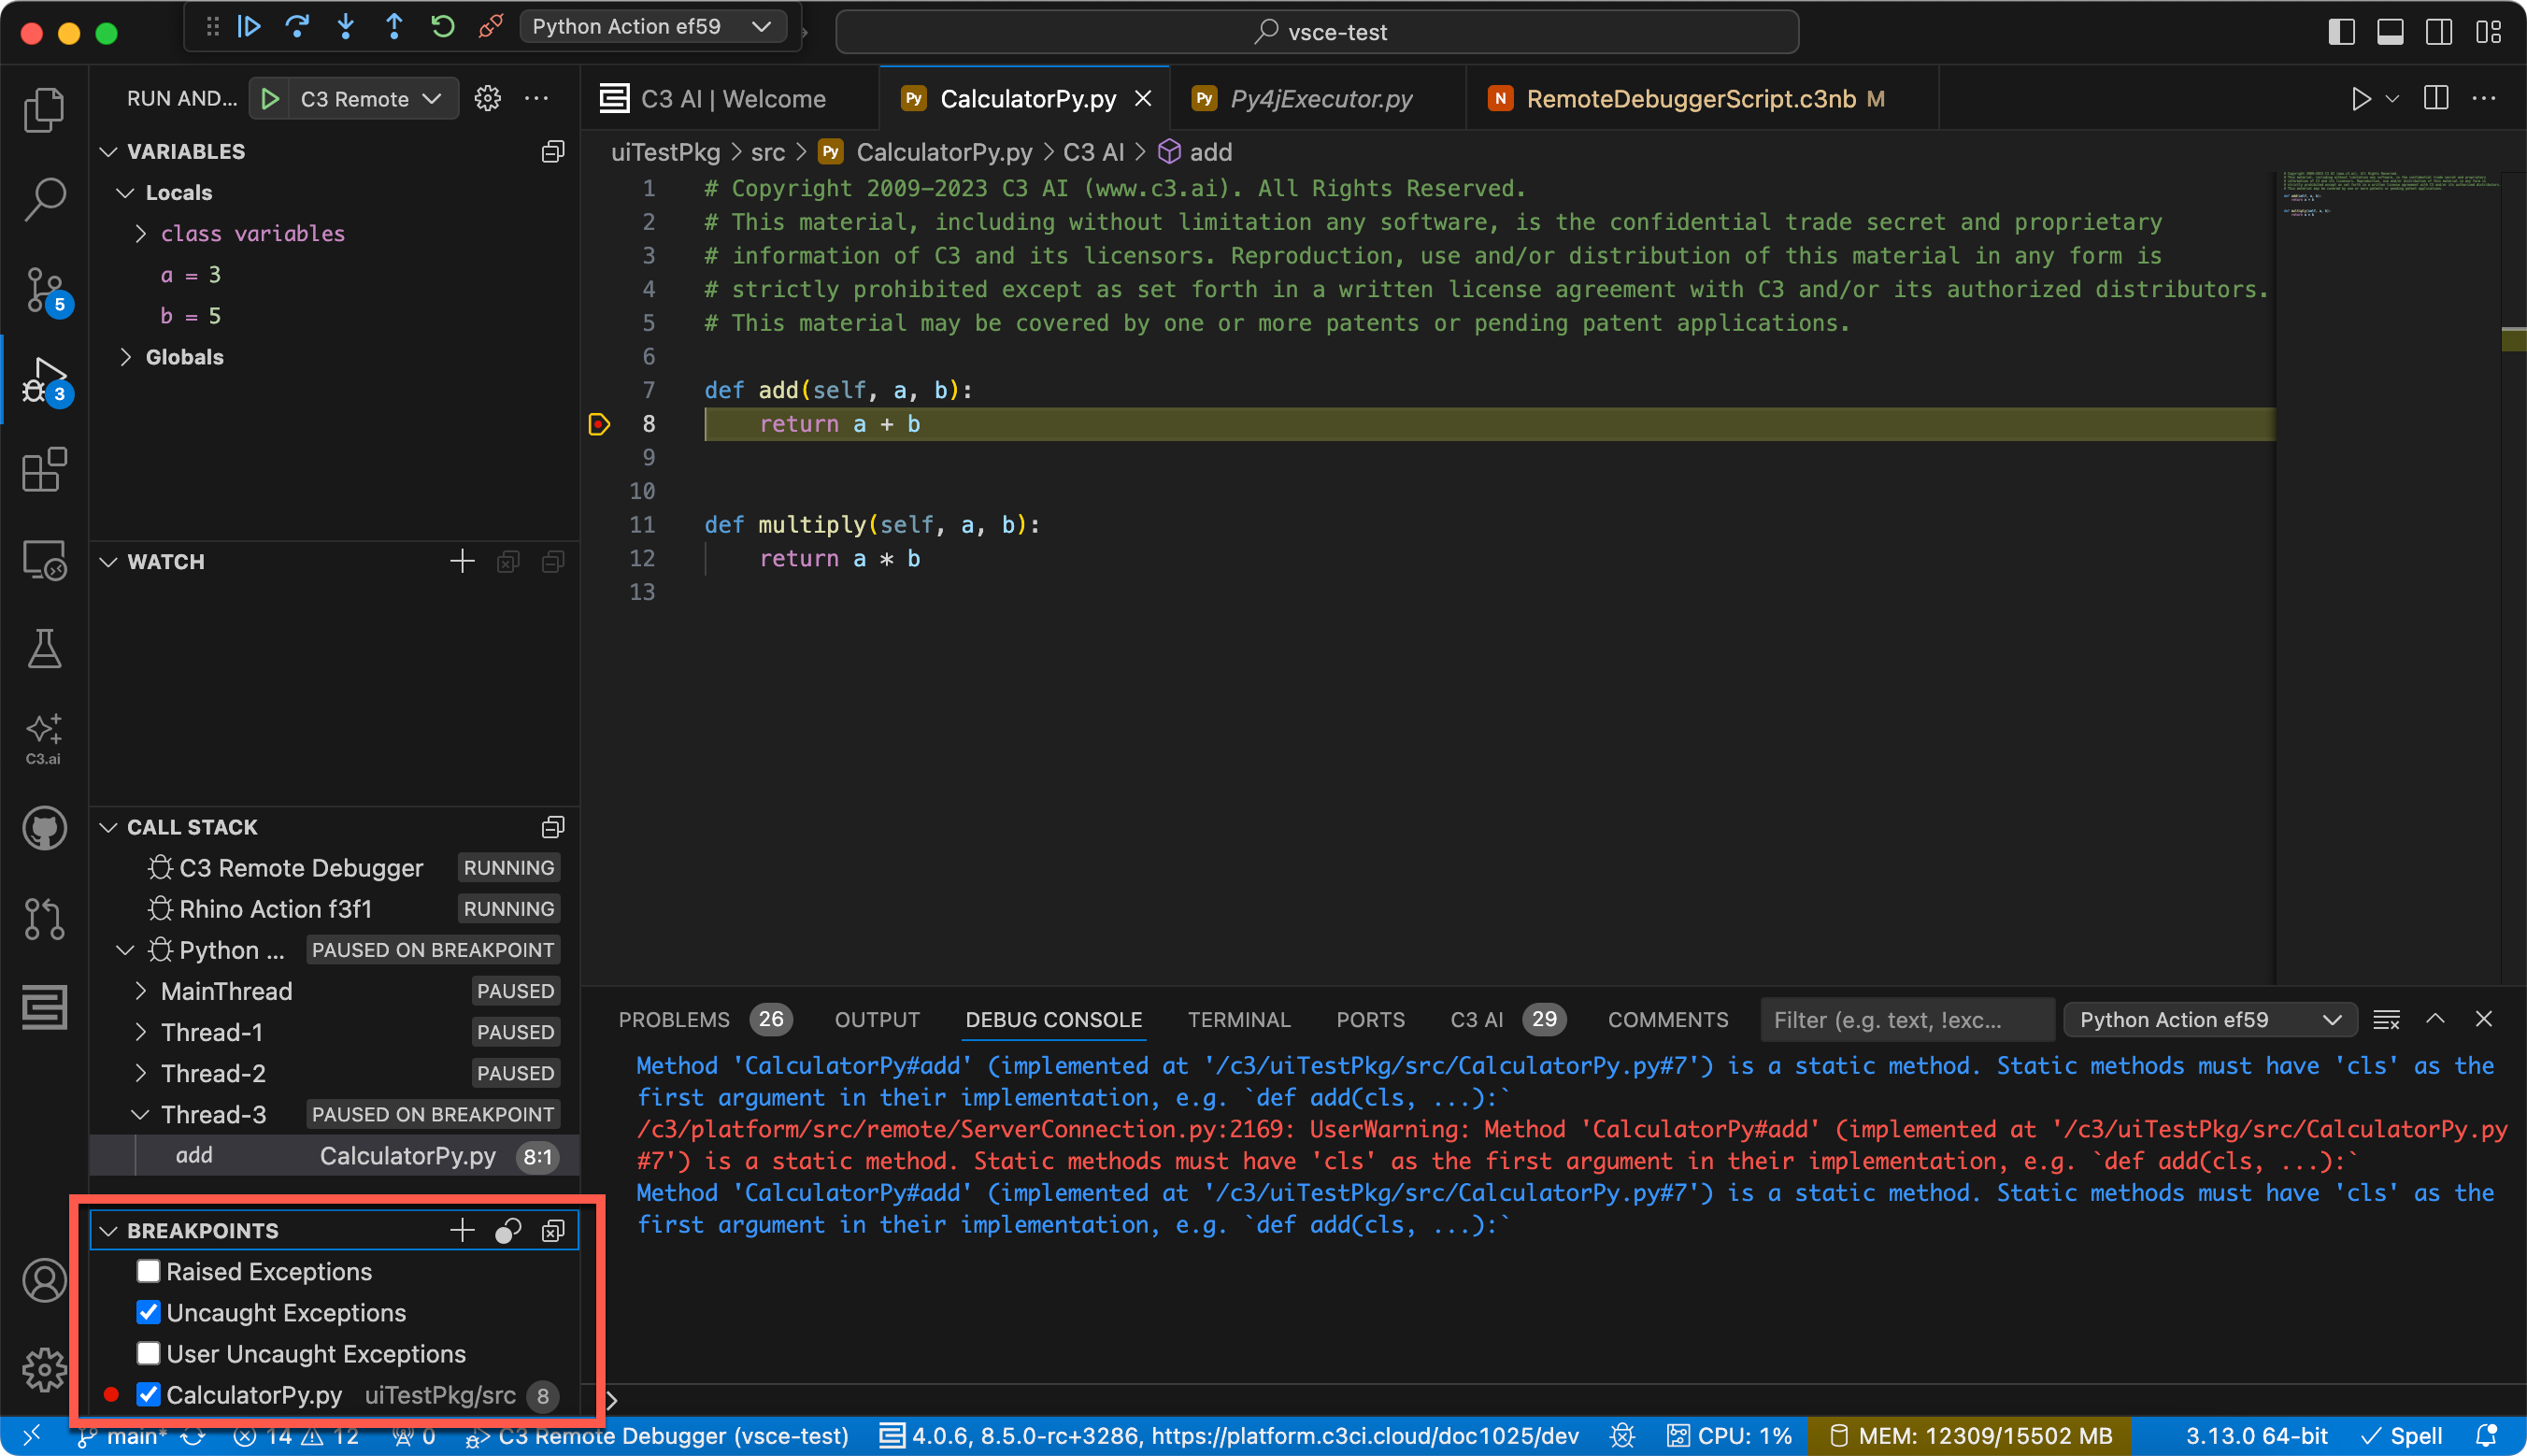
You can set breakpoints in any Python or JavaScript code for your application. At any breakpoint, you can see a breakdown of variables and the call stack.
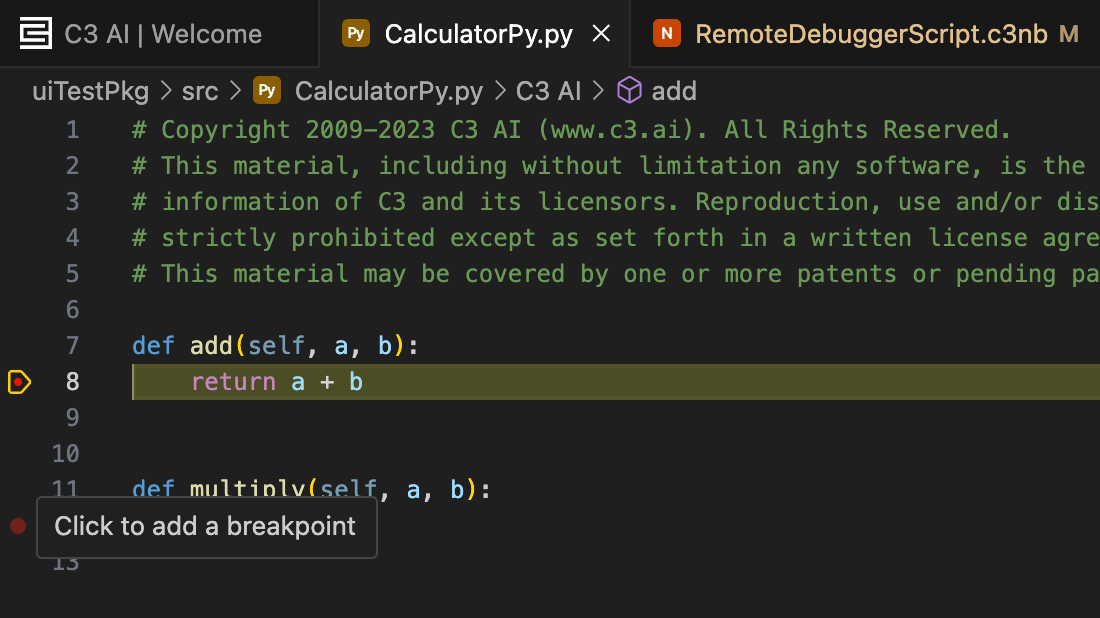
To set breakpoints, select the space to the left of the line number in VS Code while editing your files.
In this example, a breakpoint is already set on line 8, and the user is about to set another breakpoint on line 12.
Manage breakpoints
You can add, toggle, or remove breakpoints using the debugger in VS Code. Manage breakpoints in the debugger tab.
Here are the available quick actions:
- Add function breakpoint
- Toggle active breakpoints
- Remove all breakpoints
Action bar
Using the action bar, you can debug line by line, or function by function.
- Continue — continues running your code until the next breakpoint
- Step over — runs the current line of code, including any function calls within it, and pause at the next line
- Step into — enters a function call to debug code line by line
- Step out — finishes running the current function, then returns to the calling code
- Restart — does not do anything. Do not use
Since the VSCE uses a remote debugger, you can make changes to a file while debugger is active. You can reuse the same breakpoints as before.
Debug console
The debug console is helpful to examine individual variables and other useful information. If you don't see the debug console, you may have to open it with a shortcut. Use Ctrl + Shift + Y for Windows, and Command + Shift + Y for Mac.
In Python, you can use print() function which logs to the debug console. Also, you can type in in the debug console directly during a breakpoint to evaluate expressions.
Disconnect debugger
Selecting the disconnect icon stops the debugger. If you do not see the debugger action bar, you are no longer debugging.