C3 AI VS Code Extension Features
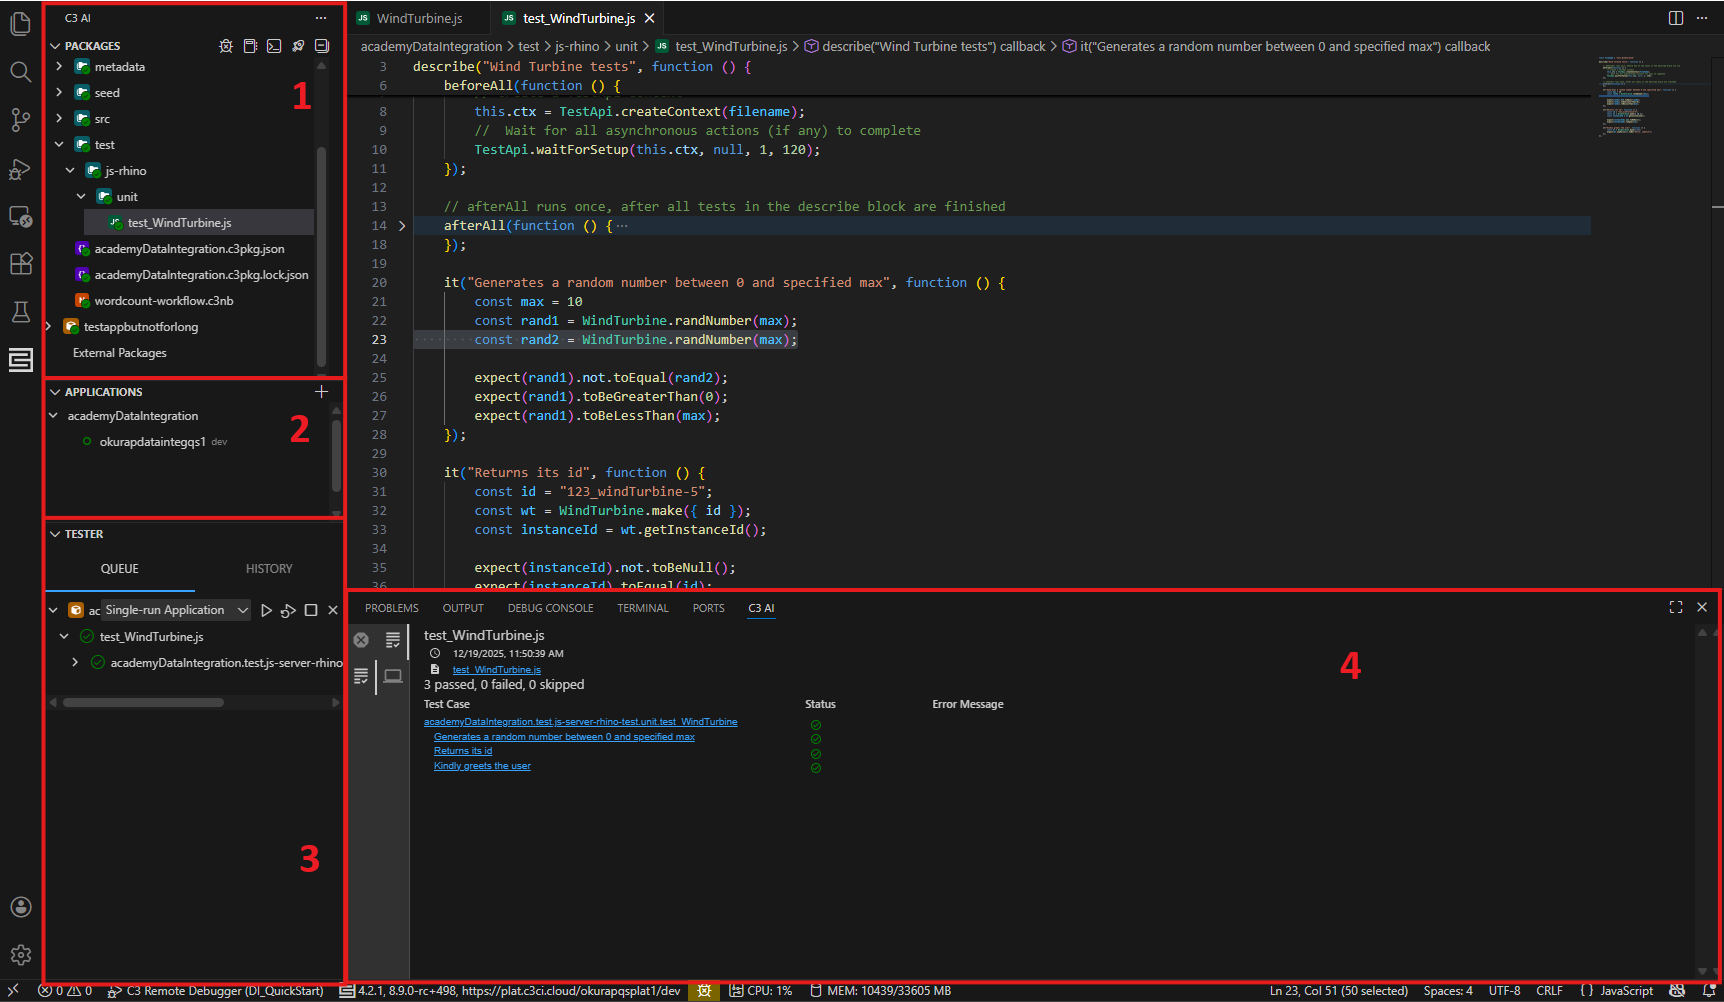
The C3 AI VS Code extension (VSCE) has 4 main areas:
- Package Explorer (1)
- Application Explorer (2)
- Tester (3)
- Bottom C3 AI Panel (4):
- C3 AI: Test results
- Output: Logs from the VSCE, C3 AI server, or C3 Python Language server
 |
|---|
| (1) Package Explorer, (2) Application Explorer, (3) Tester, (4) Bottom C3 AI Panel Tabs |
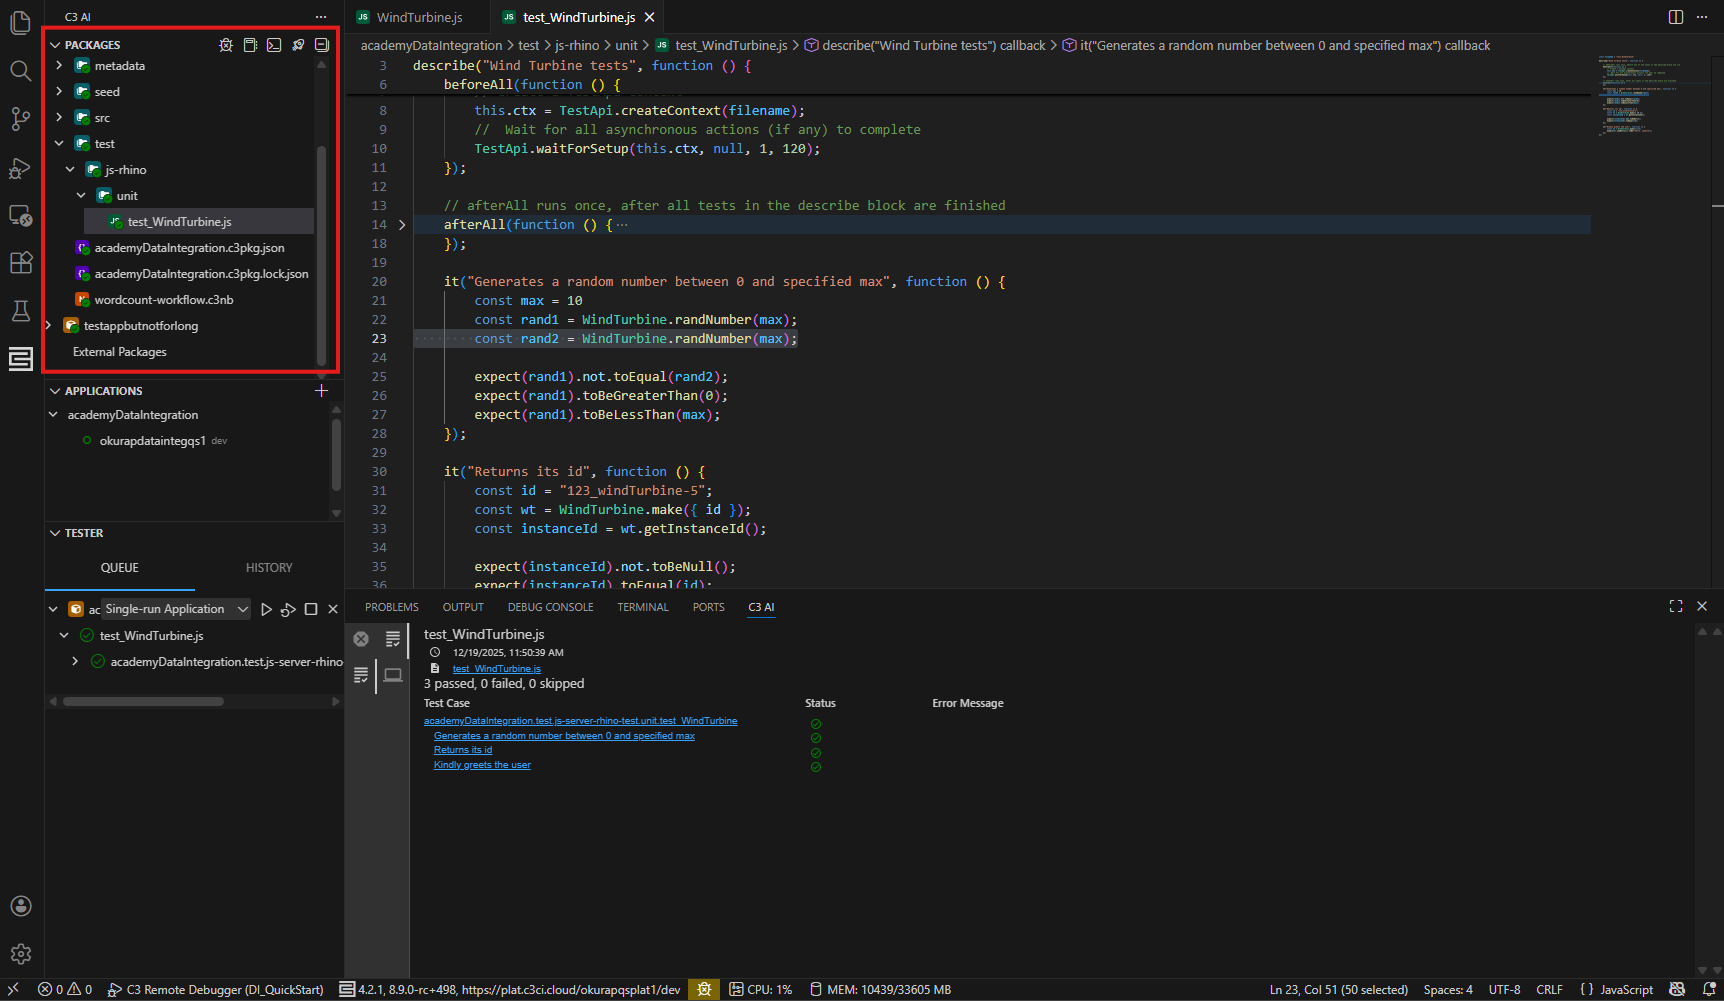
Package Explorer
The Package Explorer is recommended for interacting with your packages (over the native file explorer).
After you establish a connection, the package explorer panel lists your local packages and any dependencies from the server.
 |
|---|
| Application Explorer View |
Use the package explorer to:
- Create new packages with or without UI utilities
- Copy, paste, and manage files and folders in your packages
- Run an application package, or sync package files with the server
- See file or folder synchronization status (checkmarks next to the file icon)
- Run, debug, or add tests to the Tester queue
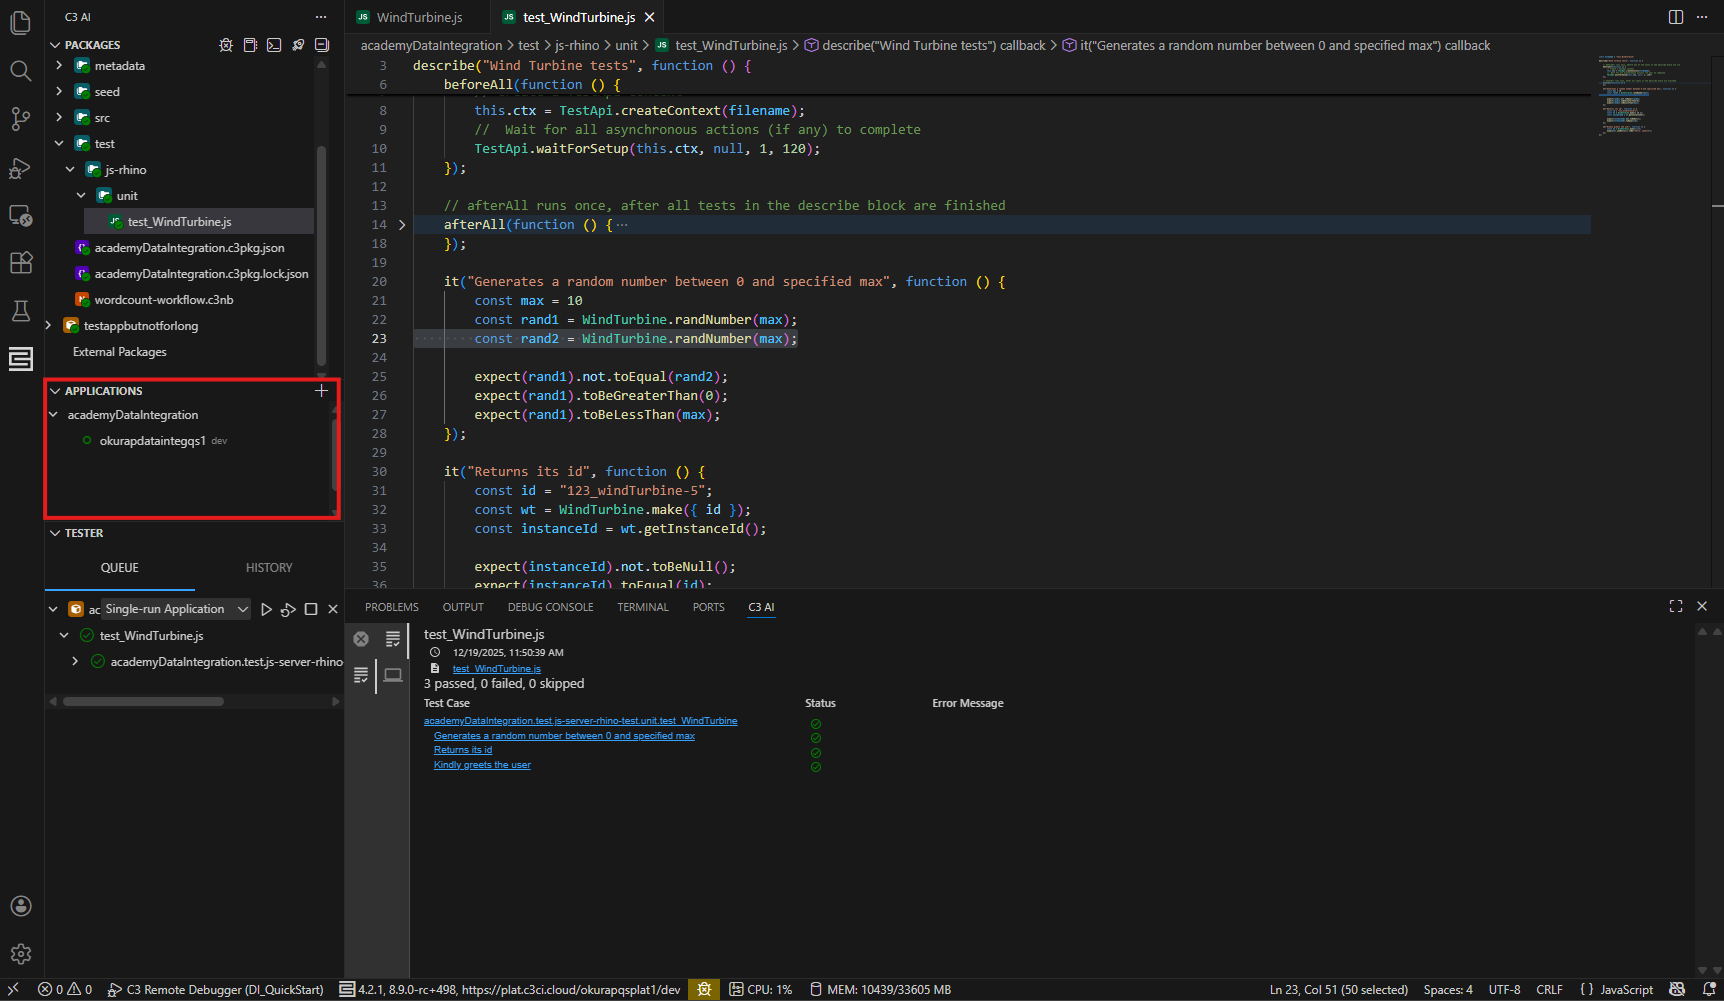
Application Explorer
The application explorer is a management hub for applications in your environment.
 |
|---|
| Application Explorer View |
Manage an existing application
Right-click on an application name to open a context menu, where you can:
- Launch the application (or terminate if it is running).
- Start and stop UI bundling, or open your application's bundled UI if you have one.
- Create a new notebook or REPL (Read-Eval-Print Loop) session
- Navigate to the static console
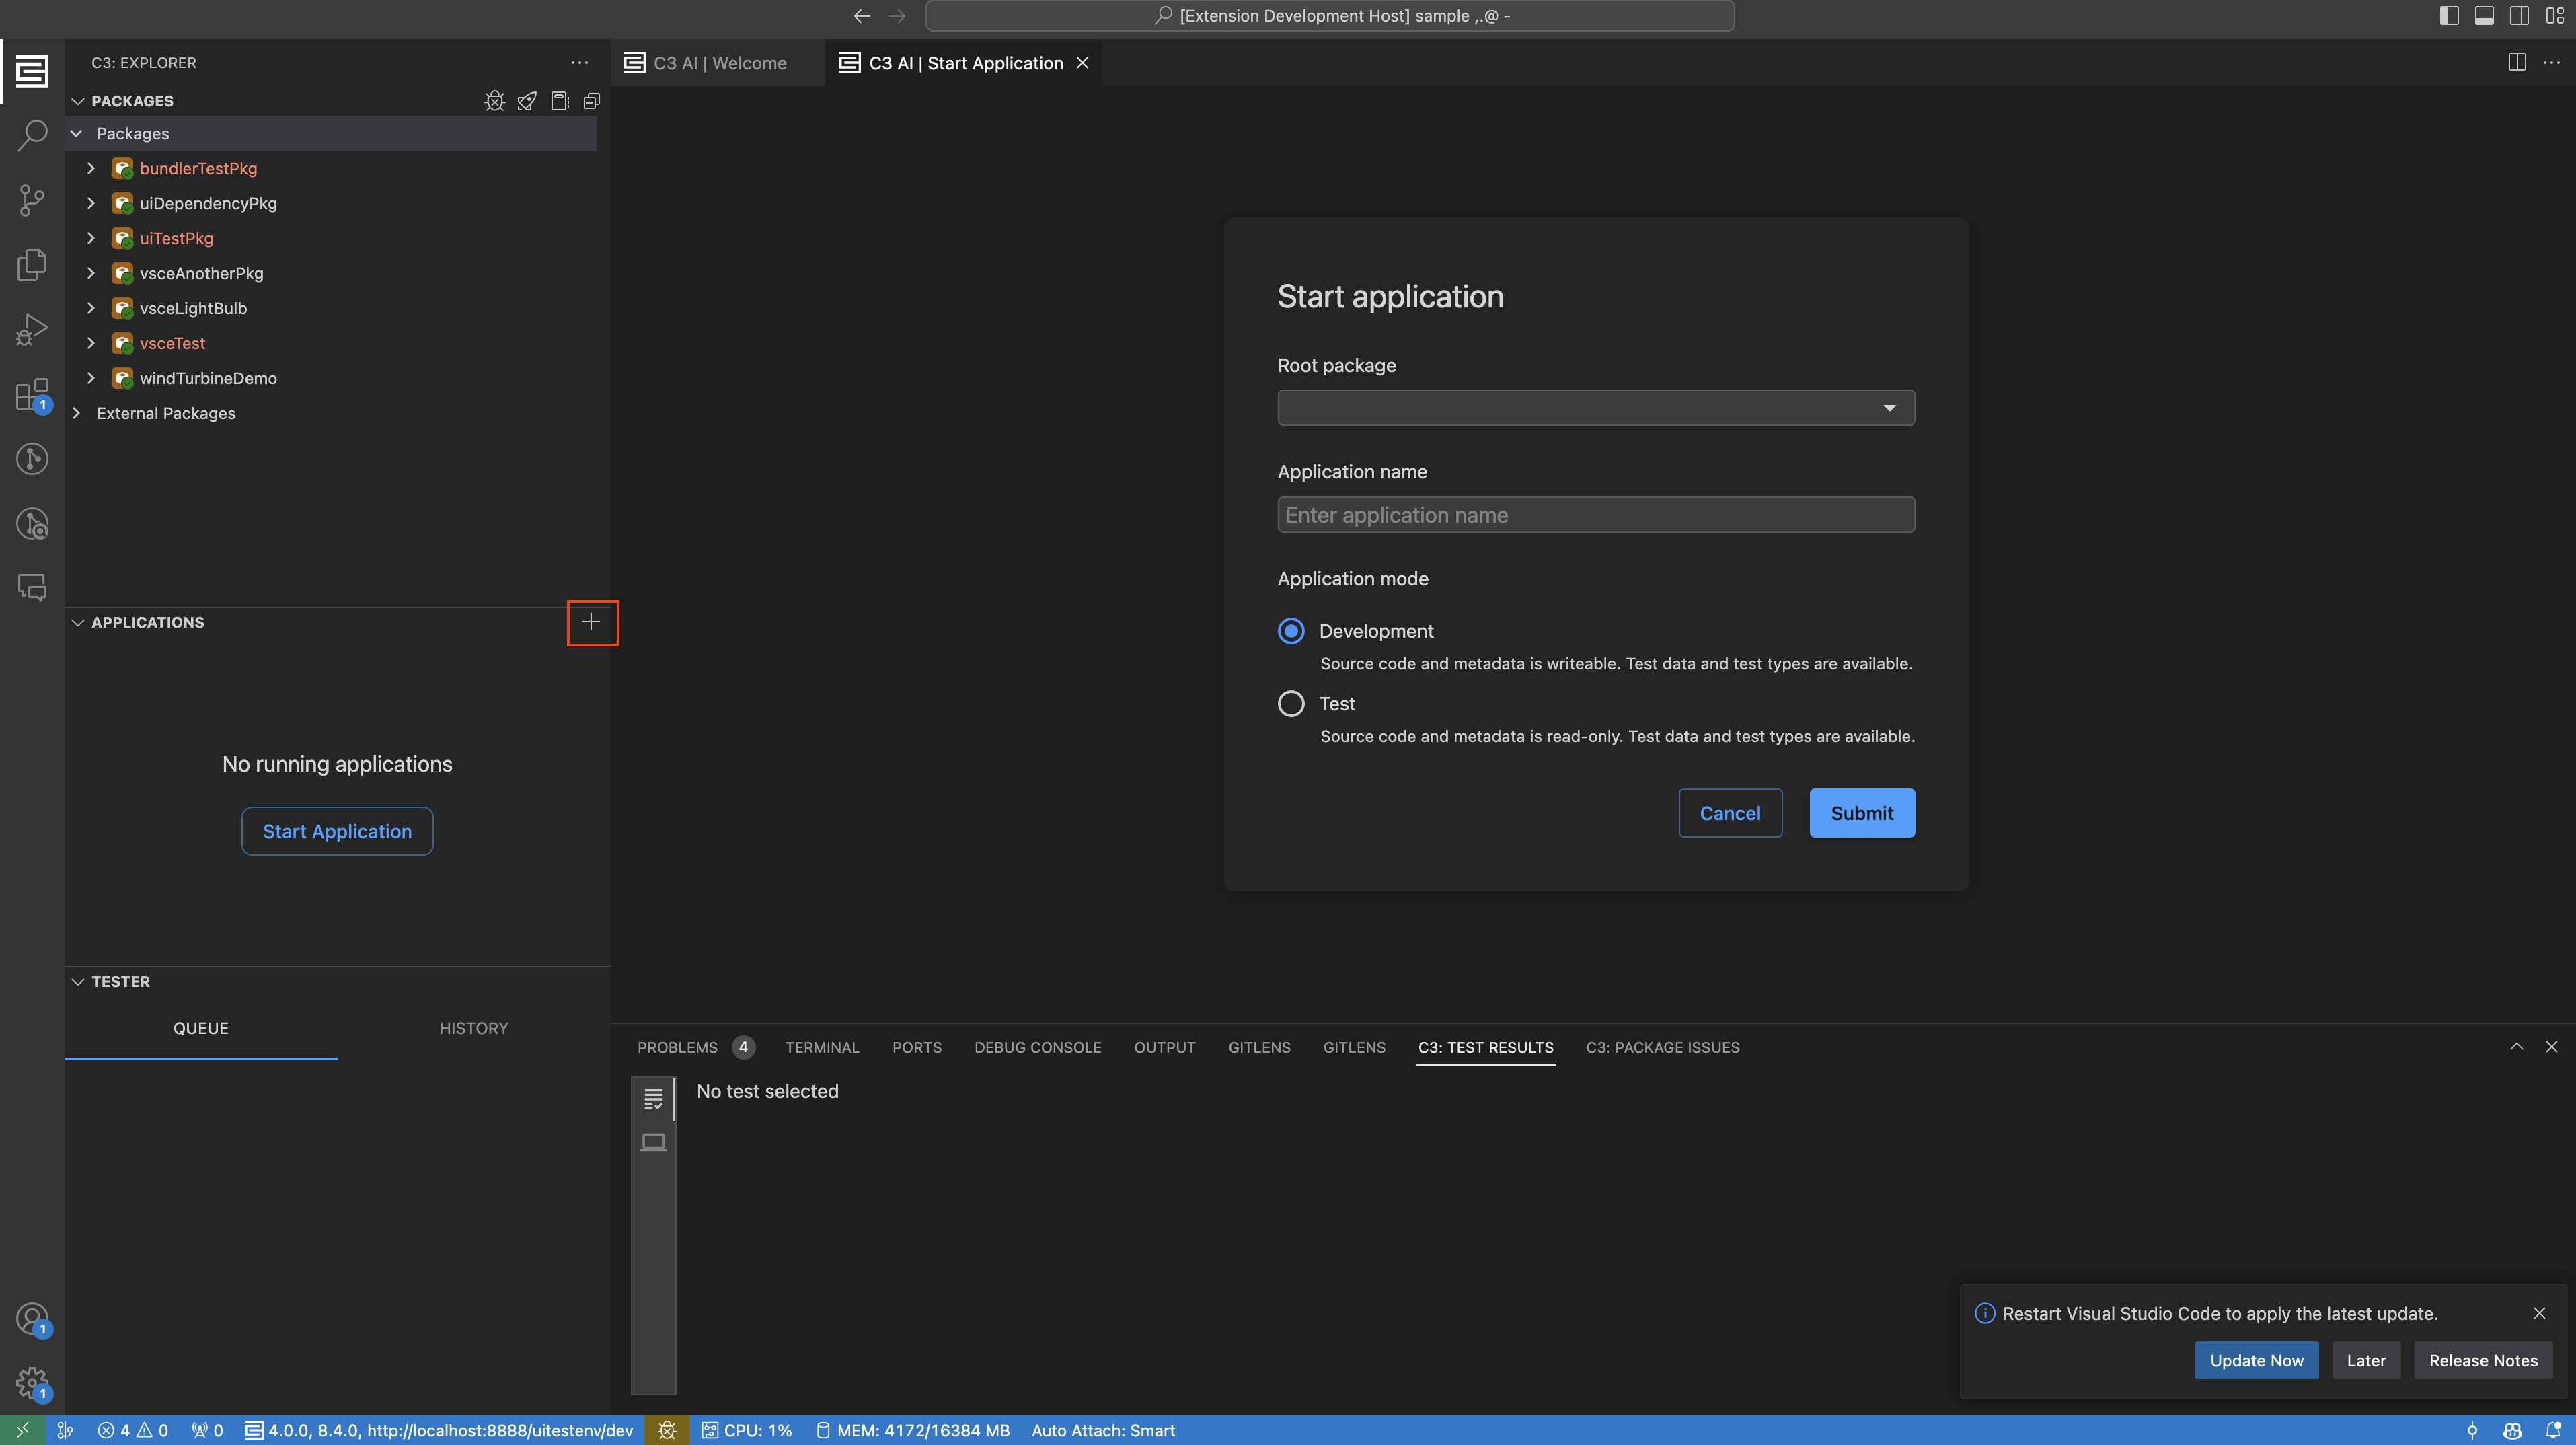
Create or connect to an application
Select + to initiate a new application. This reveals the C3 AI | Start Application form.
Use the Start Application form to select a target package in your current workspace, specify the application name, select an application mode.
 |
|---|
| Start Application Form |
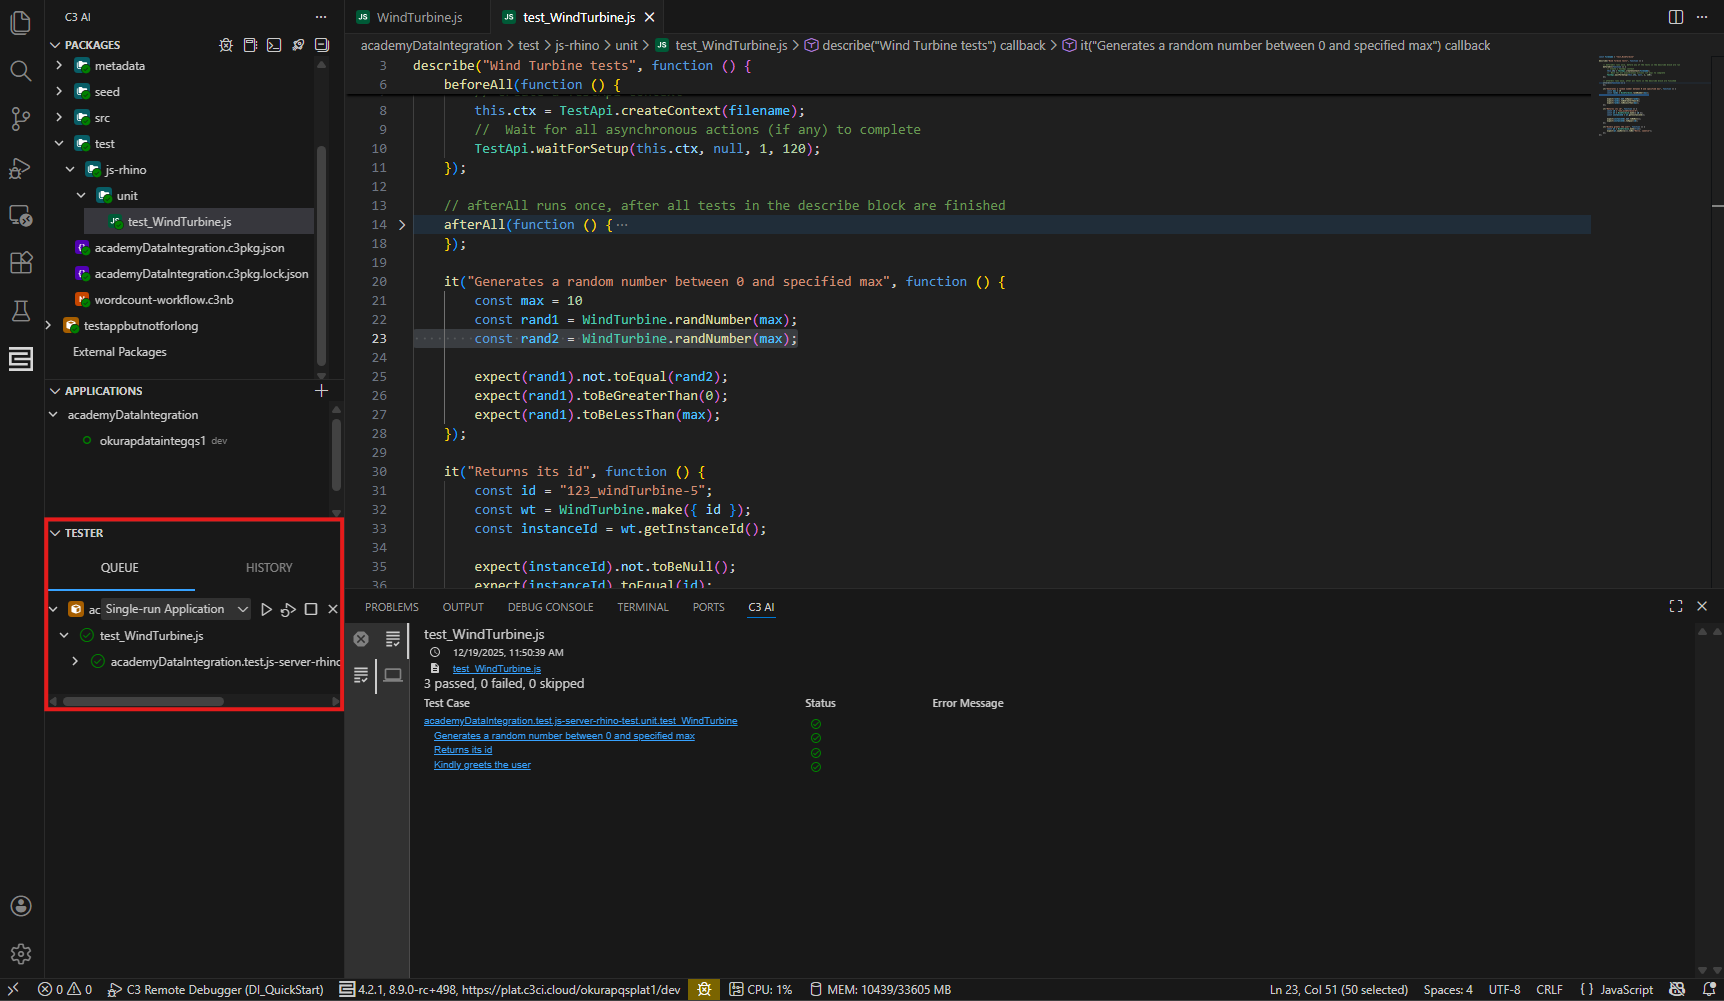
Tester
The Tester panel covers test management, and shows a history of the last 10 test runs
 |
|---|
| Tests Queued in Tester |
The tester panel has 2 tabs: Queue and History.
Tester Queue
Use the tester queue to:
- Queue a list of test files to run
- Execute or manage the lifecycle of individual test files
In tester, you can run your test(s) in "single-run application". This creates a new isolated and temporary application to run tests. When the test is complete, the application is terminated. This process does not impact the current set of running applications.
Test History
Use the test history tab to review the results of the last 10 test files that ran. Select a specific test file result to view detailed results in the Output tab.
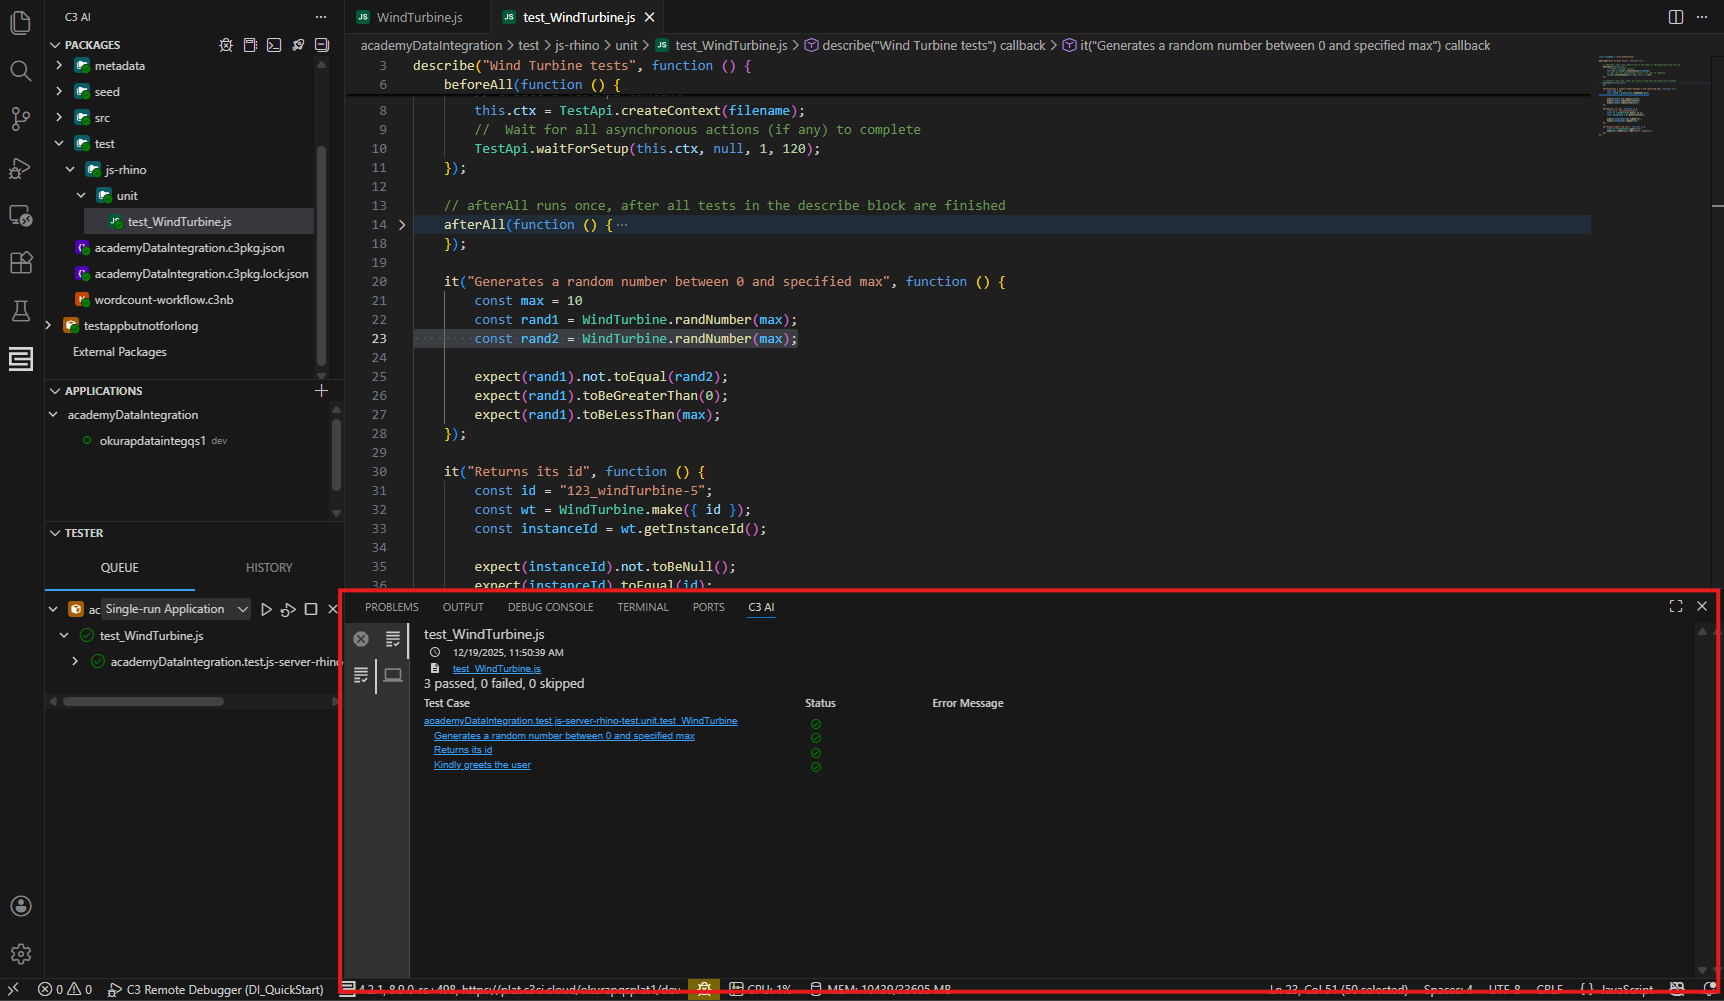
Bottom C3 AI Panel
The bottom panel contains a few tabs of interest to C3 developers:
- C3 AI: Syntax errors in synced files, or test results. You can keep this open as you make changes within your application.
- Output: Logs from C3 Server, the C3 Extension, or C3 Python Interpreter. Select a target output using the tab's filter input or dropdown menu.
Syntax errors and stack traces can also be found in the Problems tab.
 |
|---|
| C3 AI VSCE bottom panel |
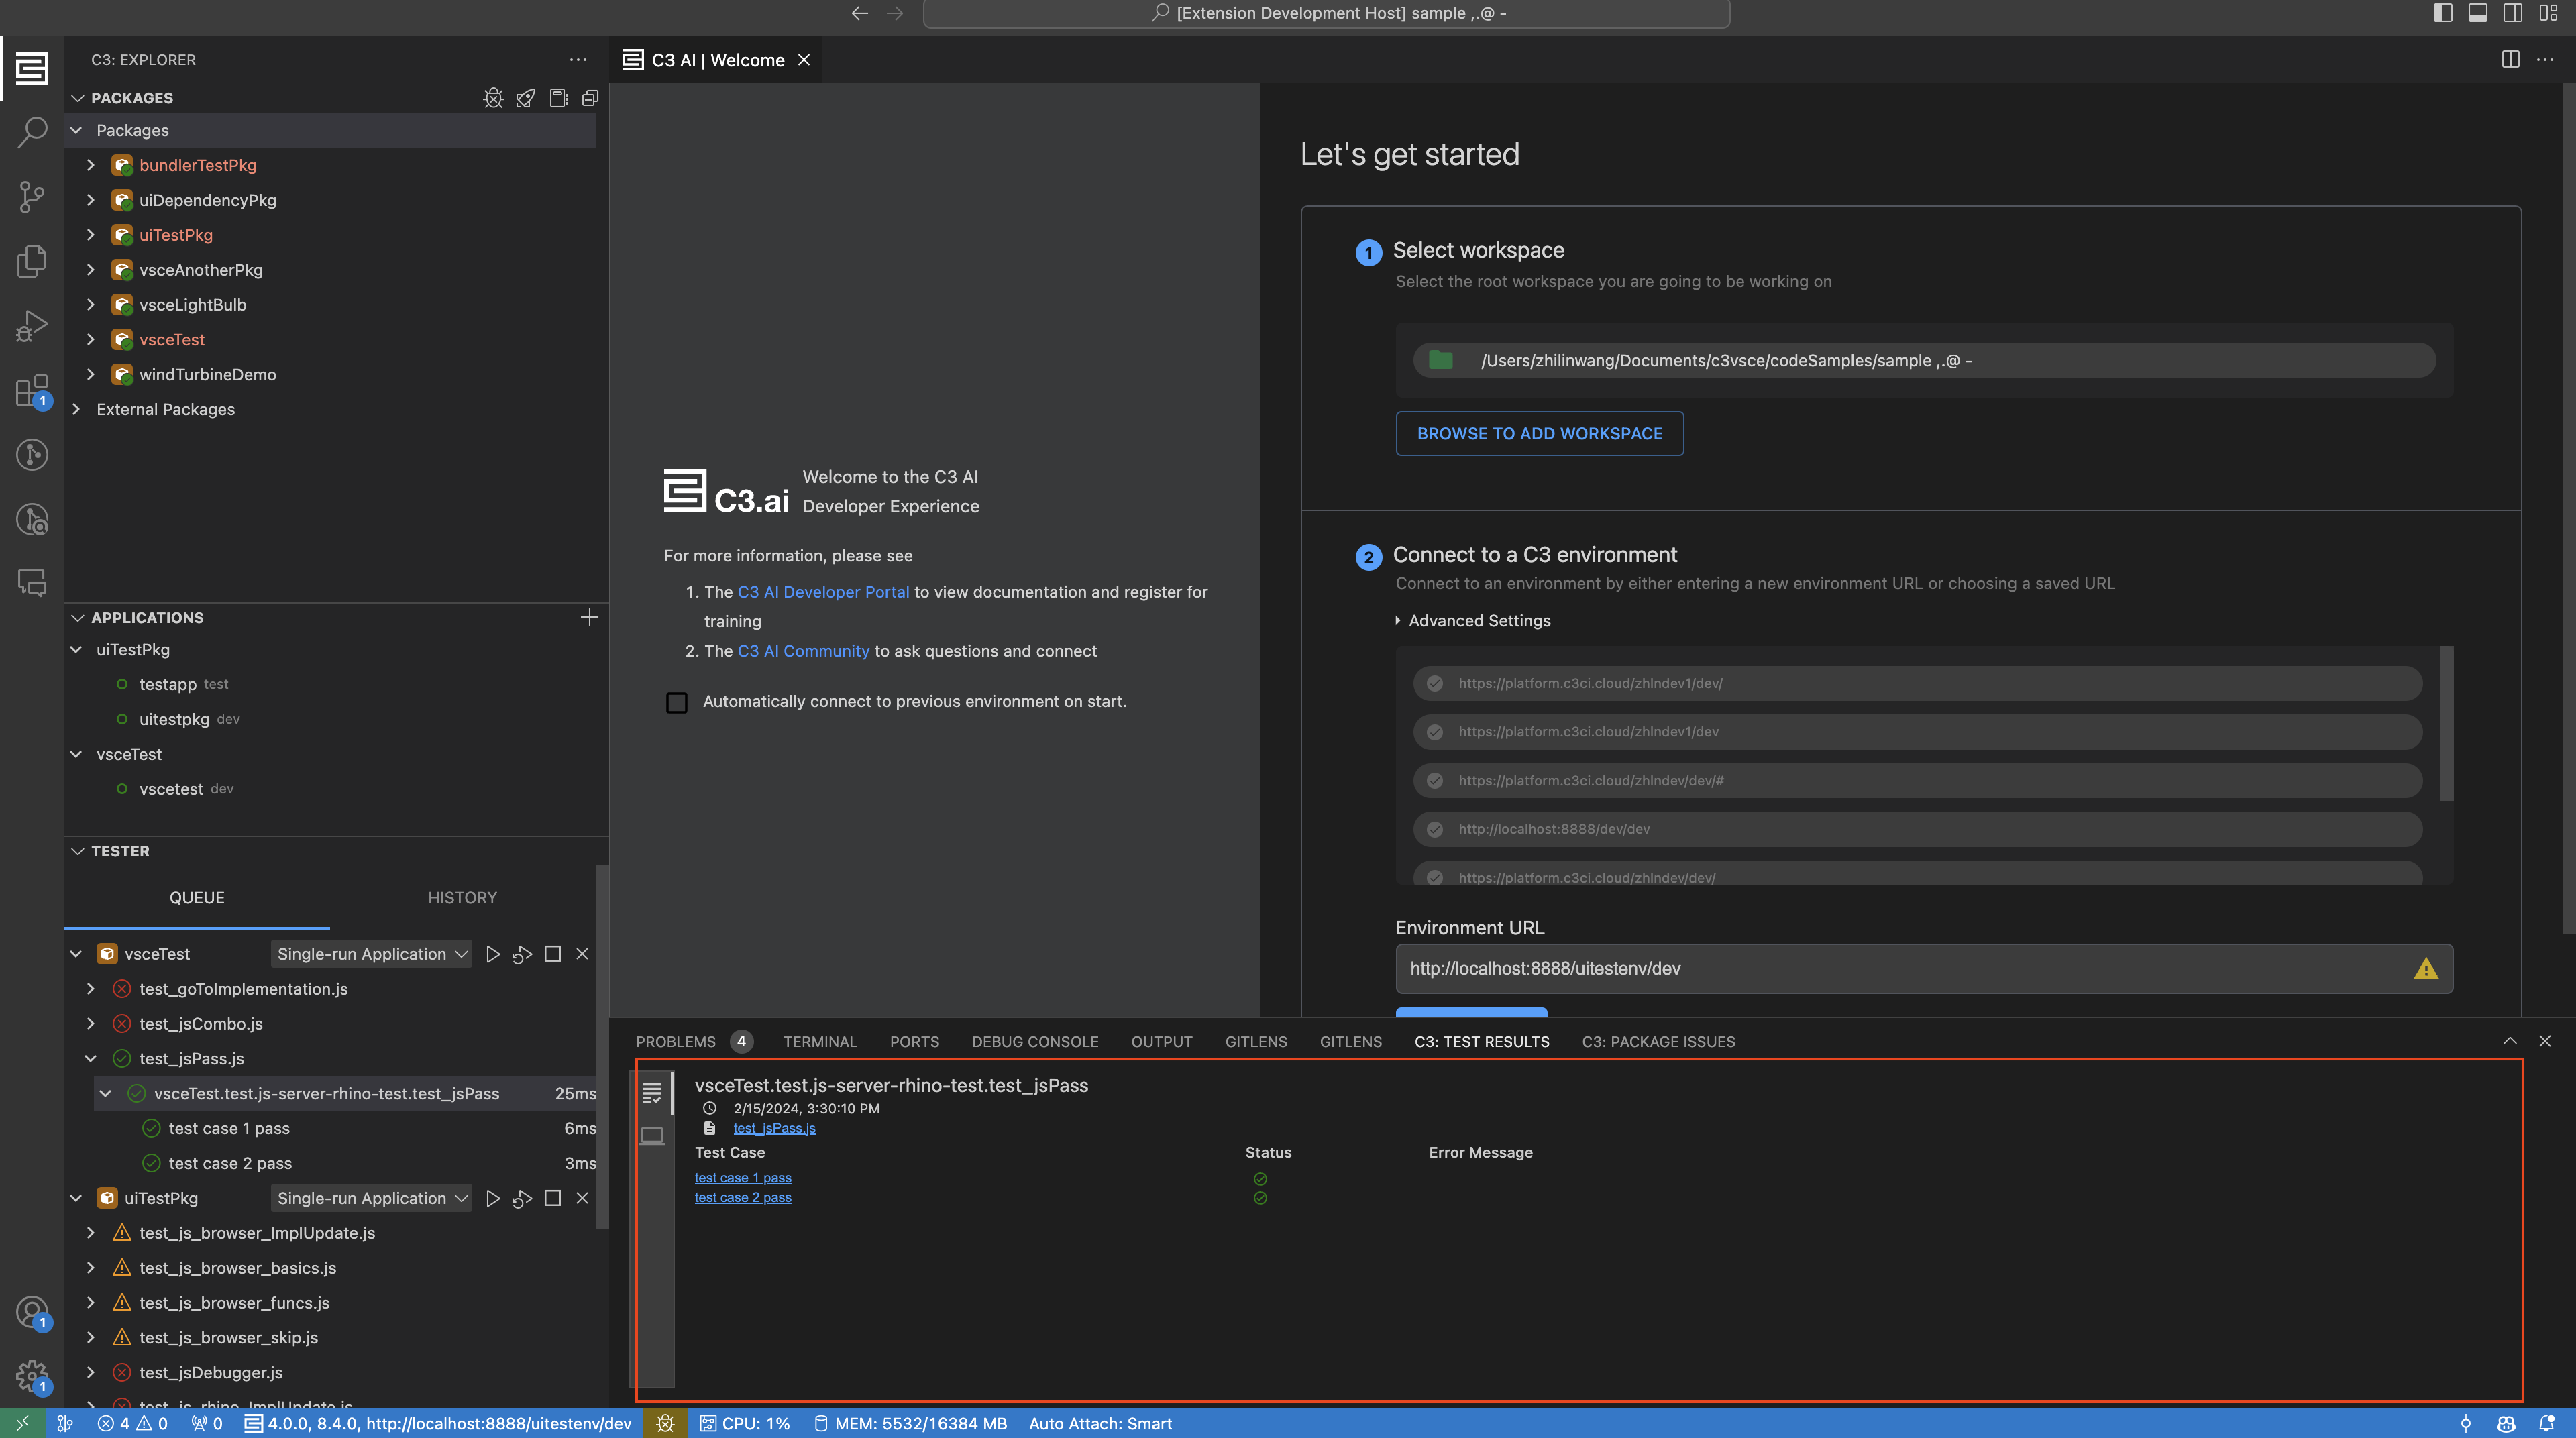
Output
This tab provides two views, one for the test results and the other for server logs. The first view provides the status and results of any tests that you run. If there is an error the line where the error is located is presented. The second view outputs a server log snapshot of the test run.
 |
|---|
| An example of a test result output tab |
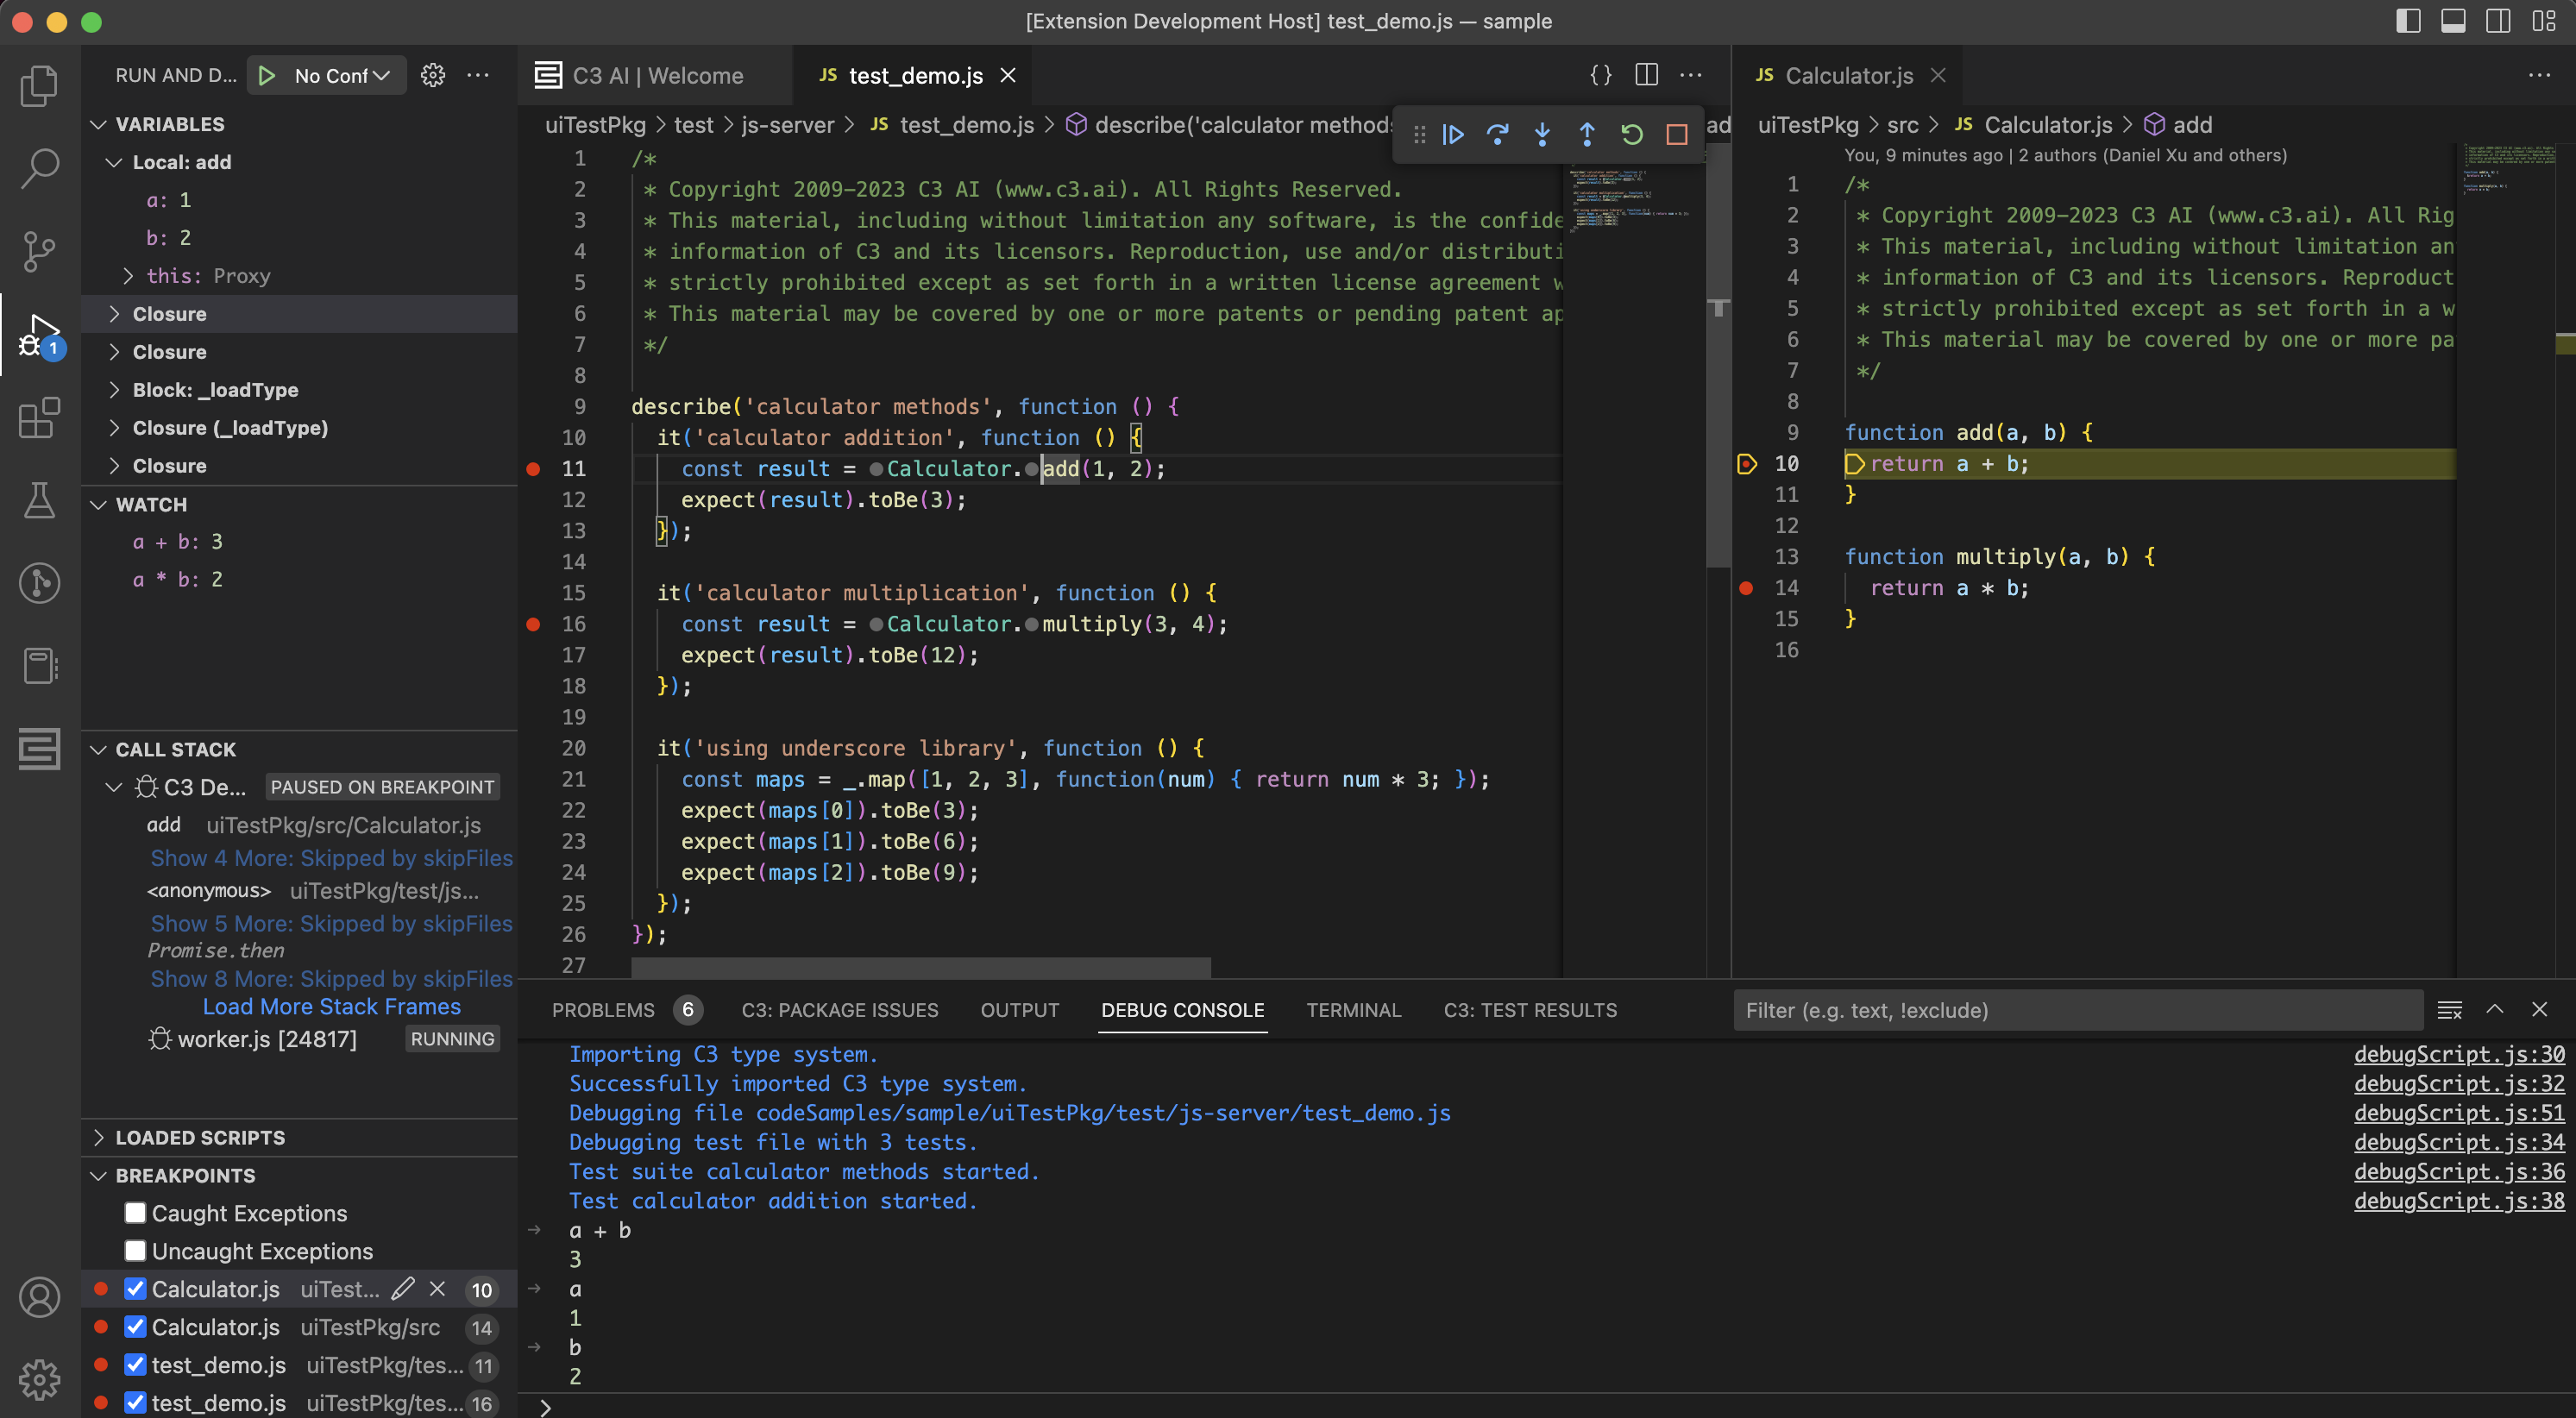
JavaScript (JS) Debugger
In addition to running tests, users can also debug individual test files. This currently only supports JavaScript test files using Jasmine.
To start the debug session:
- Place breakpoints in the test file and Javascript files you are trying to debug.
- Hover over a related test file and select the Debug test file button
- For repeated debugging of the same file, hover over the file and select Add test to test queue. Then click the Debug test file button from the test queue
A toolbar appears when the debugging session starts. Restart and Disconnect icons affect the debug session. Other icons affect the line-by-line execution of the program. For more information on these icons, see Debug Actions.
Go to the left side navigation, Run and Debug tab, to use the debugging functionality and view information like:
- Variables: Inspect and set variables at each scope, ordered by innermost to outermost scope. See Data Inspection.
- Watch: Watch both variables and expressions as the program is run.
- Call stack: Show the program's function call stack and hide unnecessary stack frames using skipFiles.
- Loaded Scripts: View the scripts loaded during the debug session.
- Breakpoints: View/edit/remove breakpoints placed. Conditional breakpoints are also supported.
In the panel tabs, go to the Debug Console tab to inspect complex objects with nested fields and evaluate expressions using REPL (Read-Eval-Print Loop) feature. The C3 AI debugger adds custom logs with information on tests starting, passing, and failing.
 |
|---|
| A debugging session in progress |
(Preview Feature) Debugging server-side methods: The C3 AI debugger provides an experimental feature that allows debugging of server-side methods and executes them in Node instead of on the server. To enable this behavior, breakpoints must be set on the JavaScript implementation file. All server-side methods on the file will be debuggable. This is supported for multiple files.
If you want to switch breakpoints within a set of files during a debug session, pause the debugger. Resume the debugger after the breakpoints are updated.
This may cause unintended errors during execution since not all server-side code is valid in Node. Remove the breakpoints on any affected files if errors occur.
Developer Utilities
The extension provides several C3 Type specific IntelliSense features including the following:
- Hover documentation: Hover over any reference C3 type file or keyword to see in-context documentation.
- Autocompletion: Receive type-ahead or autocomplete suggestions including the Types in your local workspace and remote environment.
- Jump to Definition/Implementation: Right-click to navigate to another type file or implementation file from the type file you are within (you can cmd + click as well).
- Peek Definition/Implementation: Right-click and preview a Type file or implementation file within your code without opening a new tab.
- Package error-check: See any package errors as you type and save.
Before you jump into editing methods, ensure that your TS/JS Server is initialized. This will show up in the bottom status bar when you first open a JavaScript file after the completed initial sync. See the following image.
 |
|---|
| Initialization of the TS/JS Server |
Notebook
The VSCE provides a C3 notebook, which is an implementation of a VS Code notebook. A notebook contains cells that you can run your code in. The supported languages in the C3 notebook are JavaScript and Markdown. Connect to an application in your remote environment with a notebook and run actions in the context of this application.
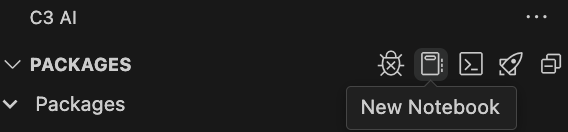
To create a new notebook, click the notebook icon in the package explorer as shown below.
 |
|---|
| Creating a notebook from package explorer |
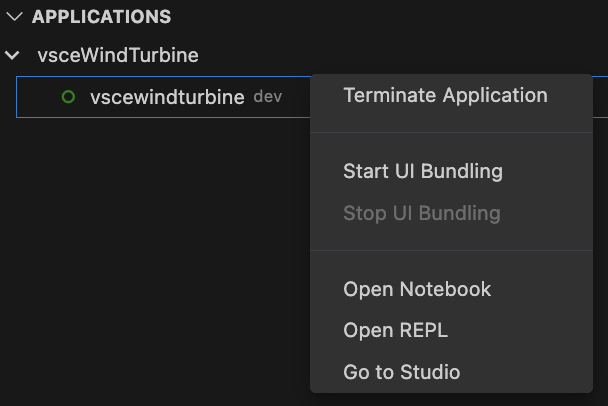
Alternatively, you can right click on an application in the Application Explorer and select "Open Notebook".
 |
|---|
| Creating a notebook from app explorer |
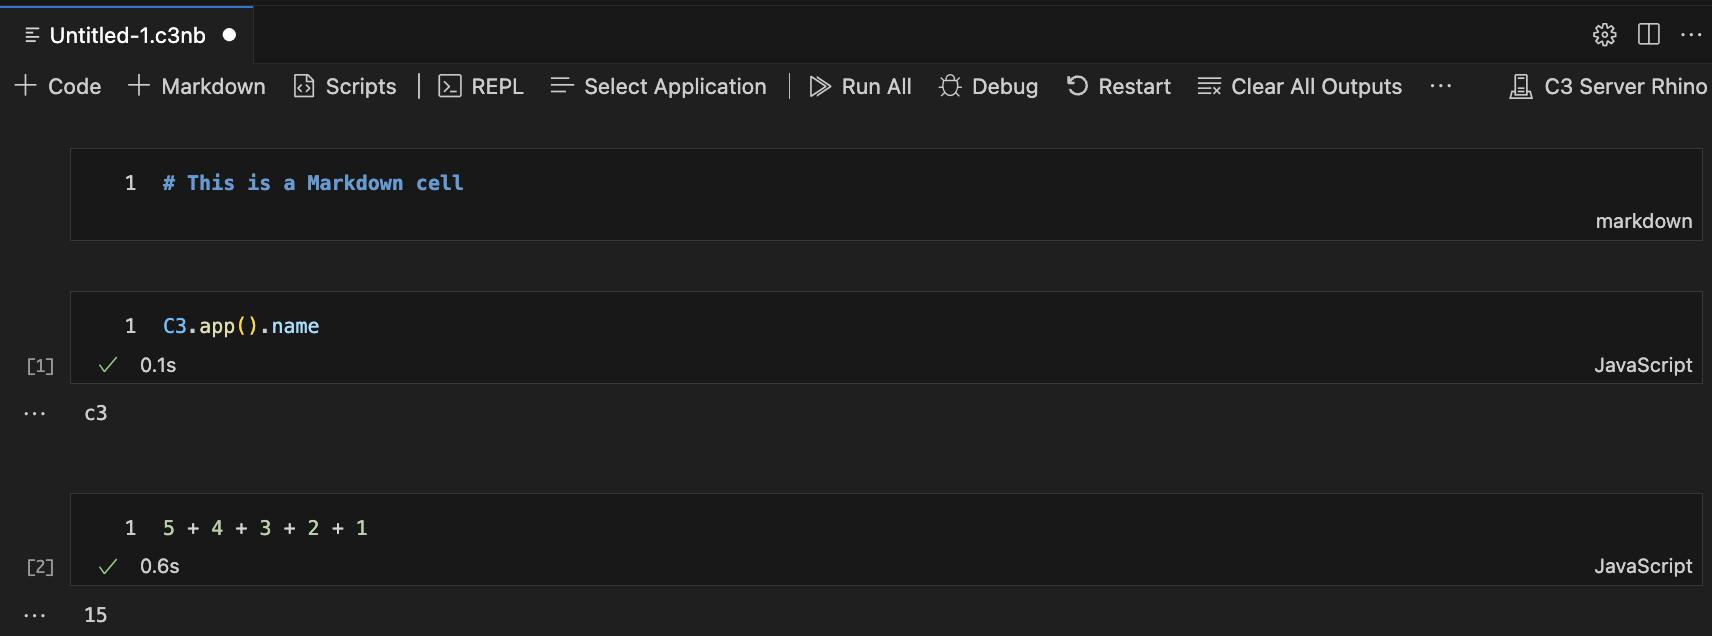
Once in the notebook, you can write Markdown and JavaScript code in the notebook cells. Below is a notebook with some example cells.
 |
|---|
| Notebook example |
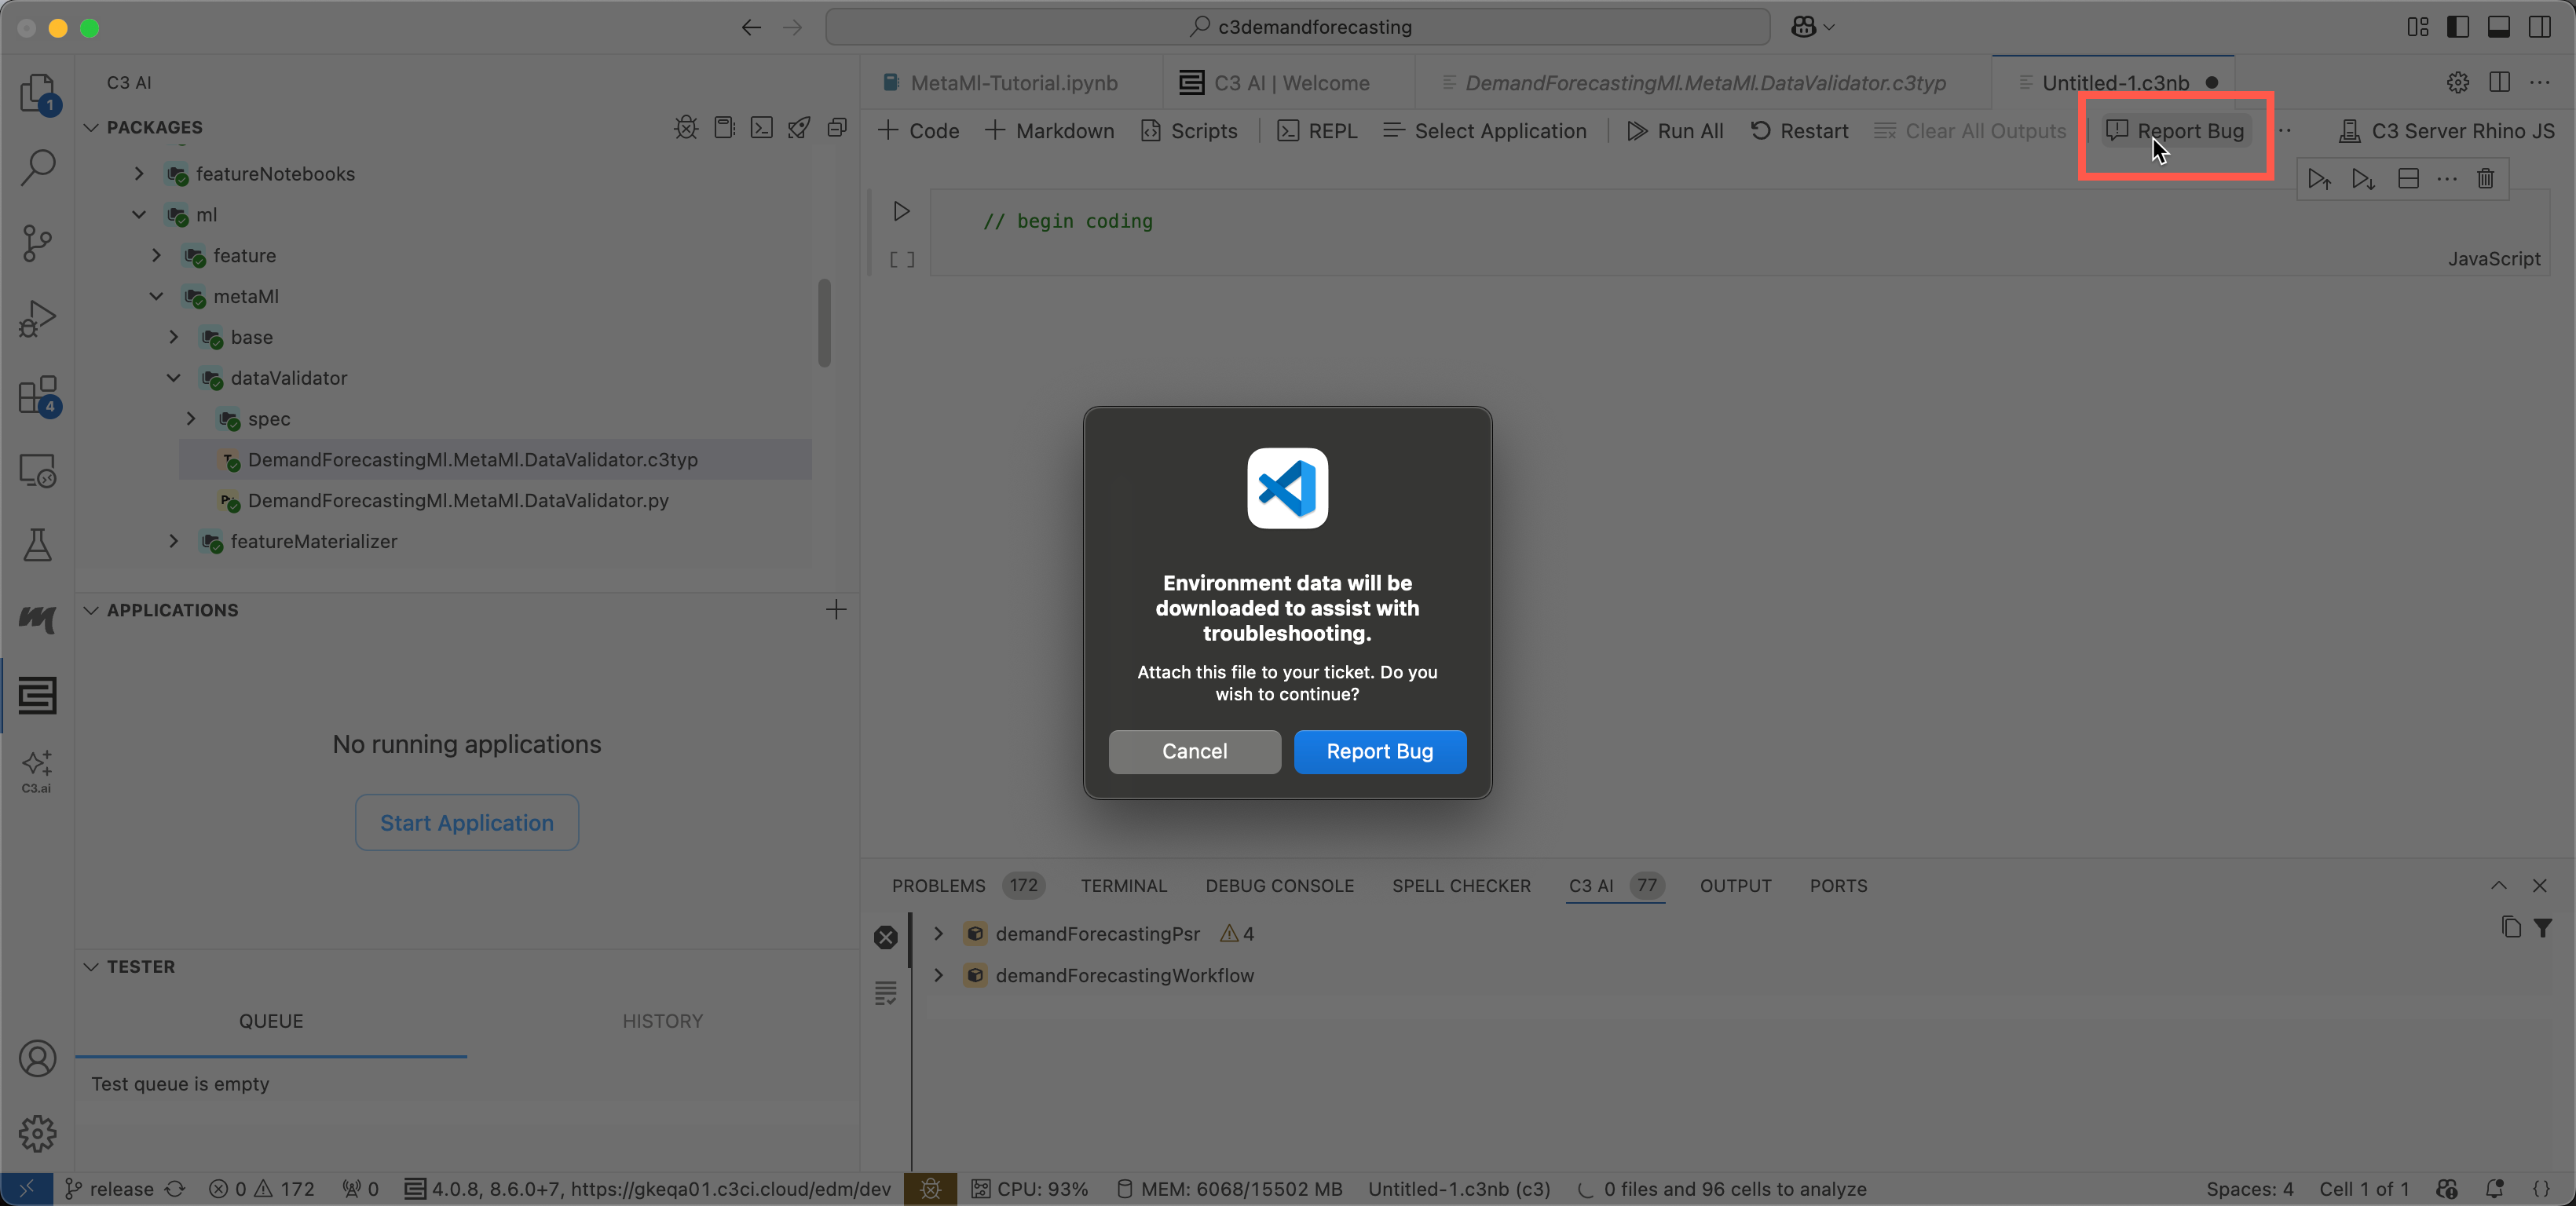
Report a bug from the C3 notebook
When you report a bug from the C3 notebook, the tool automates the collection of configurable diagnostic data, like source code, notebooks, server logs, and environmental metadata. You can share the exported data to analyze it further.
To report a bug from the C3 notebook, perform the following steps.
- From the C3 notebook, select Report Bug in the upper right corner.
- Select Report Bug to send the data to C3 AI.
Toolbar Overview
| Option | Description |
|---|---|
+ Code | Adds a new code cell which can run JavaScript and has C3 Type System initialized. |
+ Markdown | Adds a new markdown cell. |
Scripts | Allows for running a custom JavaScript script that is run before running any notebook cells. See Scripts for more details. |
REPL | Opens a new REPL. See REPL for more details. |
Select Application | Selects the application context used to run notebook cells. Changing the context clears all defined variables, similar to restarting the notebook. |
Run All | Sequentially runs every cell in the context of the connected application. |
Debug | Enables the ability to pause on breakpoints set within the notebook. This only applies for the Node.js notebook. |
Restart | Restarts the notebook and clears all defined variables. Creates a new connection to the selected application and runs all custom scripts. |
Clear All Outputs | Clears the cell output for each cell in the notebook. |
... | Opens advanced notebook settings such as toggling line numbers or modifying extension notebook settings. |
C3 Server Rhino | The currently selected notebook kernel. Click this to change the current kernel. See Supported Kernels for more details. |
Supported Kernels
A notebook kernel is responsible for running code that is written in a code cell. The C3 notebook currently supports two JavaScript kernels:
- C3 Server Rhino: Code is ran in C3 Server directly in a session that lasts for a few hours. If the session expires with the error message
Error invoking Java method Js.TurboJsSession#execute, please restart your notebook. - C3 Client Node.js: Code is run using the version of Node.js on your computer. The C3 Type system ensures that C3 actions are run in the correct action engine.
The default kernel is C3 Server Rhino. To change the currently selected kernel, click on the button in the top right and select the desired kernel in the dropdown.
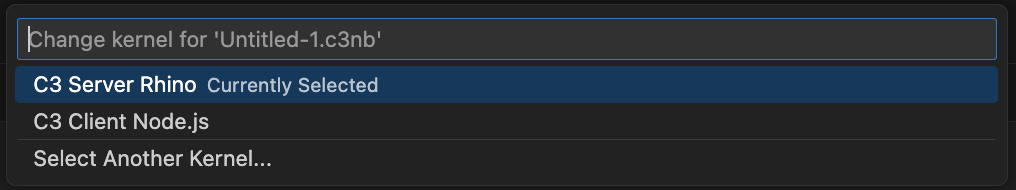 |
|---|
| Changing notebook kernels |
If the option for C3 Client Node.js is not visible, click on Select Another Kernel and C3 AI and select the Node.js kernel. Only notebook kernels that were used recently will show up in the list of notebook kernels.
REPL
In addition to the C3 notebook, the extension also offers an alternative way to run code called REPL. The C3 REPL is useful for running commands quickly and uses the same notebook kernels as the C3 notebook. It also supports accessing the previous command using the up arrow key.
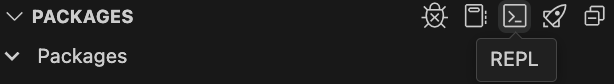 |
|---|
| Opening REPL |
Similar to the notebook, you can open a REPL from the package explorer or from the application explorer. To run commands in a REPL, write your code in the dedicated code cell at the bottom of the page. Note that REPL only supports code cells.
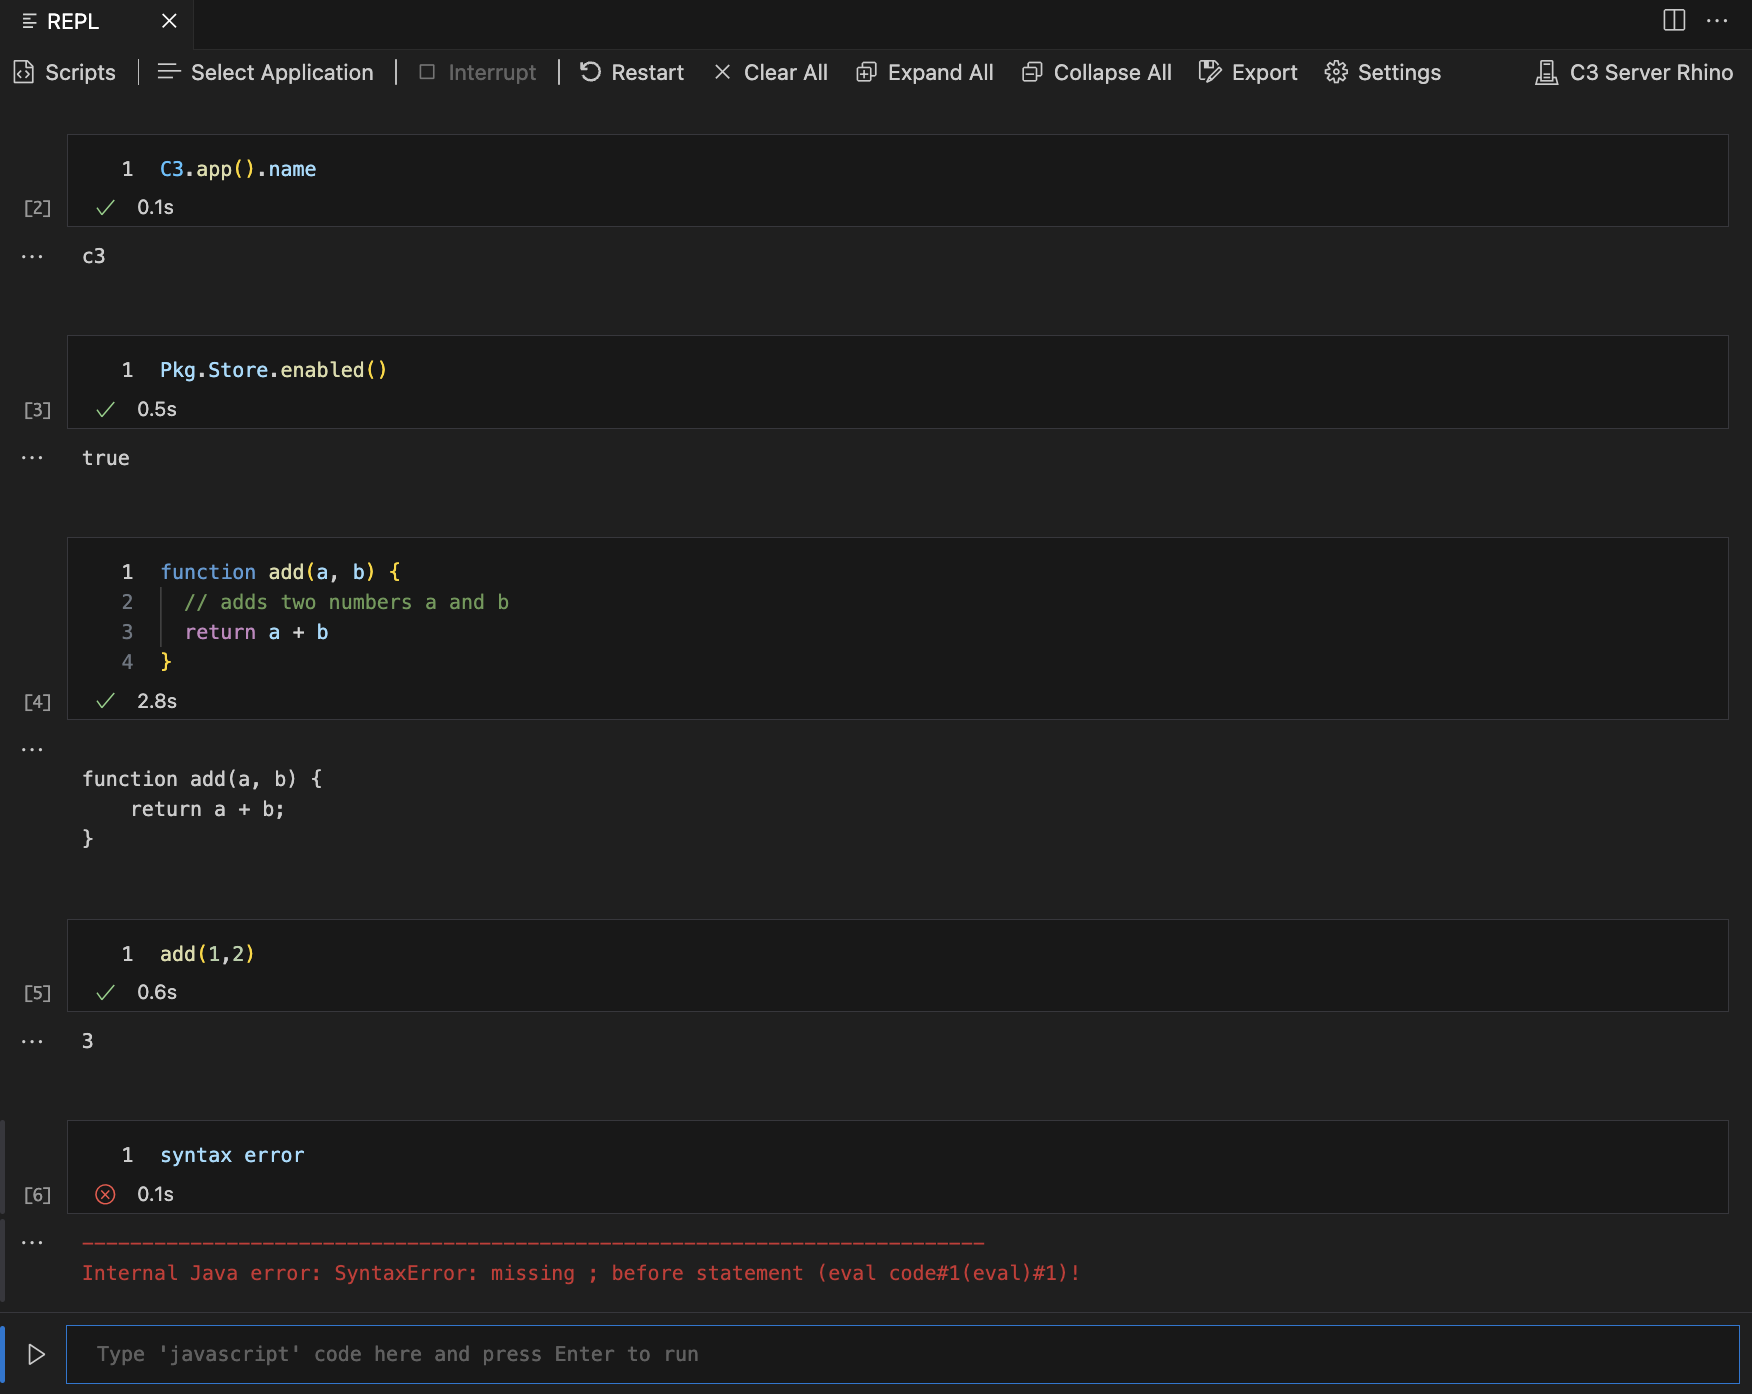 |
|---|
| Example REPL |
Visualizations
In addition to basic outputs, the C3 notebook supports interactive visualizations. To visualize documentation for a C3 type, run a cell with the name of the type. You can navigate to links for other C3 Types in the documentation view.
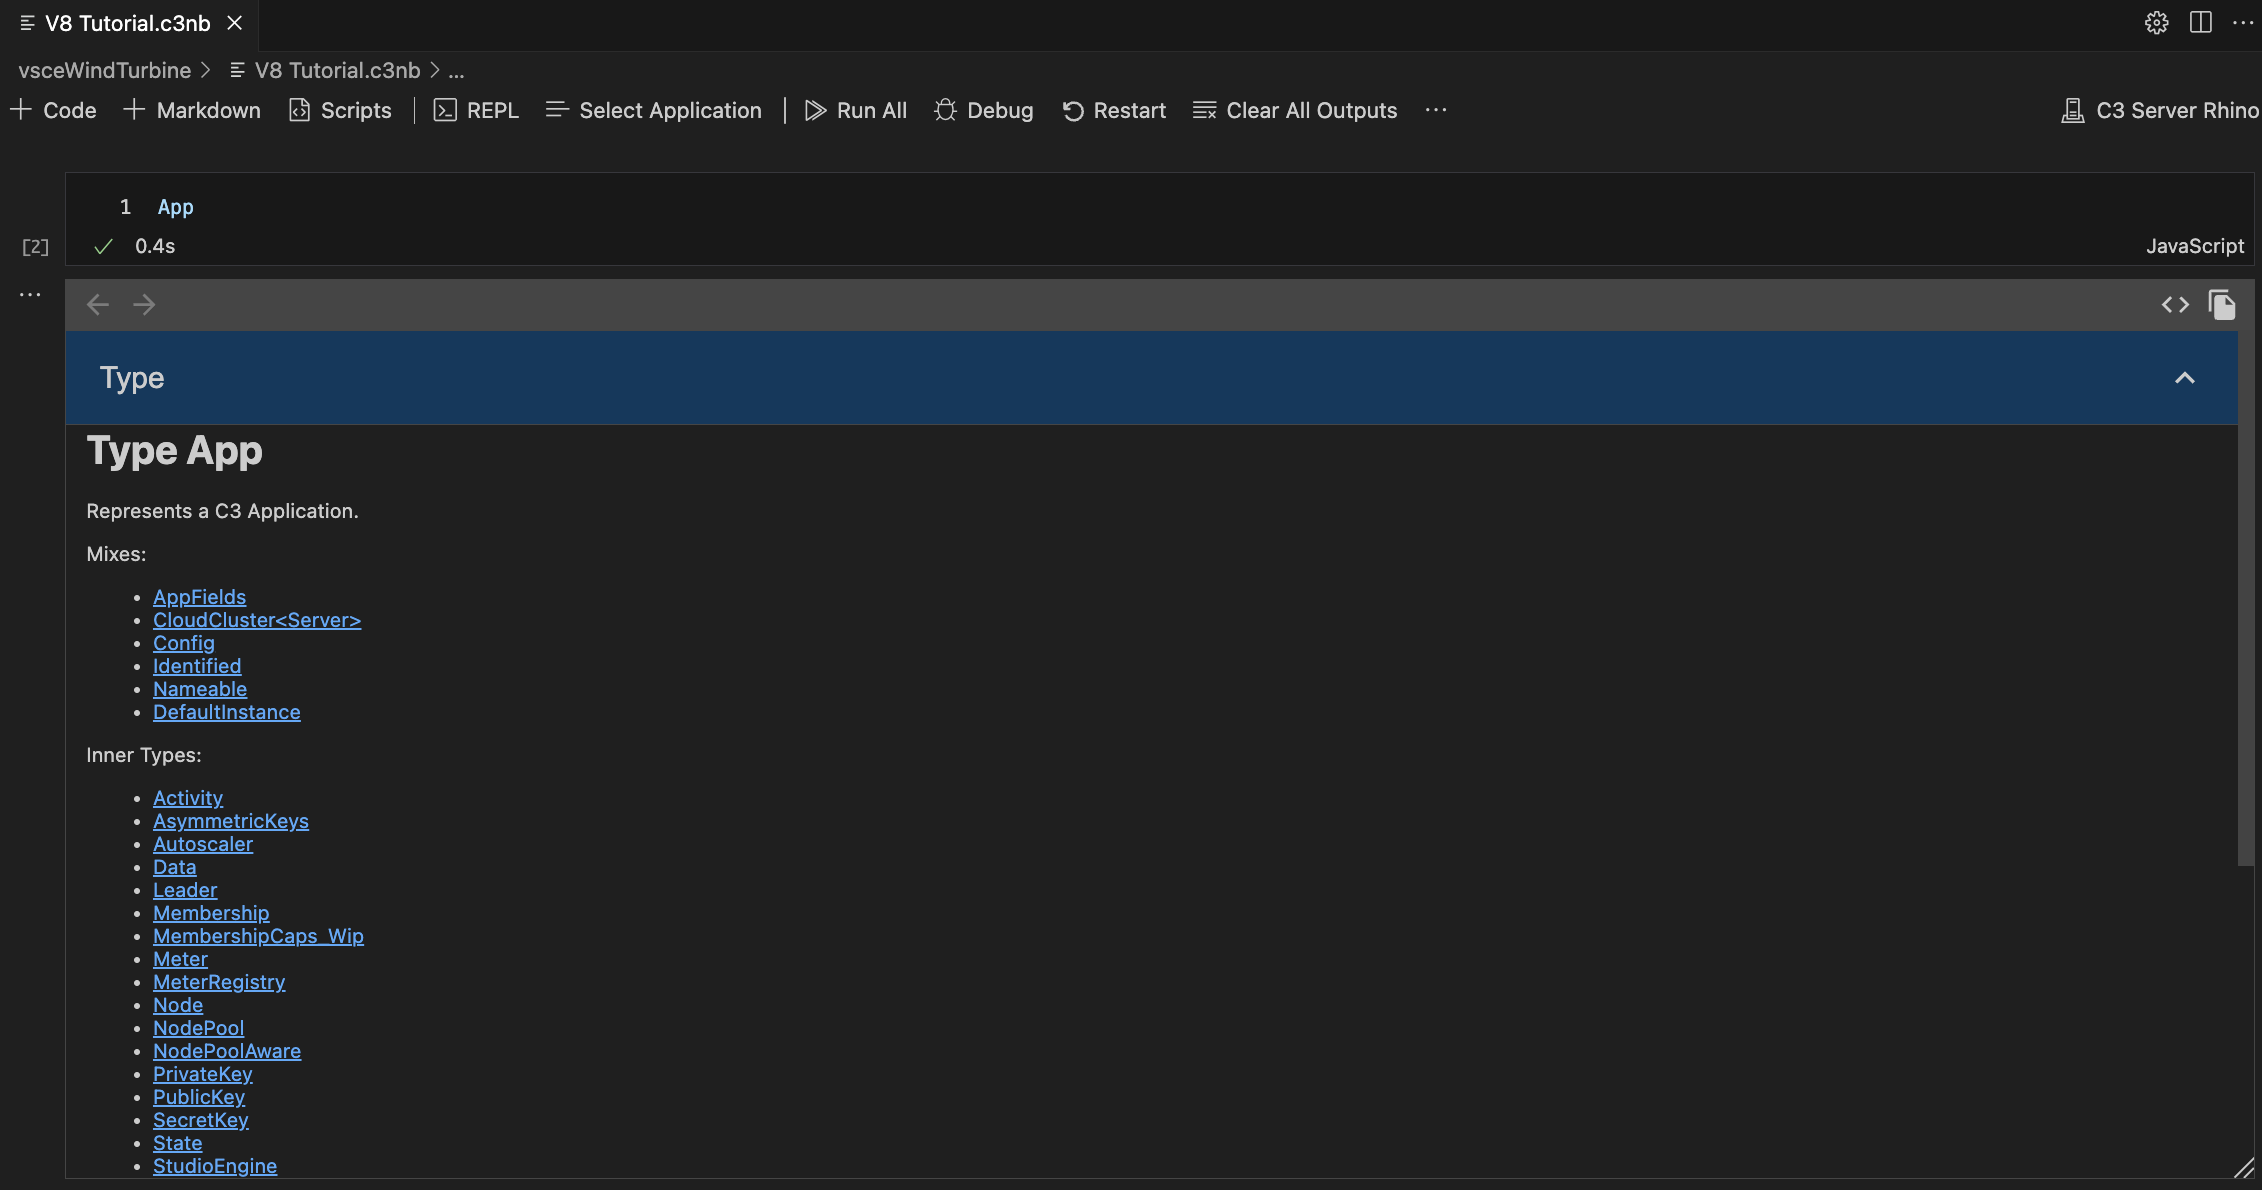 |
|---|
| C3 AI Type Documentation |
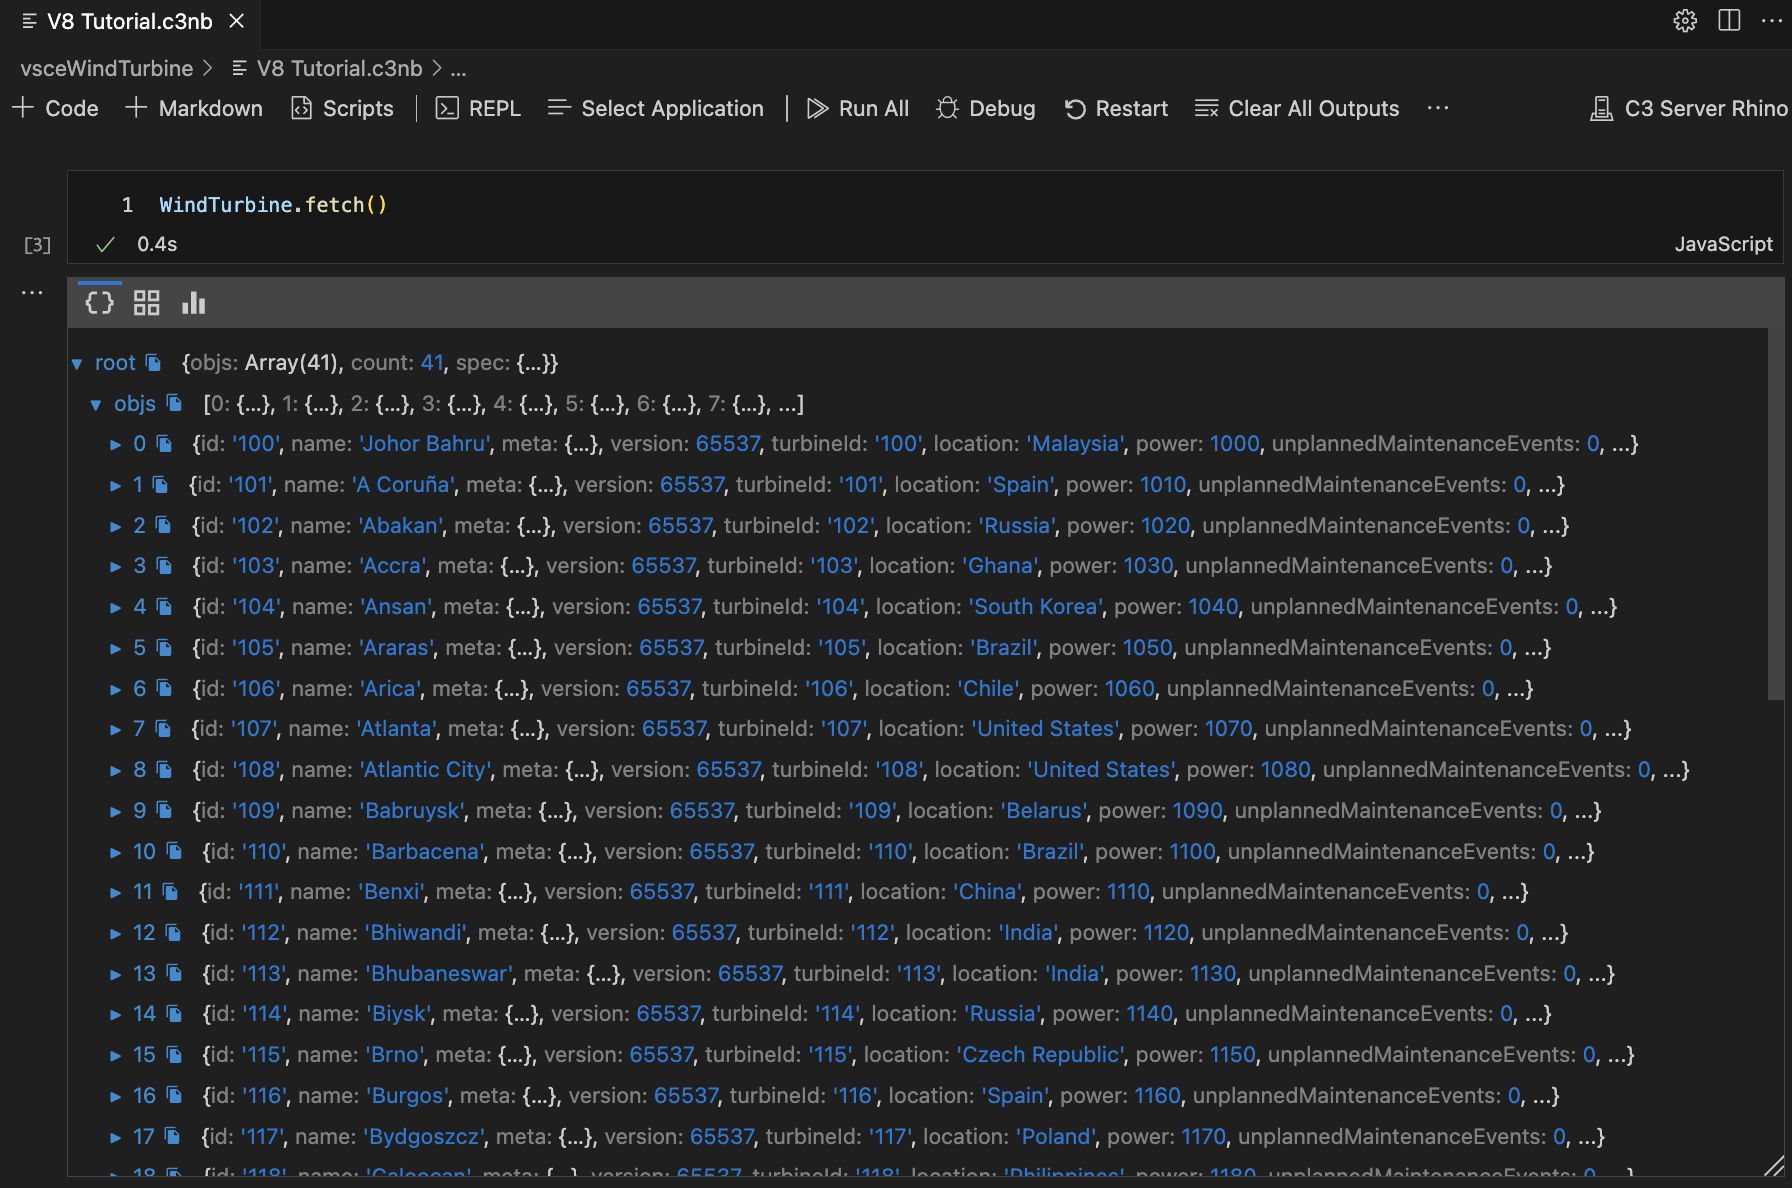
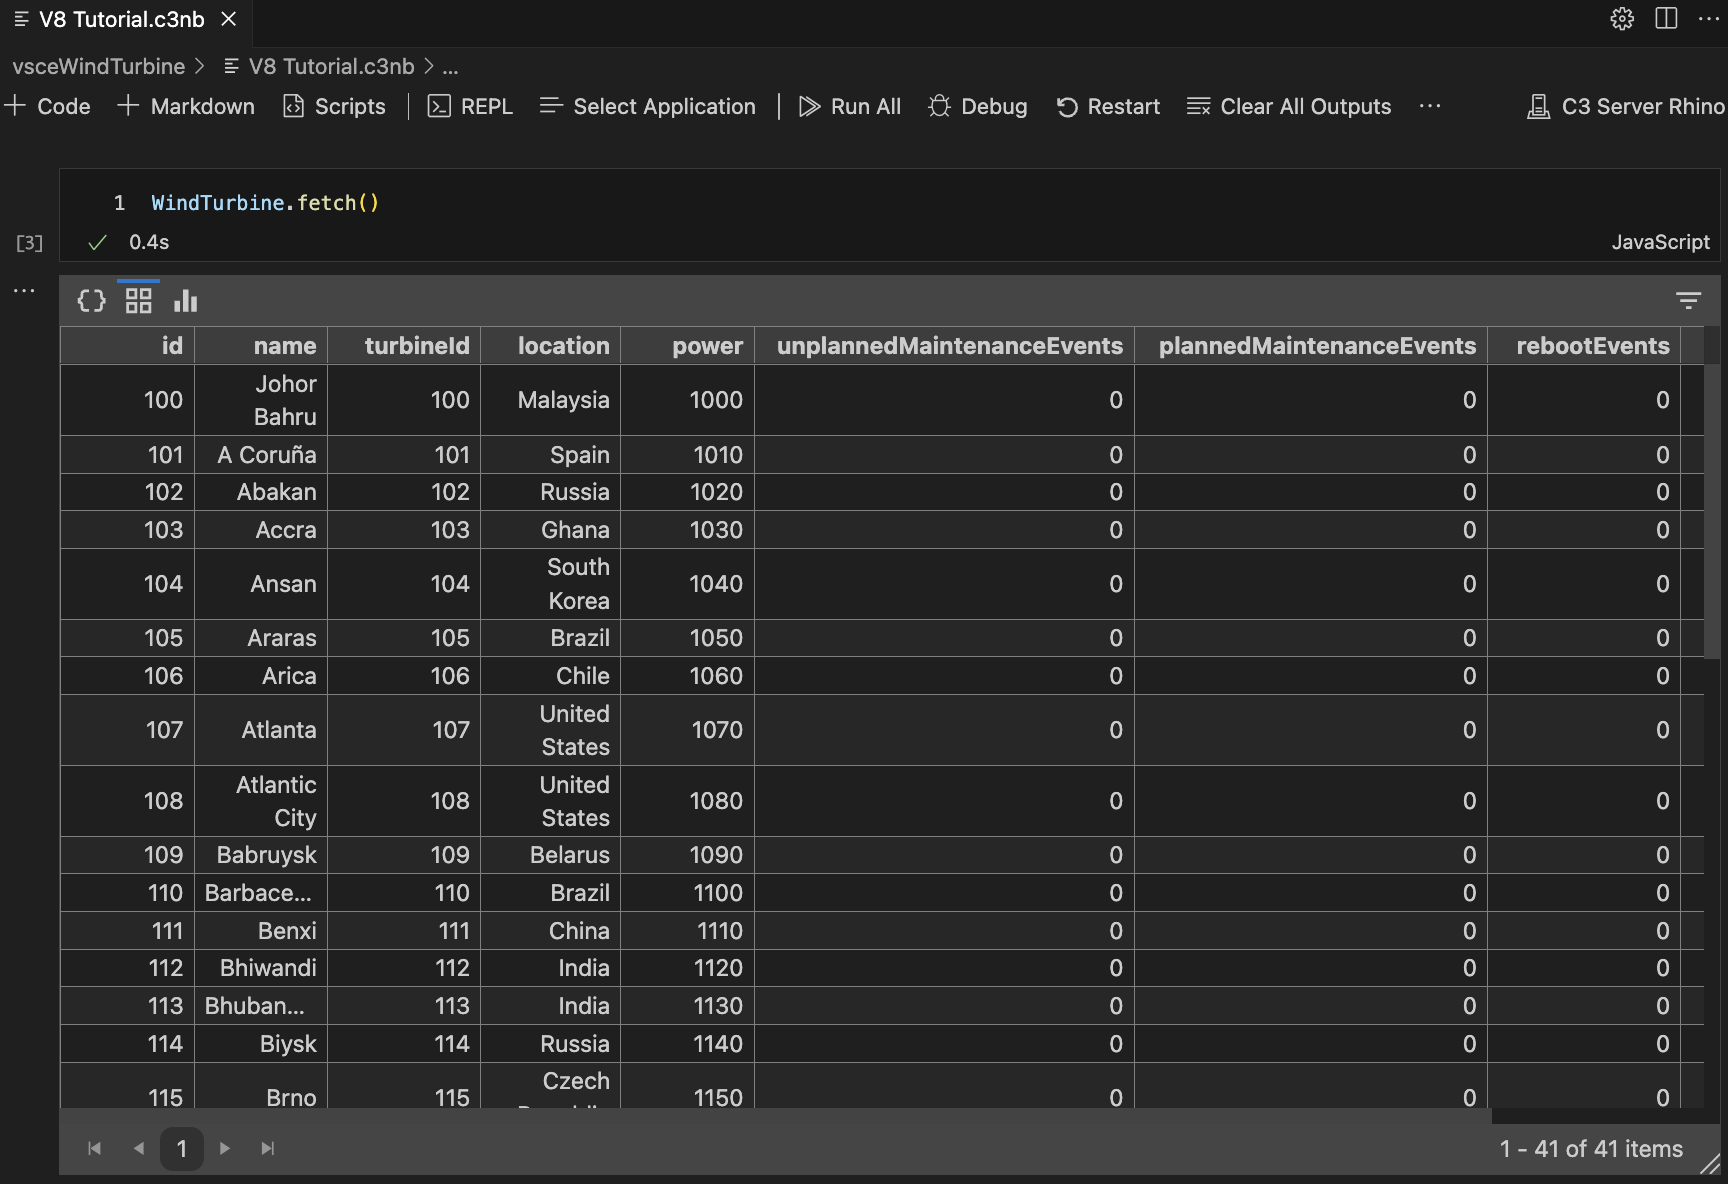
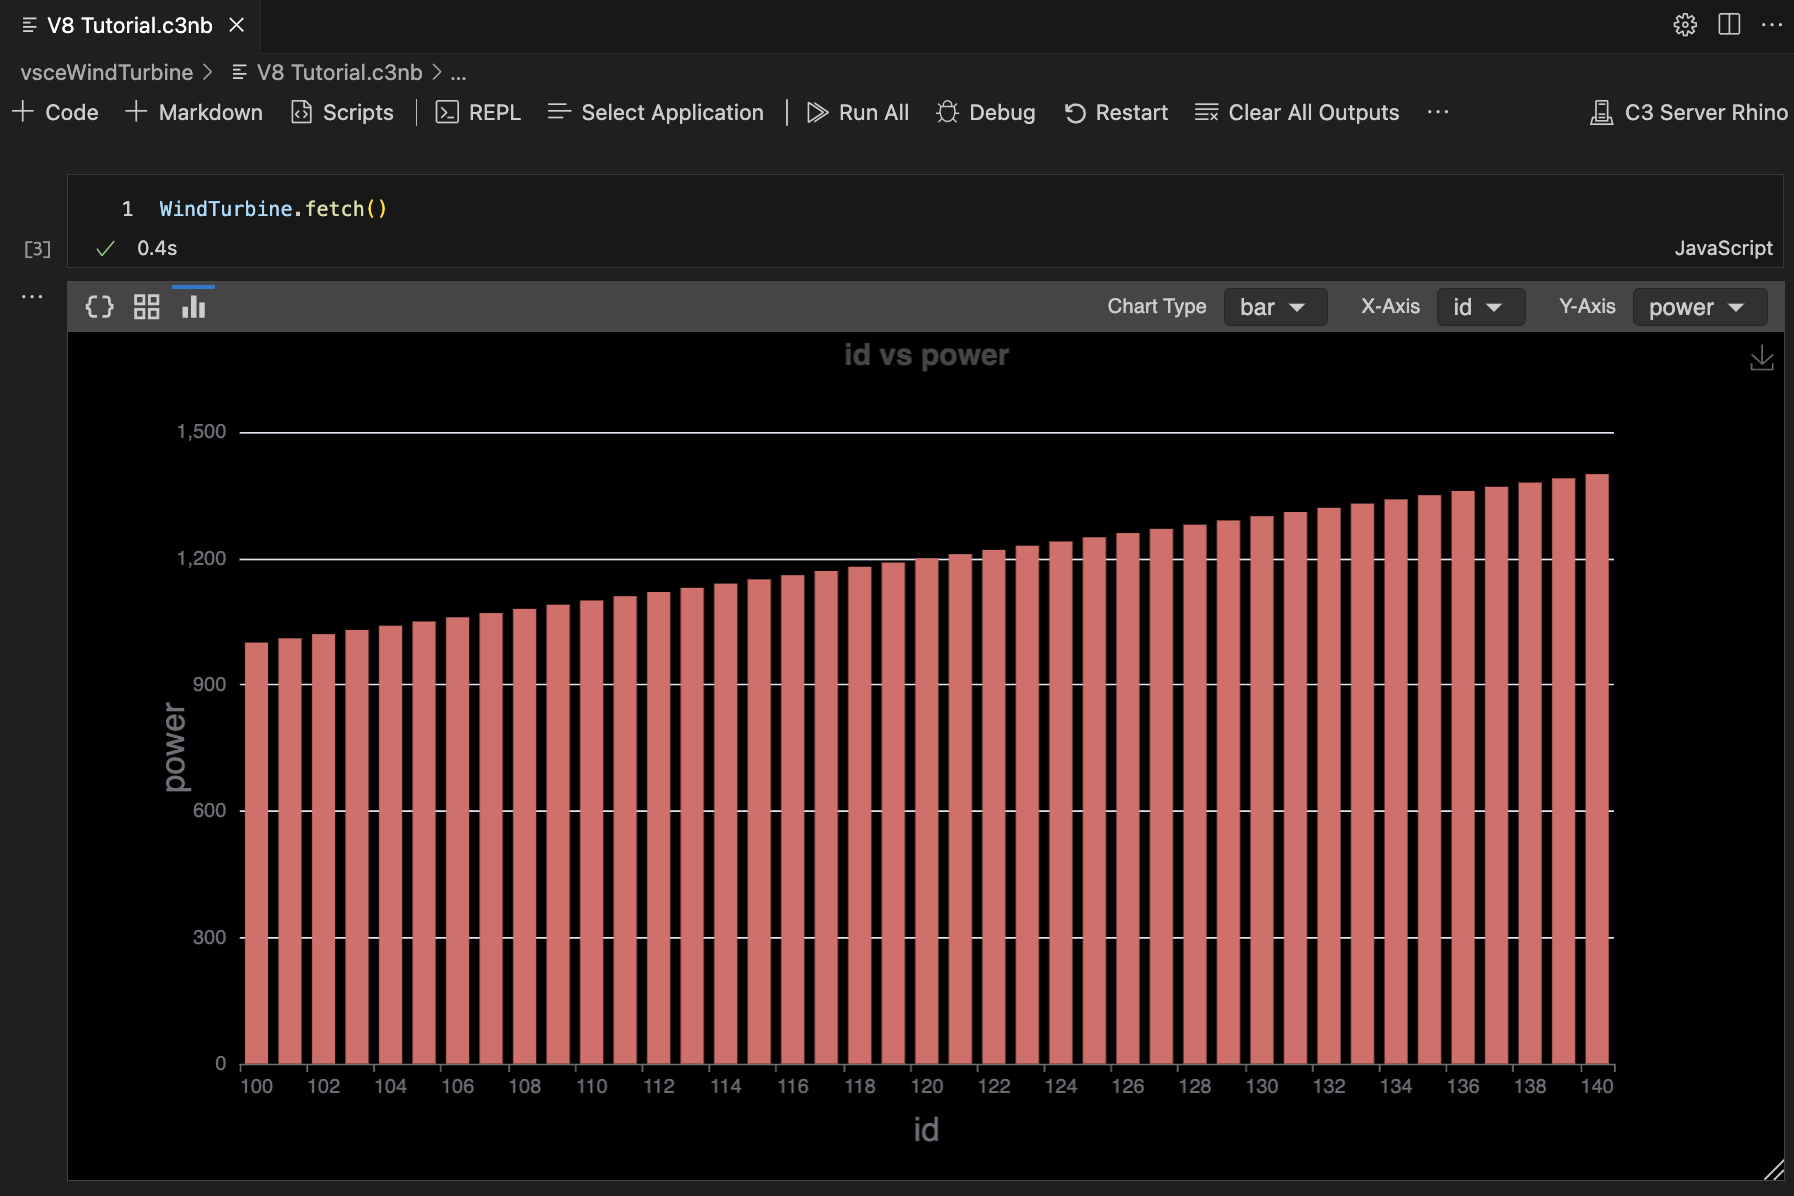
C3 notebooks support automatically visualizing objects. Objects can be rendered in tree, grid, and chart views. Views are only rendered if possible with the given data. For example, data that is a FetchResult can be visualized in all three views:
 |
|---|
| Tree Visualization |
 |
|---|
| Grid Visualization |
 |
|---|
| Chart Visualization |
To change the currently selected view, click on the icons in the top left of the cell output. Interactive visualizations are also supported in the C3 REPL.
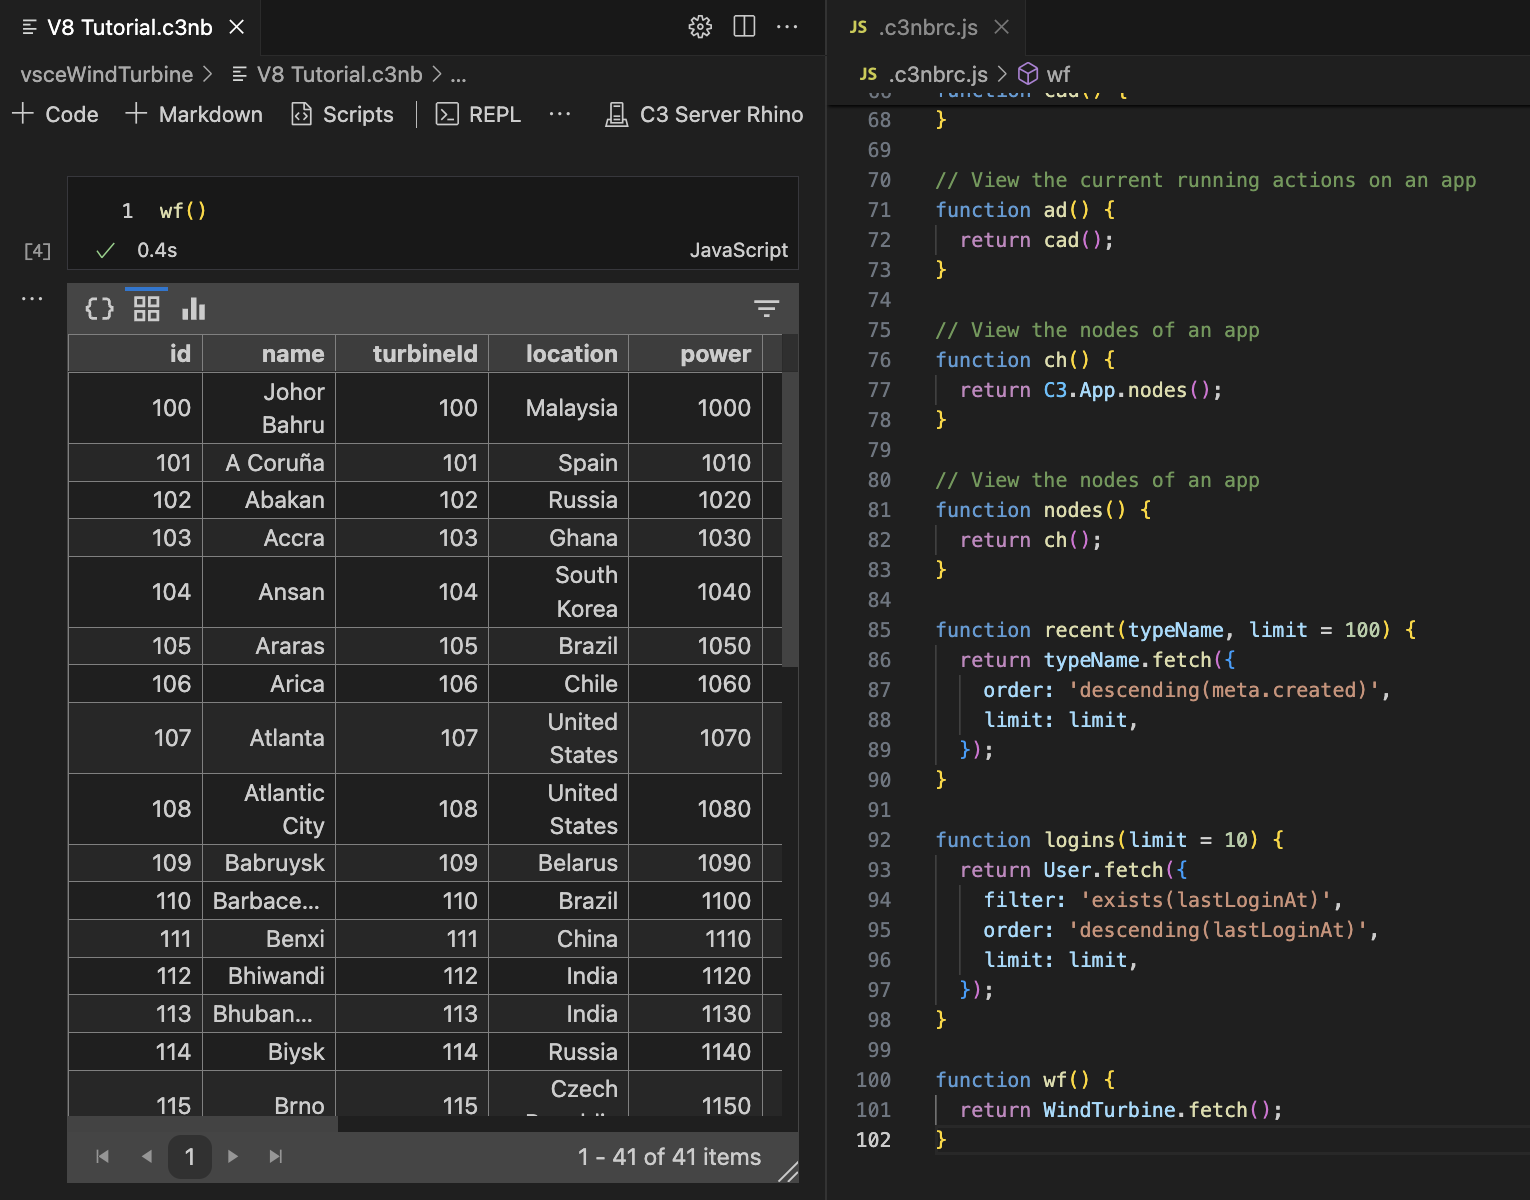
Scripts
Both the C3 notebook and C3 REPL have support for running custom scripts before any notebook cells. This is useful for defining constants and functions that will be available in any notebook or REPL. To access this, click on the Scripts button in the notebook toolbar.
 |
|---|
| Notebook Scripts |
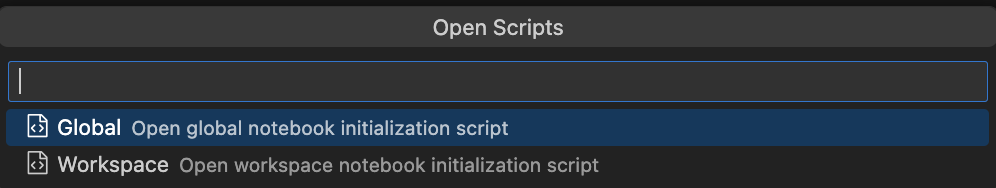
Notebook scripts can be defined in two locations, either Global or Workspace. The global script applies to all notebooks for every workspace, whereas the workspace script applies only to notebooks in that workspace. Note that the global script runs before the workspace script.
 |
|---|
| Using a custom function in scripts |
In the example above, the notebook has access to a custom function called wf that was defined in the script. Since the scripts are only run once before any cell is run, make sure to restart the notebook after making any changes to the scripts.
Lodash
Lodash is automatically included in notebooks and REPL for both Rhino and Node.js kernels. View their documentation at Lodash.
Advanced Features
In the Node.js notebook and REPL, you can use $_ to refer to the output of the previous cell. This is identical to the usage of $_ in the Chrome developer console.
Private methods and fields on a C3 Type in the documentation view are hidden by default. You can change this in the advanced notebook settings in Toolbar Overview.
Remote Python Debugger
This extension provides a feature for debugging Python code ran on a remote server.
Starting the Remote Python Debugger
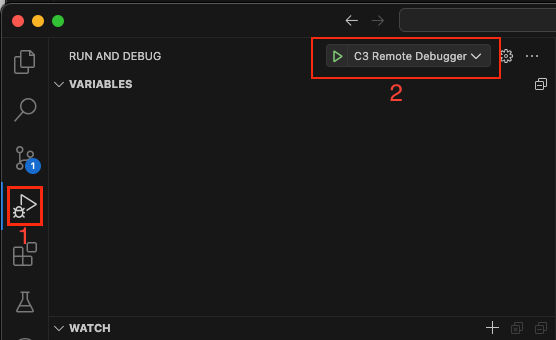
You can start the Python debugger in two ways:
- After a successful sync, go to the launch and debug tab, select the C3 Remote Debugger configuration, and click on the run icon.
 |
|---|
| Starting Debugger from Run and Debug tab |
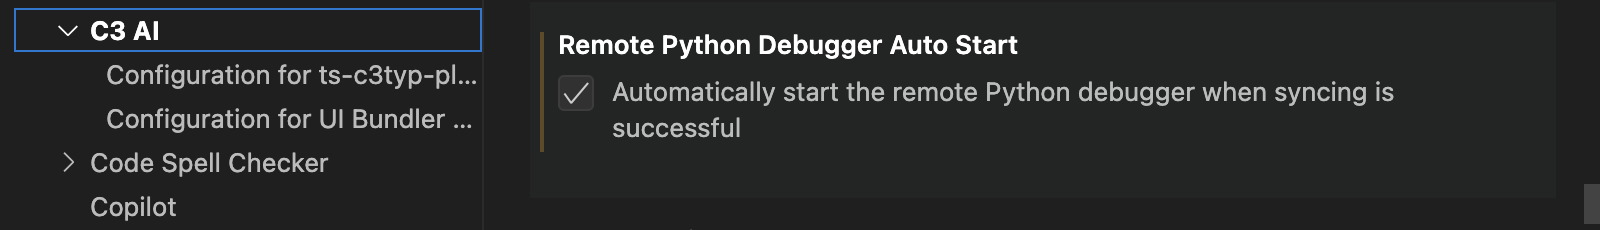
- You can also automatically start the debugger after a successful sync by enabling the C3: Auto Start Debugger in the extension settings.
 |
|---|
| Automatically Starting remote debugger after a successful sync |
Once the debugger has started successfully, you will see the debug toolbar at the top of the screen.
Debugging Python Code
The debugger supports the following features:
- Breakpoints: Set breakpoints in your Python code, and the debugger will stop at the breakpoint.
- Step Over: Step over the current line of code.
- Step Into: Step into the current line of code.
- Step Out: Step out of the current line of code.
- Continue: Continue execution until the next breakpoint or end of the program.
- Disconnect: Disconnect the debugger from the remote server.
- Debug Console: Open a debug console to run Python code on the remote server.
- Watch: Watch variables and expressions as the program runs.
Here are some ways to hit breakpoints in Python code:
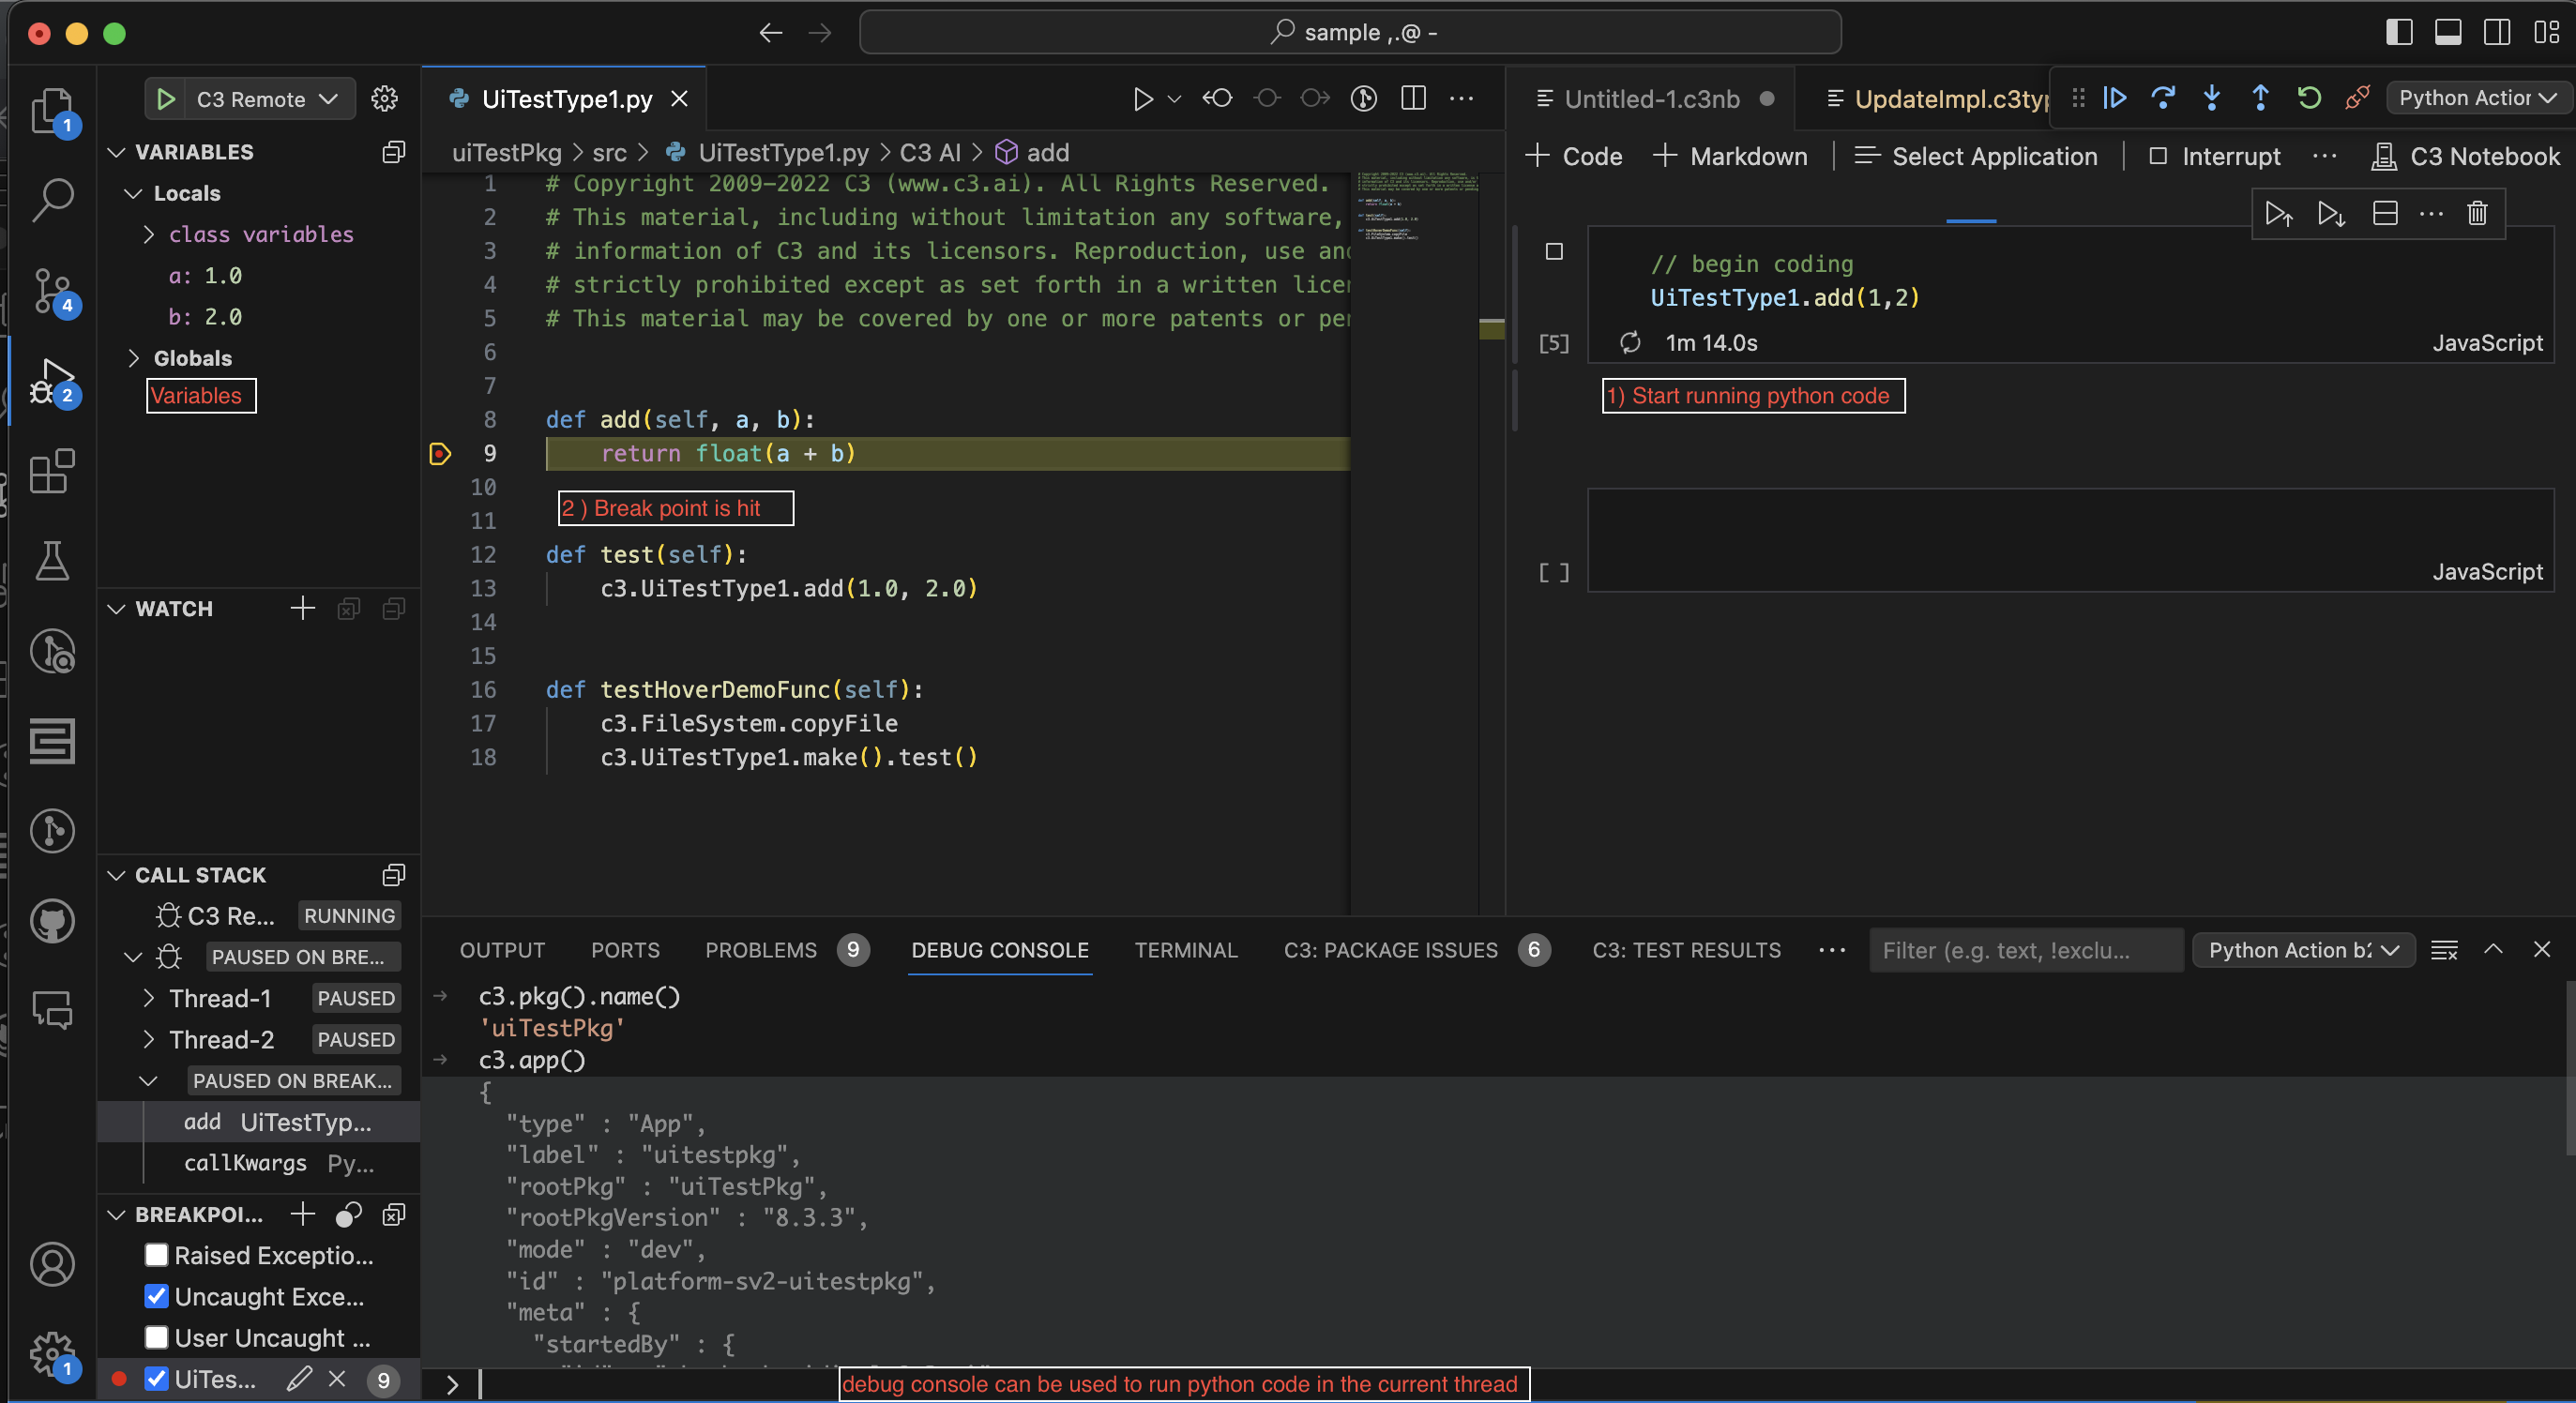
Running actions through notebook (Recommended way): To debug server-side Python actions through your Notebook, you can add a breakpoint in the Type implementation files, start the notebook in your application, and try running the action. The debugger stops at the breakpoint and the file is focused in the editor.
 |
|---|
| Hitting Breakpoints using notebooks |
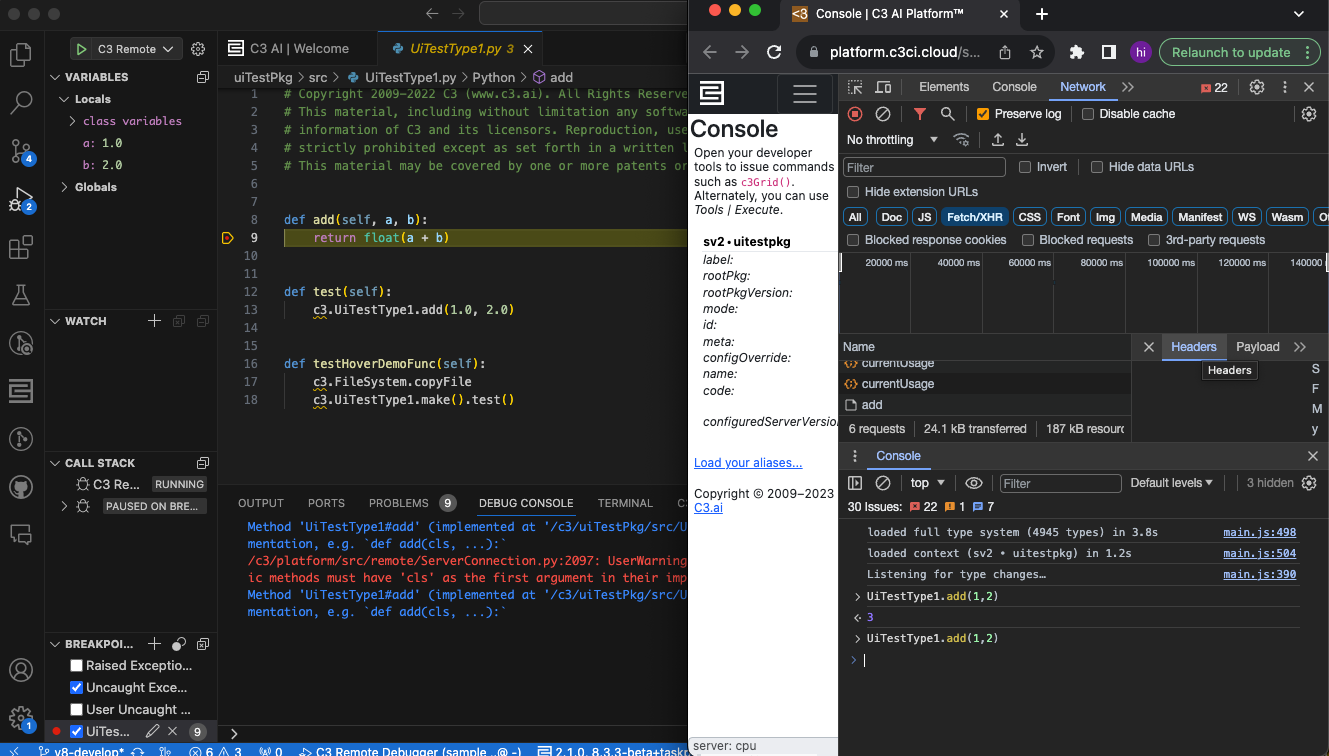
Running actions through the console: Similar to the notebook, you can add breakpoints in the Type's Python implementation files. Open the console of the your application and try running the action. The debugger will stop at the breakpoint in the Python action in VS Code.
 |
|---|
| Hitting breakpoints using static console |
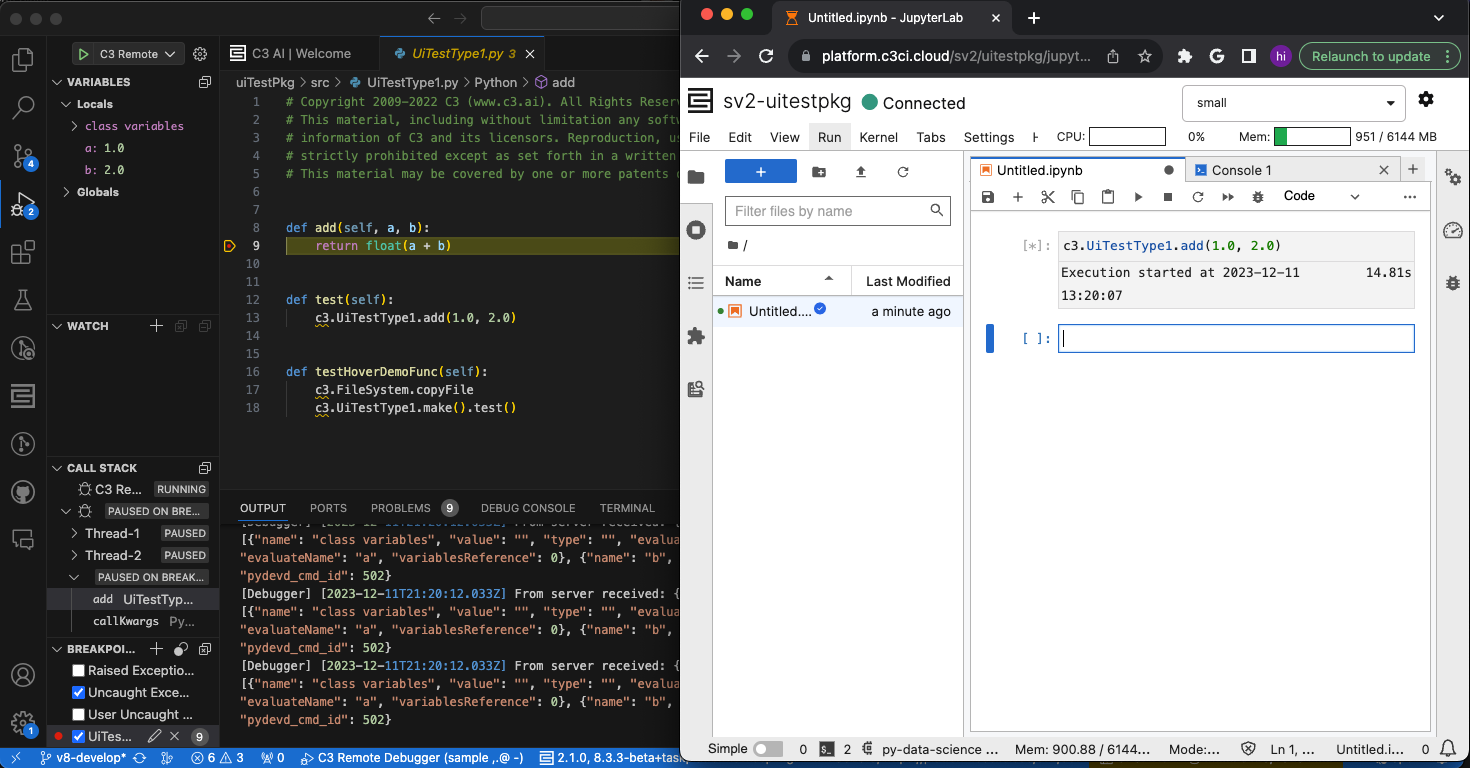
Running actions through Jupyter notebook: To hit breakpoints when running actions through Jupyter notebooks, you need to ensure that the actions are being ran on the remote server. For example, if you want to run an action implemented in py-a runtime, ensure that the Jupyter notebook kernel does not have the same runtime py-a or has all the dependencies of py-a. You can do this by creating a Python runtime without any dependencies and running the action in that runtime
 |
|---|
| Hitting breakpoints through Jupyter |
Limitations of Remote Python Debugger
- Supports debugging py4j actions. If you have a custom runtime, it is most likely py4j.
- Supports debugging up to five actions by default. If your application has multiple parallel actions, you can increase the limit by updating the following setting in the environment C3 AI Console of your SNE:
Debugger.Manager.inst().setConfigValue('threadPoolSize',<new limit>)