Product Analytics
Product analytics tells you whether people reach a working application, how long reaching one takes them, and where people stop. This page measures adoption across your organization, whereas conversation analytics measures the quality of individual sessions.
Headline metrics and the onboarding funnel are ready to read. The section on where people encounter difficulty is calculated only when you ask, so start that analysis before expecting figures from it.
When people have access but few reach a deployed application, the funnel shows at which stage the rest stopped, and the criticism analysis shows what blocked them.
Open the Analytics section and select the Product tab.
Headline and engagement metrics
Four groups report how many people use C3 Code and how far those people get.
North star metrics carry four figures: weekly active application creators, deployment success, time to first deploy at the 50th and 90th percentiles, and weekly active deployments.
Time to first deploy measures the whole path from arriving to a first deployment. That figure moves when onboarding, documentation, or the product itself improves.
User engagement reports daily, weekly, and monthly active users, stickiness as the ratio of daily to weekly, and sessions per week. Stickiness separates a tool people return to from a tool people tried once.
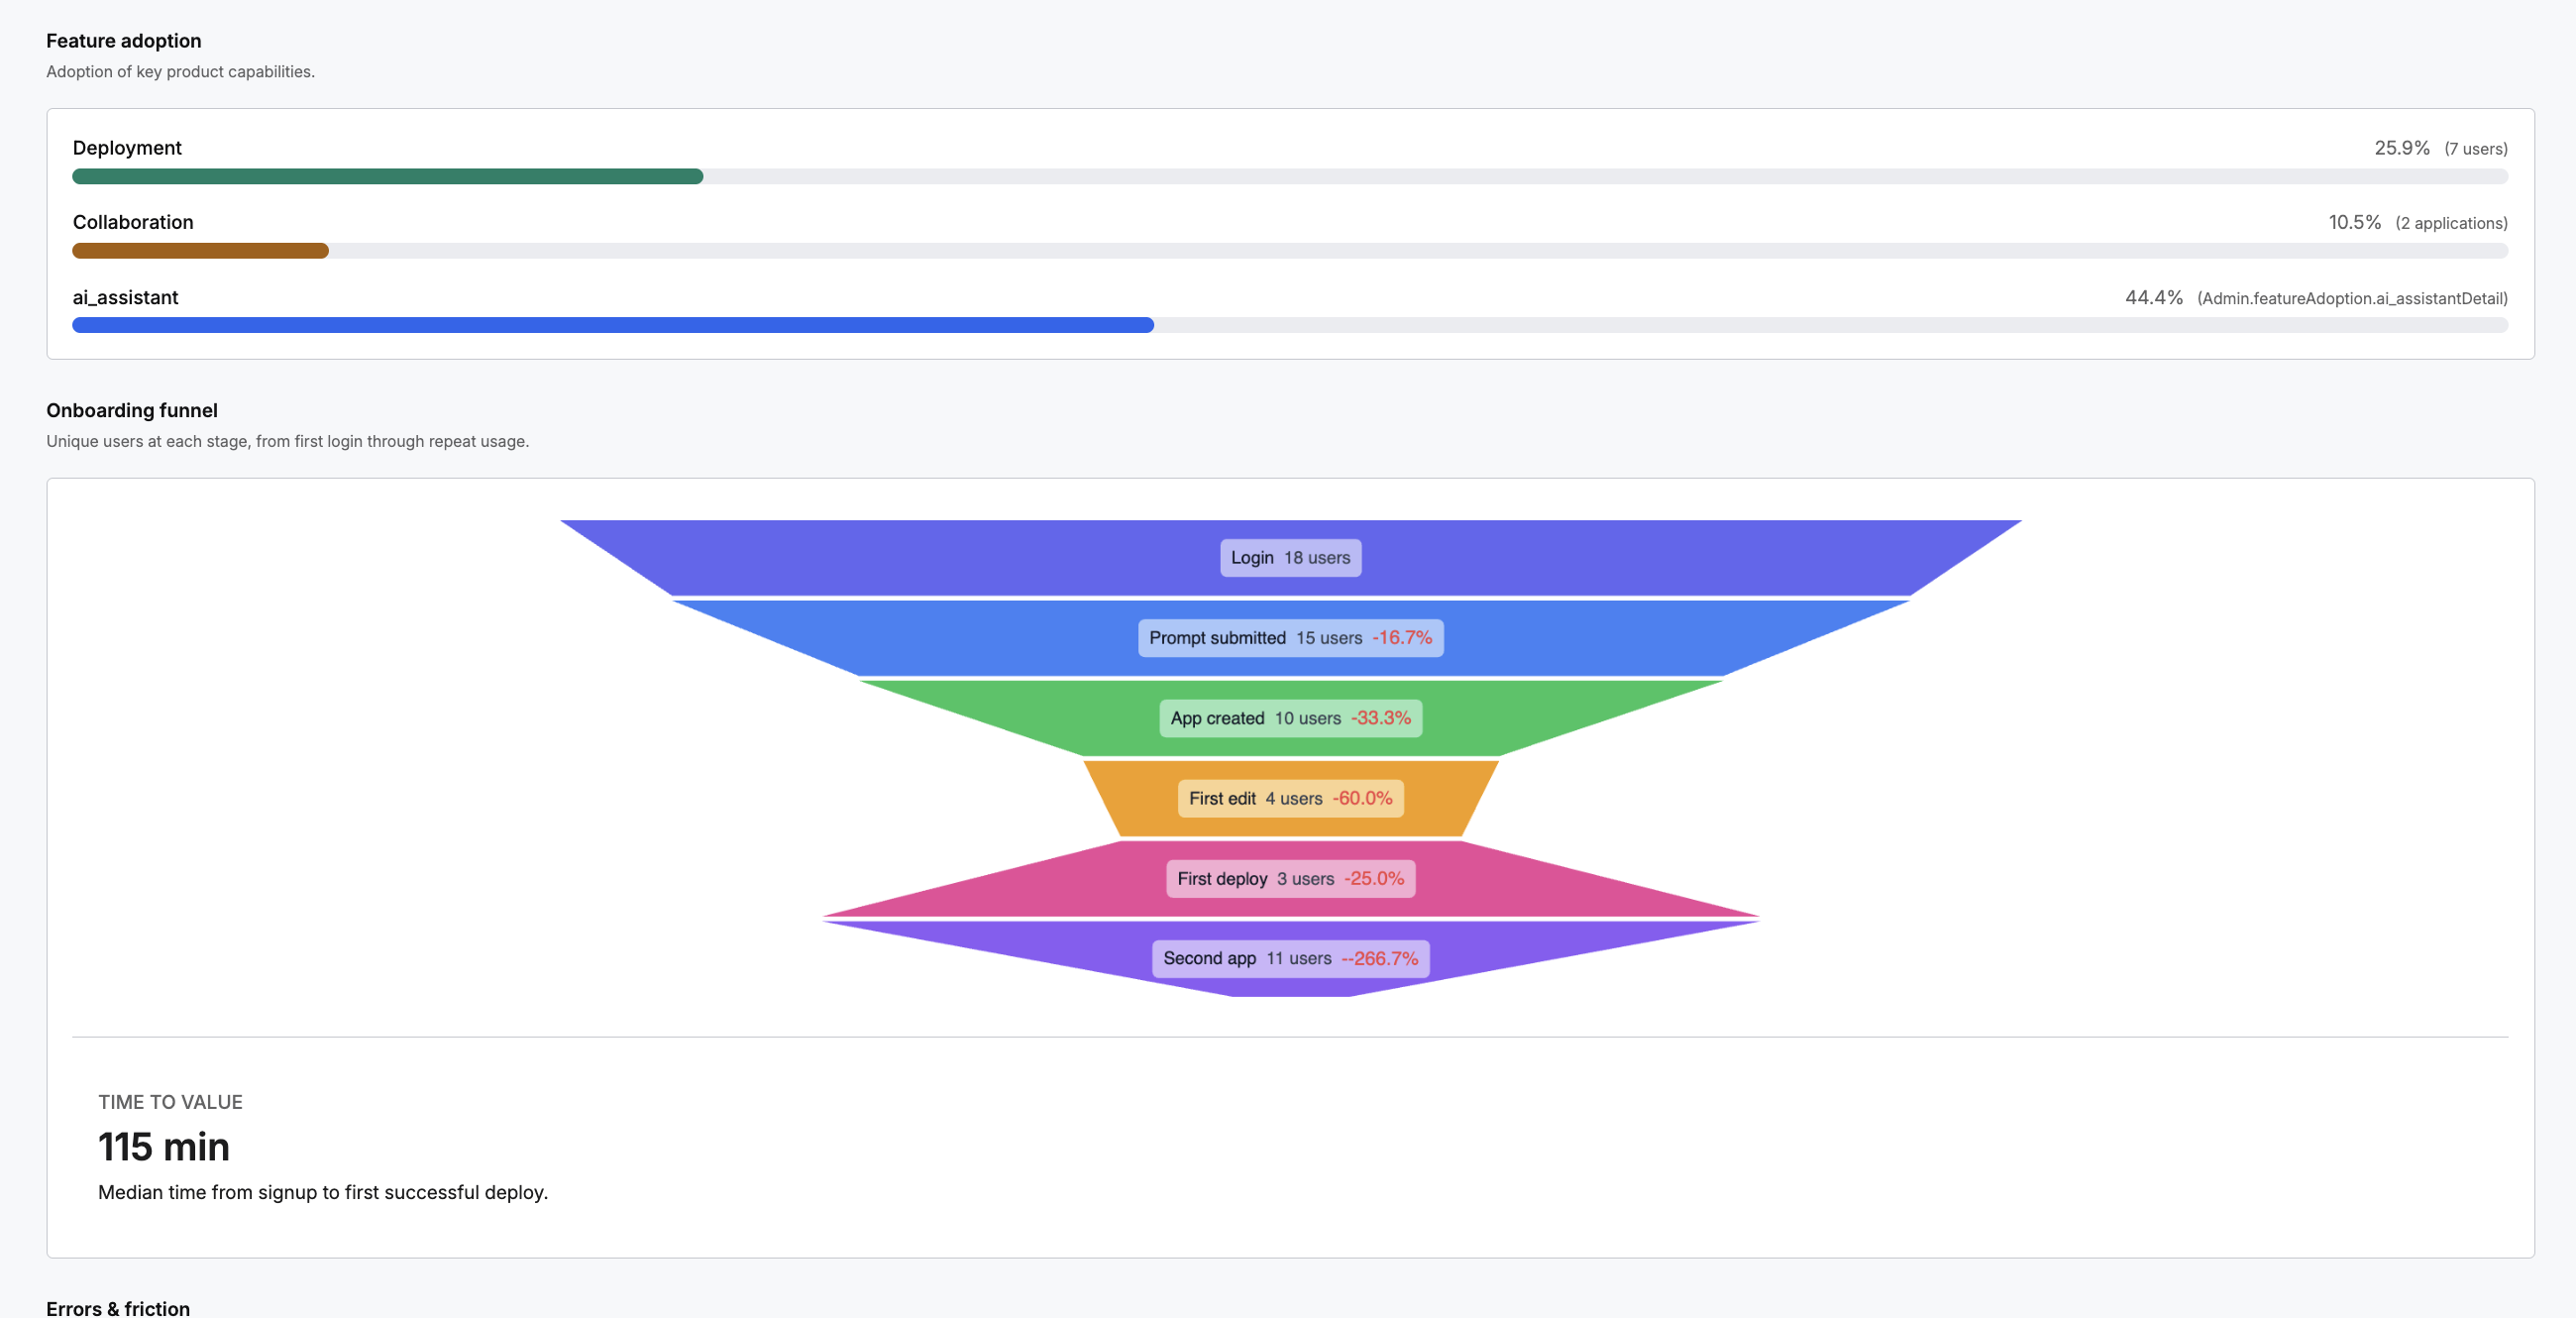
Feature adoption reports what share of users reach each major capability, including deployment, collaboration, and the agent. A capability with low adoption is either hard to find or not useful, and the funnel usually tells you which.
Tool usage reports which agent tools are called most across the organization and their call volume, with the top ten tools ranked. Low use of an available tool means the agent is not reaching for it, which points at the guidance or skills you give the agent.
The onboarding funnel
The funnel counts unique users at each stage, from first login through repeat usage: login, prompt submitted, application created, first edit, first deploy, and second application.
Look for the largest drop between stages, rather than for the lowest number overall. Each stage shows the percentage change from the stage before, so the largest fall identifies where the funnel loses the most people.
The final stage measures retention. A user who creates a second application has returned after finishing the first.
Time to value accompanies the funnel as the median time from signing up to a first successful deploy. Read time to value together with the funnel, because a fast median across few users is a different situation from a slow median across many.
Where people encounter difficulty
A criticism analysis runs over recent turns to find recurring problems. These figures are calculated when you ask, so the section stays empty until you start the analysis. An option re-evaluates every turn rather than only the new turns.
Once the analysis has run, three readings matter:
- Criticism rate is the share of turns flagged with a criticism, shown alongside the totals behind that share. Read the rate together with the sample size.
- Criticism rate trend shows whether the rate is rising or falling. The trend responds to changes you make, so watch the trend after adjusting guidance or skills.
- Top failure categories group criticisms by cause, each with a description and a count.
Categories cover the agent misreading requirements, generating incorrect code, mishandling source control, producing unclear documentation, and missing stated instructions, among others.
Treat the largest categories as a backlog. A high count against requirement understanding points at your prompting guidance. A high count against code generation points at the model, or at the skills available to that model. Each cause requires a different fix.
A failure category tells you what goes wrong across all users. The sessions where each failure happened tell you why, and those sessions appear with the conversation metrics.
Where to go next
These pages cover session quality and the limits behind usage: