Conversation Analytics
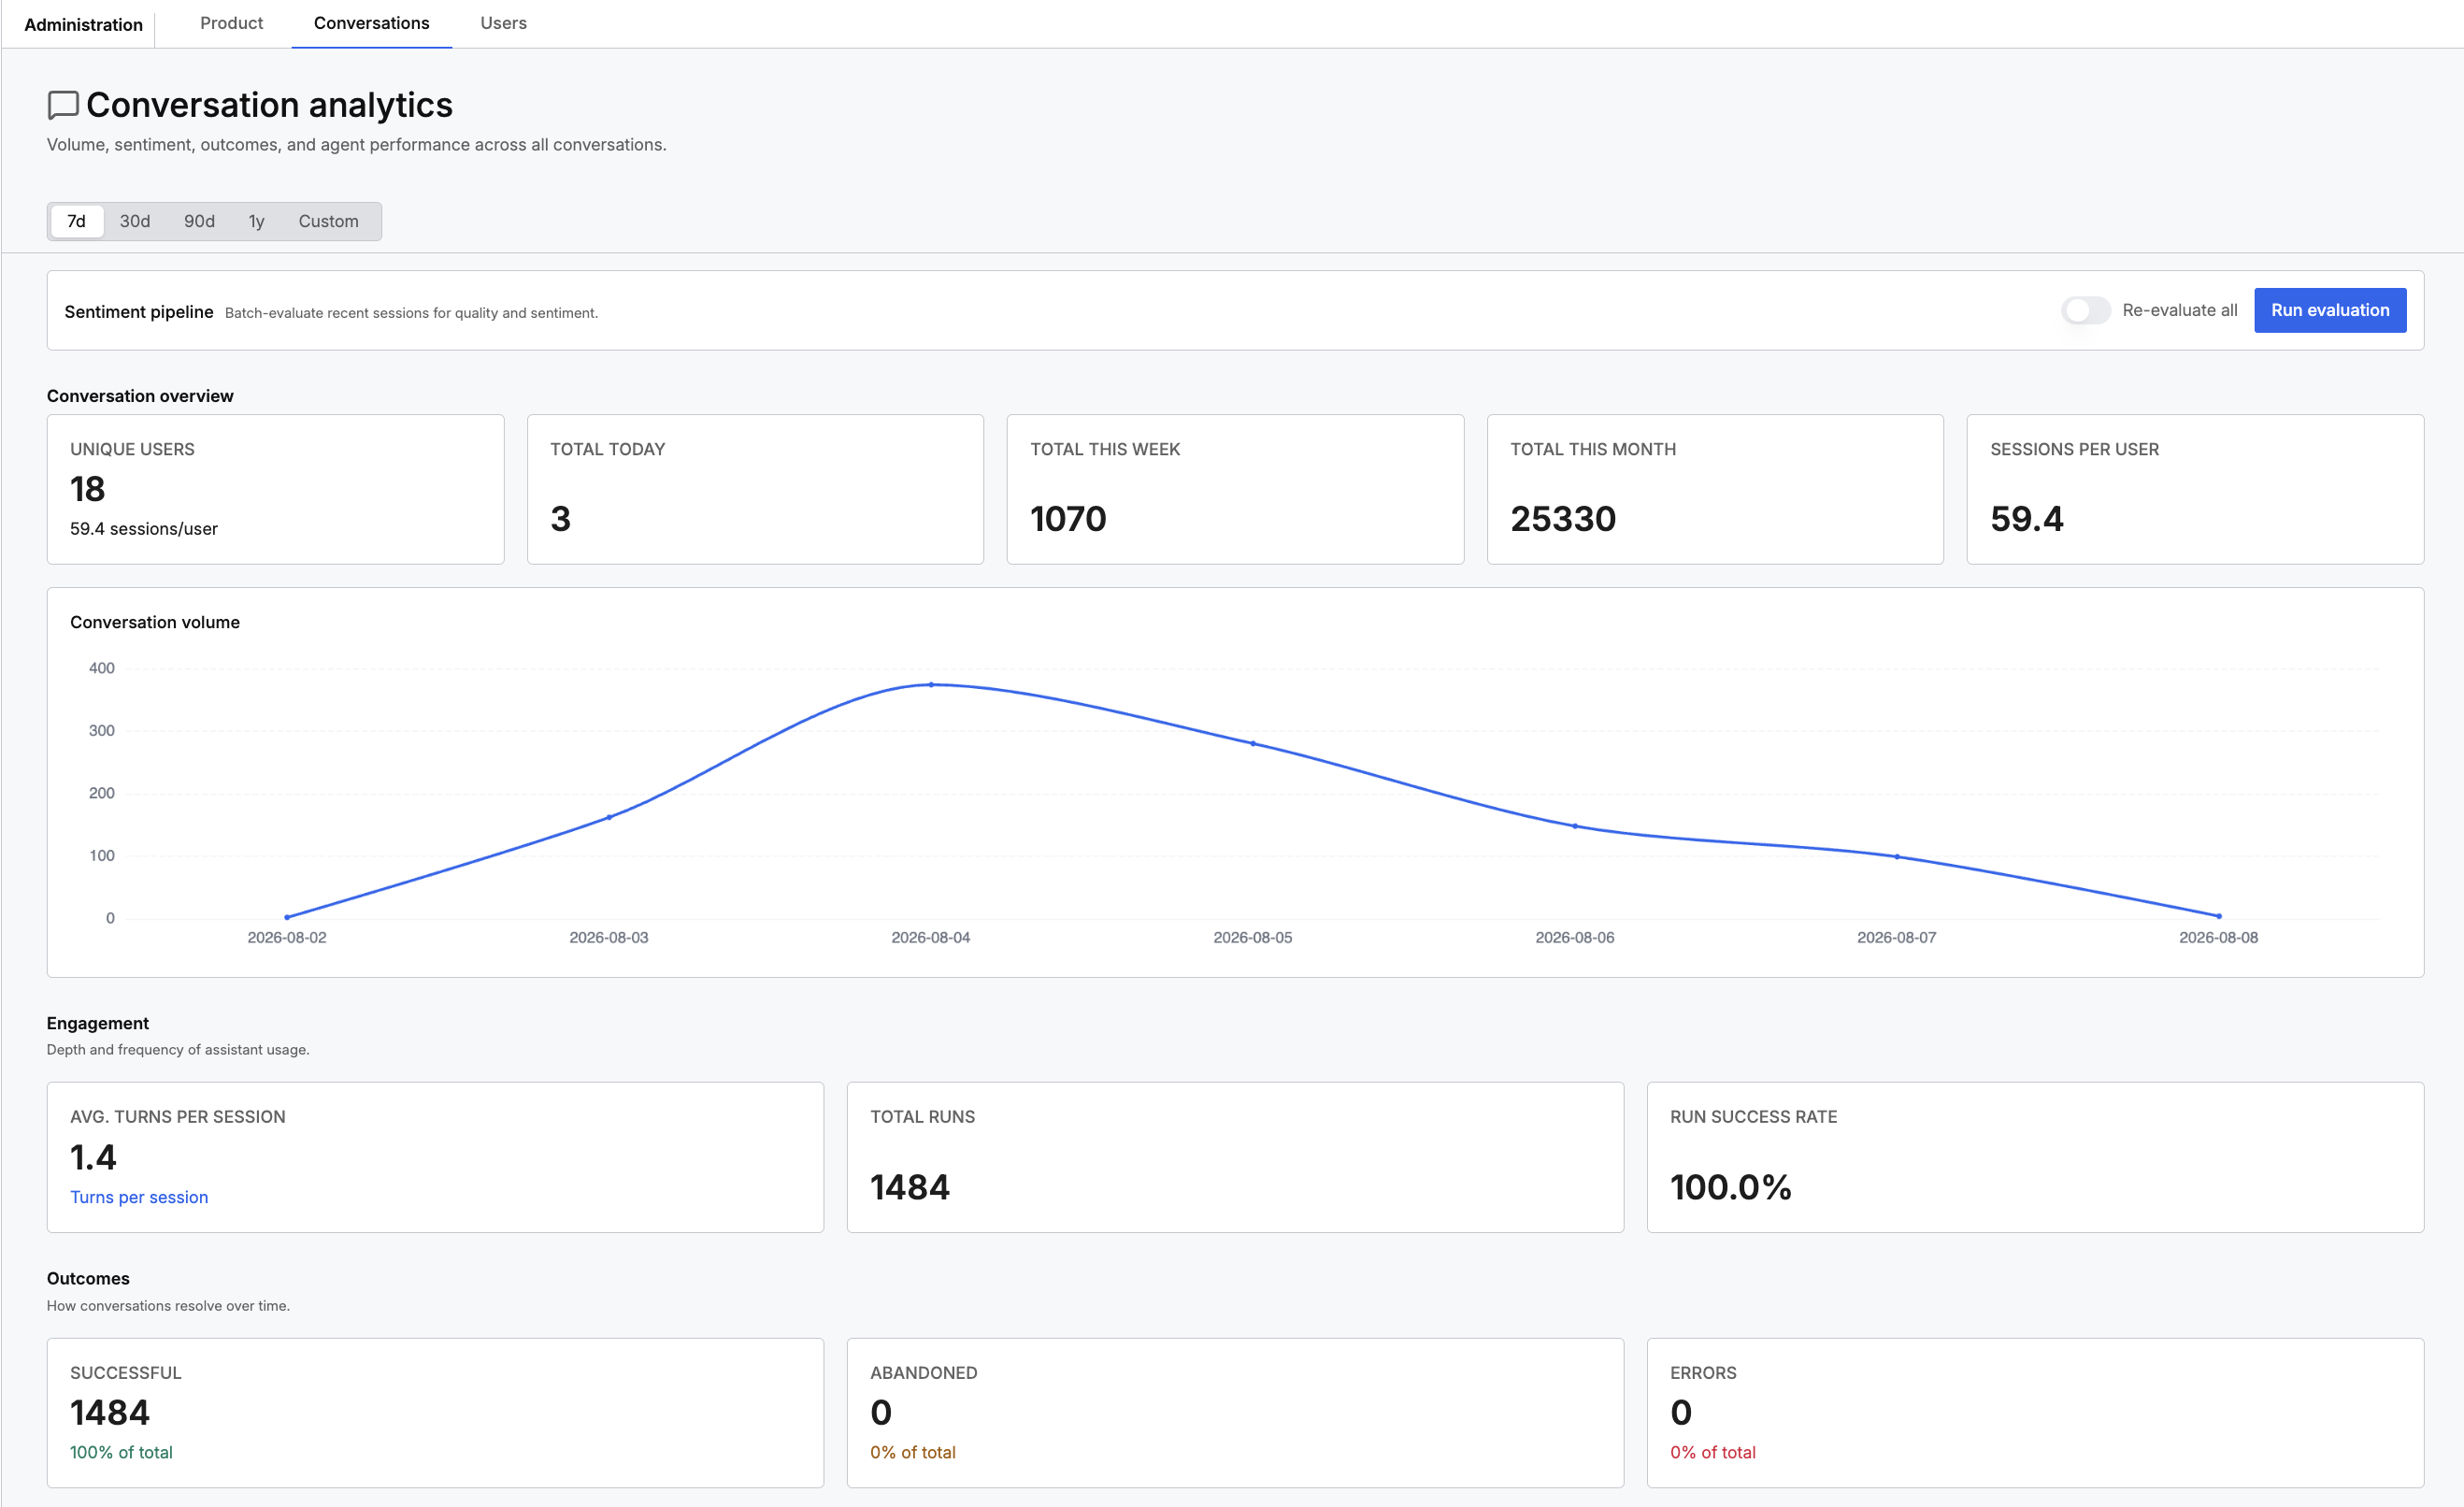
Conversation analytics reports how people and the agent work together. The page measures how much people use the agent, the sentiment those sessions carry, and how each session ends.
The page answers questions an impression cannot: where frustrated sessions concentrate, whether slow responses explain them, and which tools the agent calls most.
Working with this page takes three steps:
- Run the sentiment evaluation, because the sentiment and quality figures stay empty until it runs.
- Read the five metric groups.
- Open the sessions behind any figure you want to explain.
Open the Analytics section and select the Conversations tab.
Run the sentiment evaluation
The sentiment and quality figures come from an evaluation you start, so those tiles stay empty until the evaluation runs. The evaluation reads recent sessions, scores each session, and writes the results back to this page.
Start the evaluation from Chat Sentiment Evaluation at the top of the page.
That control also offers Re-evaluate all, which scores every session again rather than only the unscored sessions. Use Re-evaluate all after changing what you measure, so older and newer sessions carry comparable scores.
Run the evaluation on a schedule. One reading gives you a number, and a series tells you whether the experience is improving.
What the metrics tell you
The page reports five groups, and each group answers a different question.
Volume and engagement count unique users, totals per period, sessions per user, average turns per session, and total runs. A high session count with a low turn count means people ask one question and leave, which is a different situation from long working sessions.
Outcomes classify how conversations end, across successful, abandoned, and errored. Abandonment appears in no other report.
Sentiment spreads evaluated sessions across Positive, Neutral, Negative, and Frustrated, with an average score. Read Frustrated separately from Negative. Frustrated usually means the agent failed repeatedly inside one session, whereas Negative can come from a single poor answer.
Agent performance covers speed and reliability: response times at the 50th, 90th, and 99th percentiles, error rate, stuck states, and recovery rate. Watch the 99th percentile rather than the median, because the slowest responses are the ones users remember.
Session complexity spreads sessions by how many steps each session took, with average, median, 90th percentile, and maximum. A cluster at one or two steps means quick questions. A long tail means sustained building work.
Open the sessions for a metric
A table lists sessions with the user, the application, the chat title, the date, the turn count, the score, the sentiment, and the outcome. Filters narrow the table by sentiment and by outcome.
Use the table after a metric moves. The overall figure tells you that something changed, and the sessions tell you what changed. Filter to frustrated or errored sessions to get from a number to a cause.
Conversation quality tells you how the agent performs. Whether people reach a working application at all is a different question, and adoption metrics answer that question.
This view names individual users and their conversations. Report the summary metrics to a wider audience, and keep the named sessions inside the administration team.
Where to go next
These pages cover adoption and the limits behind usage: