Manipulate ERD Views with Object Model
After integrating sources and mapping them to C3 AI Entity Types, you can use the Object Model perspective in Data Fusion to review entities, their relationships, and their underlying schema. The Object Model perspective opens to a catalog of C3 Entity Types and lets you switch between three views of the same data:
- Grid view: Type cards for visual browsing, with metric tiles for fields and relationships.
- List view: A condensed table with sortable columns for Type Name, Description, Package, Fields, and Relationships.
- Diagram view: An Entity Relationship Diagram (ERD) that shows entities and the keys that join them.
To open the Object Model, select Data Fusion > Object Model in C3 AI Studio. Use the view toggle in the toolbar to switch between Grid view, List view, and Diagram view. The page header shows two metric tiles: C3 Object Types (count of Types in scope) and Packages (count of packages in scope).
The favorites feature and the AI-generated chart dashboard require an application server version of 8.11 or later. When the application runs on an earlier server version, the Only Show Favorite toggle and the star icons are hidden, and the chart dashboard in the Type Detail page's Objects tab does not appear. The rest of the Object Model, including the catalog and the Diagram view, still loads.
To browse Types in the grid or list view, search them, filter them by package or relationship count, and mark them as favorites, see Explore Types in the Object Model.
To open the Type Detail panel for a Type and inspect its Fields, Methods, Relations, Inheritance, Metadata, and instance data, see Inspect a Type in the Object Model.
The rest of this topic describes the Diagram view of the Object Model perspective.
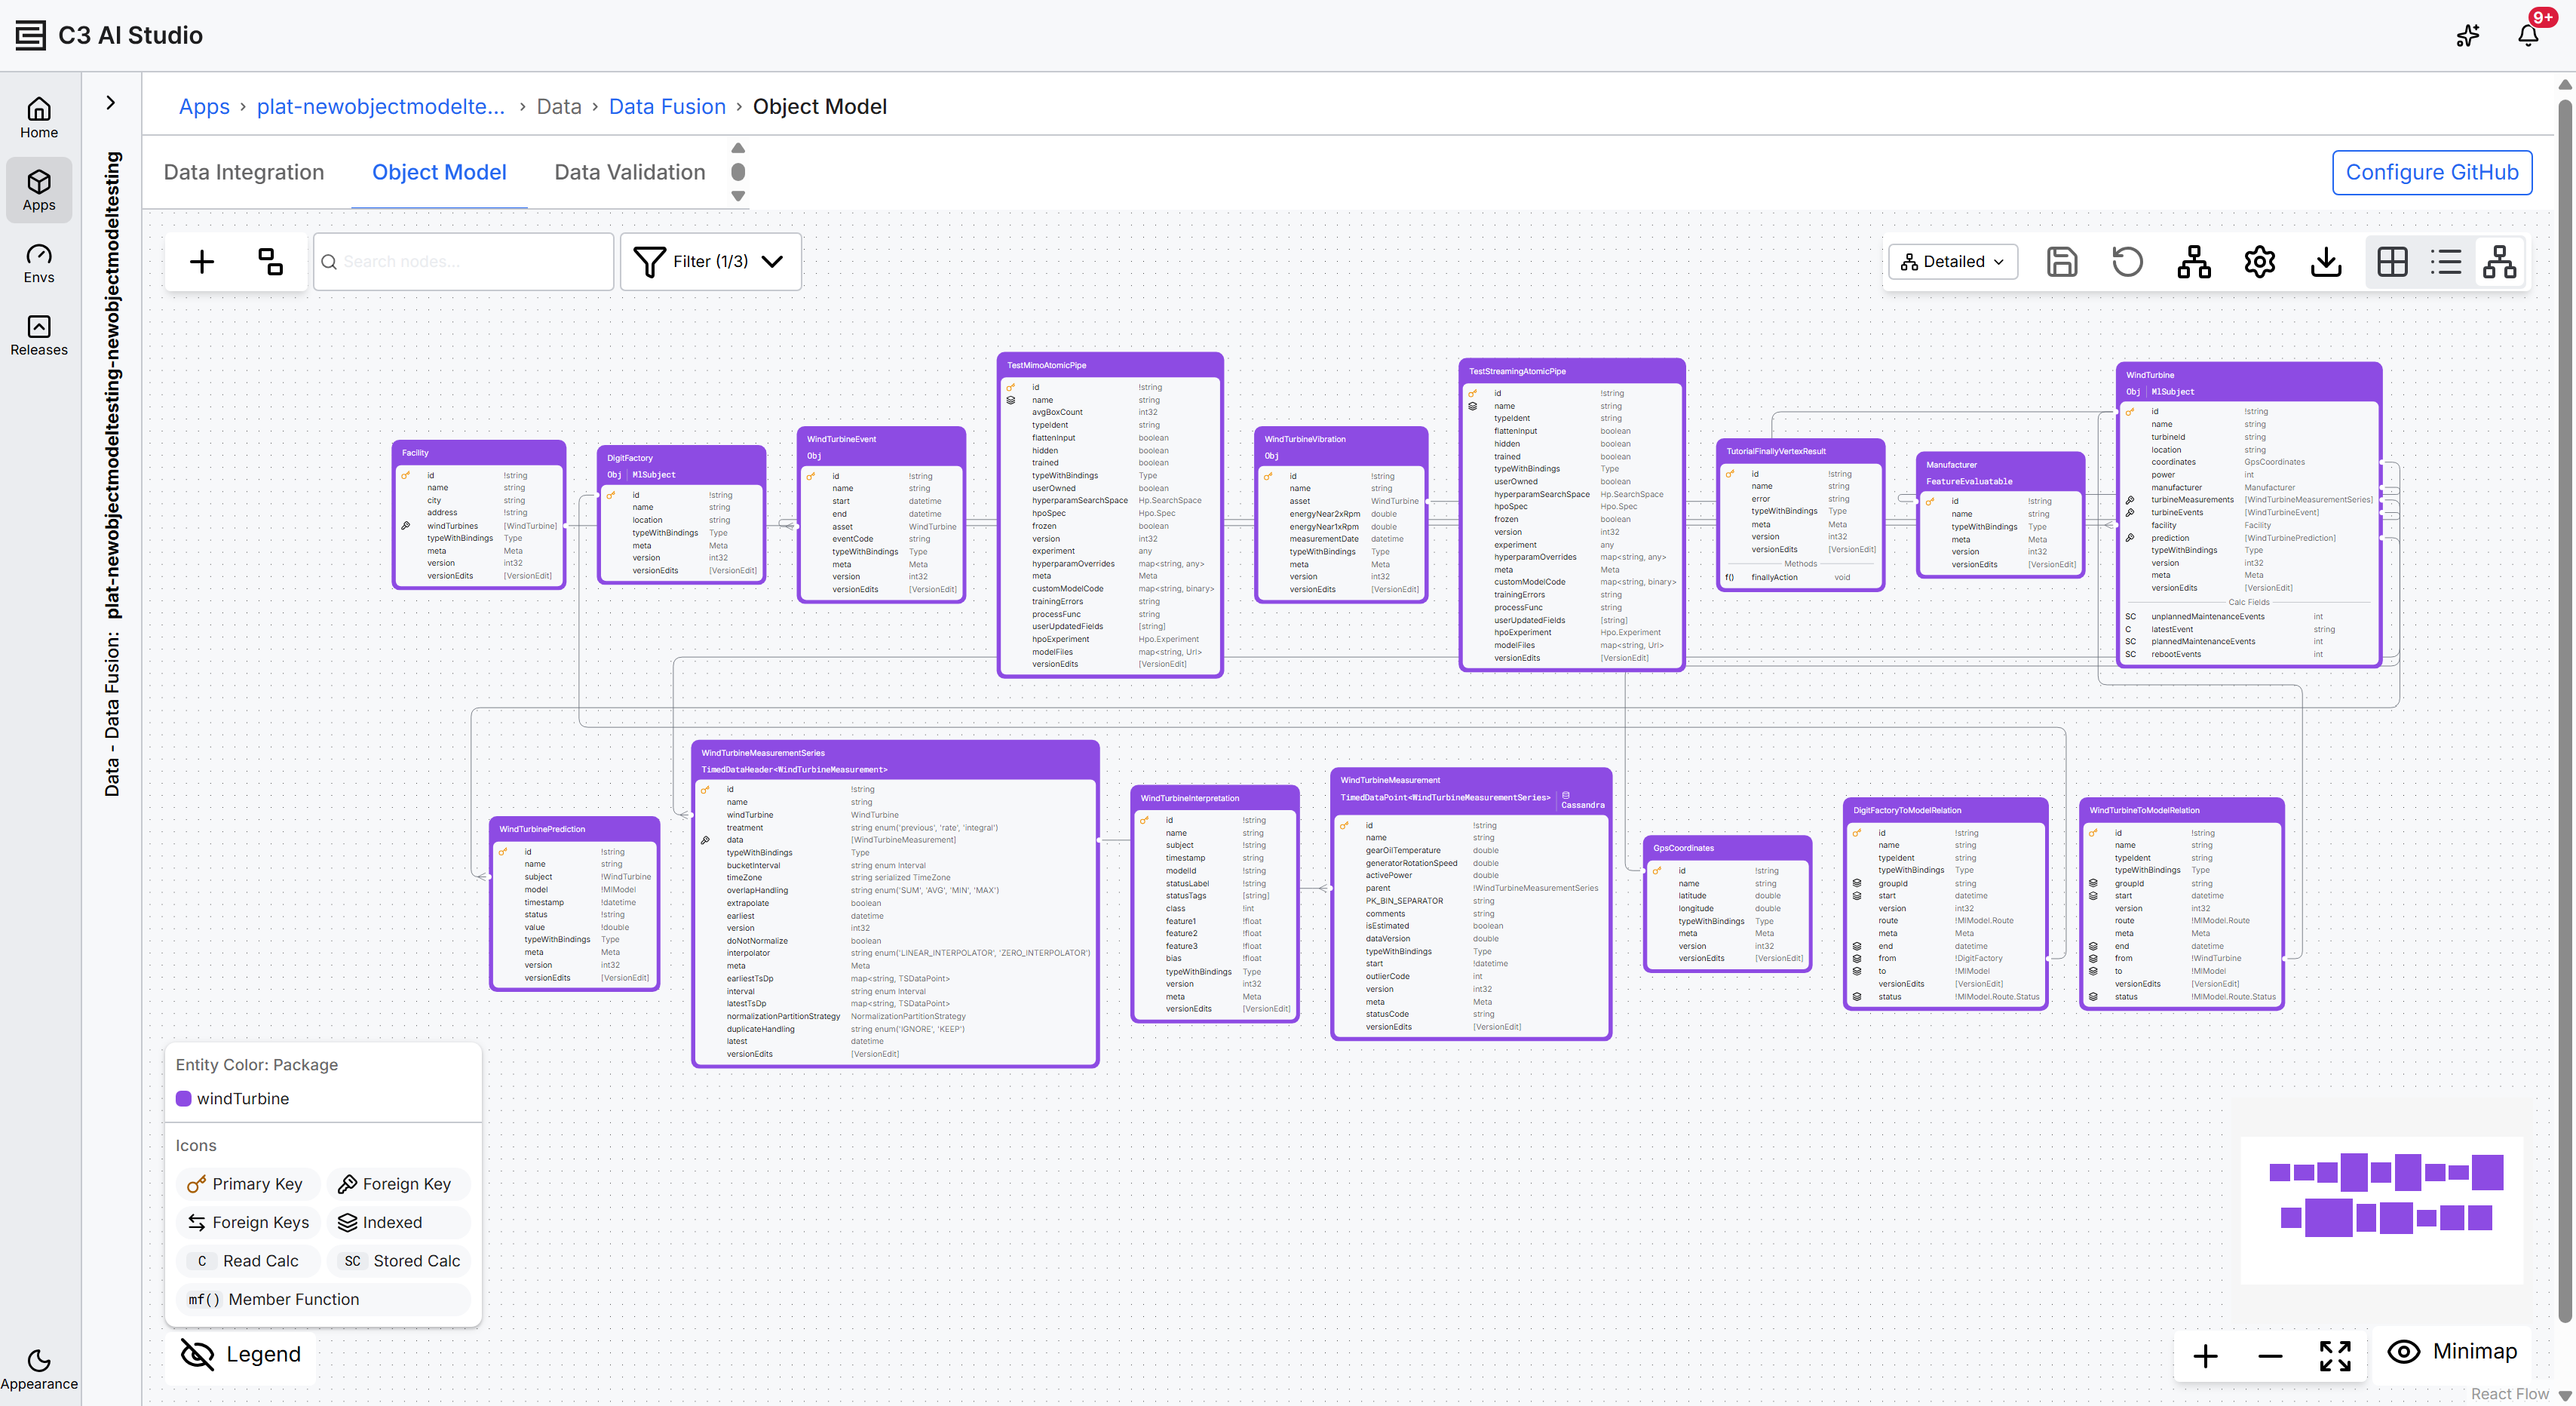
Entities and their relationships in the Diagram view
The Diagram view shows an ERD that you can manipulate, filter, and organize to focus on the parts of your data model that you care about. You can also organize entities into groups to simplify complex diagrams. For more information, see Understand ERD Node Grouping and Manage ERD Node Grouping.
Entities in the Diagram view represent entity Types in your application. The Diagram view follows standard ERD conventions with a few exceptions:
- Entity color coding: An entity's border color indicates the package it belongs to by default. You can change colors in Diagram Settings.
- Mixin listings: An entity's mixins appear underneath the entity name.
- Mandatory field markers: A field marked with a leading exclamation point (
!) is mandatory. This notation follows standard C3 AI Type syntax. - Keys: Primary and foreign keys are marked with key symbols. The Legend in the bottom left shows examples of primary, foreign, and multiple foreign keys.
- Calculated fields and member functions: These appear below all stored fields. The Legend explains how to differentiate between read calcs, stored calcs, and member functions. For more on mapping data to fields, see Map and Transform Source Data.
- Selectable entities: Select an entity to review its properties and preview data.
Selecting an entity in the Diagram view opens the Type Detail panel on the right side of the canvas. The same panel opens when you select a Type card in the Grid view or a row in the List view. For panel details, see Inspect a Type in the Object Model.
Node context menu
Right-click an entity in the Diagram view to open its context menu. The available actions are:
- Preview Data: Open the bottom drawer with a preview of the entity's recent persisted instances.
- Preview Schema: Open the bottom drawer with the entity's schema (its fields and their data types).
- View Code / Modify Code: Open the entity's source in the code editor. Modify Code is available when the application is in development or trial mode and the Type is editable; otherwise the action is read-only View Code.
- Remix Code: Available for an entity that belongs to a dependency package. Editing it saves a new remixed entity in your application's root package. See Add and Update Entities in the Object Model.
- Delete: Remove the entity from your application's root package. This action is disabled for Types outside the root package and for
finalTypes; the disabled tooltip reads "Cannot delete types outside the root package or final types." - Remove from Group: Available when the entity belongs to a group. See Manage ERD Node Grouping.
Diagram visibility
By default, the Diagram view shows only workspace-scoped packages to reduce visual noise and focus on objects you can edit directly. Entities and relationships that belong to dependency packages are hidden initially. You can reveal dependency packages as needed to explore external relationships and downstream dependencies.
Legend
Use the Legend to review color indications, subtitle selections, and explanations of icons. Select the eye-with-slash icon to hide the Legend.
Search
Use the search bar to navigate to an entity. As you type, the search lists possible nodes for easier navigation.
Diagram Settings
Use the following options in Diagram Settings to simplify your diagram:
- Entity Color: Choose how entity border colors are assigned.
- Package: Each package gets a unique border color (default).
- Integrated/Populated: Distinguishes entities that receive data through a pipeline from entities populated within the application.
- No Color: All entities use a neutral border.
- Tags: Toggle each tag set on or off.
- External Data Source Tag: Marks entities hosted by an external data source. Tagged as
External. - Remix Tag: Marks entities that remix entities from a dependency package. Tagged as
Remixed. - Entity Tag: Marks entities backed by a non-relational store. Tagged with the store type (
Key-Value,File Key-Value,Vector, orCassandra).
- External Data Source Tag: Marks entities hosted by an external data source. Tagged as
- Details: Toggle which sections appear inside each entity box.
- Fields: Stored fields.
- Indexed: Indexed fields, marked with the indexed icon.
- Calc Fields: Calculated fields, marked with
C(read calc) orSC(stored calc). - Methods: Member functions, marked with
mf().
Toggle views in the Diagram
Next to the search bar, select the views dropdown to choose between a Detailed or Minimalist view. The Minimalist view hides entity details so you can focus on how entities relate to each other. The same dropdown lists Create new view and Manage views actions for saving custom views.
When you move entities in the Diagram view, Save view and Reset view buttons in the top-right toolbar save or revert all changes to the selected view, including layout, filters, and view settings.
Saved changes apply to the entire application. If you and a colleague are working on the same application, your changes (including layout and view configuration) appear in their Object Model view and yours.
Save and reuse custom views
The view dropdown next to the search bar lists Detailed and Minimalist by default. Select Create new view to save the current layout, filter selections, and view settings as a named view. Select Manage views to rename or delete saved views. Saved views apply to the entire application, so collaborators see the same arrangement when they open the diagram.
Filter entities in the Diagram
The Filter option in the Diagram view controls which packages appear in the workspace. The Packages filter lets you customize the Diagram view to display selected packages and keep your workspace focused.
In C3 AI Studio, a package is a logical grouping of related entity Types, mixins, relationships, and services, such as genAiSearch, observability, or uiComponentLibrary. Filtering lets you focus on the parts of the data model that are relevant to your current work.
The package list shows all packages in the root package of your application and its dependencies. Each package represents a collection of entities.
Some packages can be excluded from the Diagram view based on system configuration. Administrators manage this behavior through the EntityRelationshipDiagramPackageConfig#excluded setting.
To narrow the Diagram view at runtime without changing configuration, use the in-page Filter dropdown:
- Select All: Checked by default. Toggle to check or uncheck every package at once.
- Package checkboxes: One per package. Toggling a checkbox applies the change to the diagram immediately — there is no separate Apply step.
- Reset: Restores the default selection (all packages visible).
The Filter button shows the active count as Filter (n/m). To search the visible diagram for a specific entity, use the Search nodes... input next to the Filter button.
Filtering packages helps you:
- Simplify the Diagram view by hiding unrelated packages.
- Improve performance when working with large or complex data models.
- Focus analysis on the entities you are actively developing or integrating.
Include or exclude a package from the Diagram view
Users with the C3.AppAdmin role can control which packages appear in the Diagram view using the EntityRelationshipDiagramPackageConfig#excluded setting.
To view or update the configuration:
Open the C3 Console in your application.
Retrieve the current configuration for a specific package:
JavaScriptEntityRelationshipDiagramPackageConfig.make({ name: 'selfServiceDI' }).getConfig()Replace
selfServiceDIwith the name of the package you want to check. The output shows the current configuration, including theexcludedvalue. Ifexcludedistrue, the package is hidden from the Diagram view.Update the configuration to include or exclude the package:
JavaScriptEntityRelationshipDiagramPackageConfig.make({ name: 'selfServiceDI', exclude: false }).setConfig()Set
exclude: falseto include the package in the diagram. Setexclude: trueto hide the package.Refresh the Diagram view to apply the change.
Auto layout
To rearrange entities automatically, select Auto layout (Automatically arrange nodes) in the diagram toolbar. The platform repositions nodes to reduce overlap and improve readability. Save the layout to keep the arrangement.
Download your ERD
The Diagram view lets you download the ERD to share data flows with stakeholders. Before you download, use the Filter dropdown to remove unnecessary packages, then select Download (Download diagram as image) from the upper-right corner to open the snapshot form.
The snapshot form gives you two options:
- Format: Choose the output format.
- SVG: Downloads the diagram directly as an SVG file.
- PDF: Opens your browser's print dialog. Select Save as PDF to complete the download.
- Export Area: Choose how much of the diagram to capture.
- Current View: Captures only the portion currently visible in the canvas.
- Full Diagram: Captures the entire diagram, including nodes outside the current viewport.
Select Download in the form to generate the file. While the snapshot is prepared, the button shows Downloading... and a "Preparing download..." message appears.