Visual Notebooks in Visual Notebooks
Visual notebooks are the heart of Visual Notebooks. Use visual notebooks to import data from one or more sources, transform and wrangle data, perform statistical analyses, train machine learning models, create visualizations, export data, and leverage saved Visual Notebooks assets.
When you create a new visual notebook, the following screen is displayed.
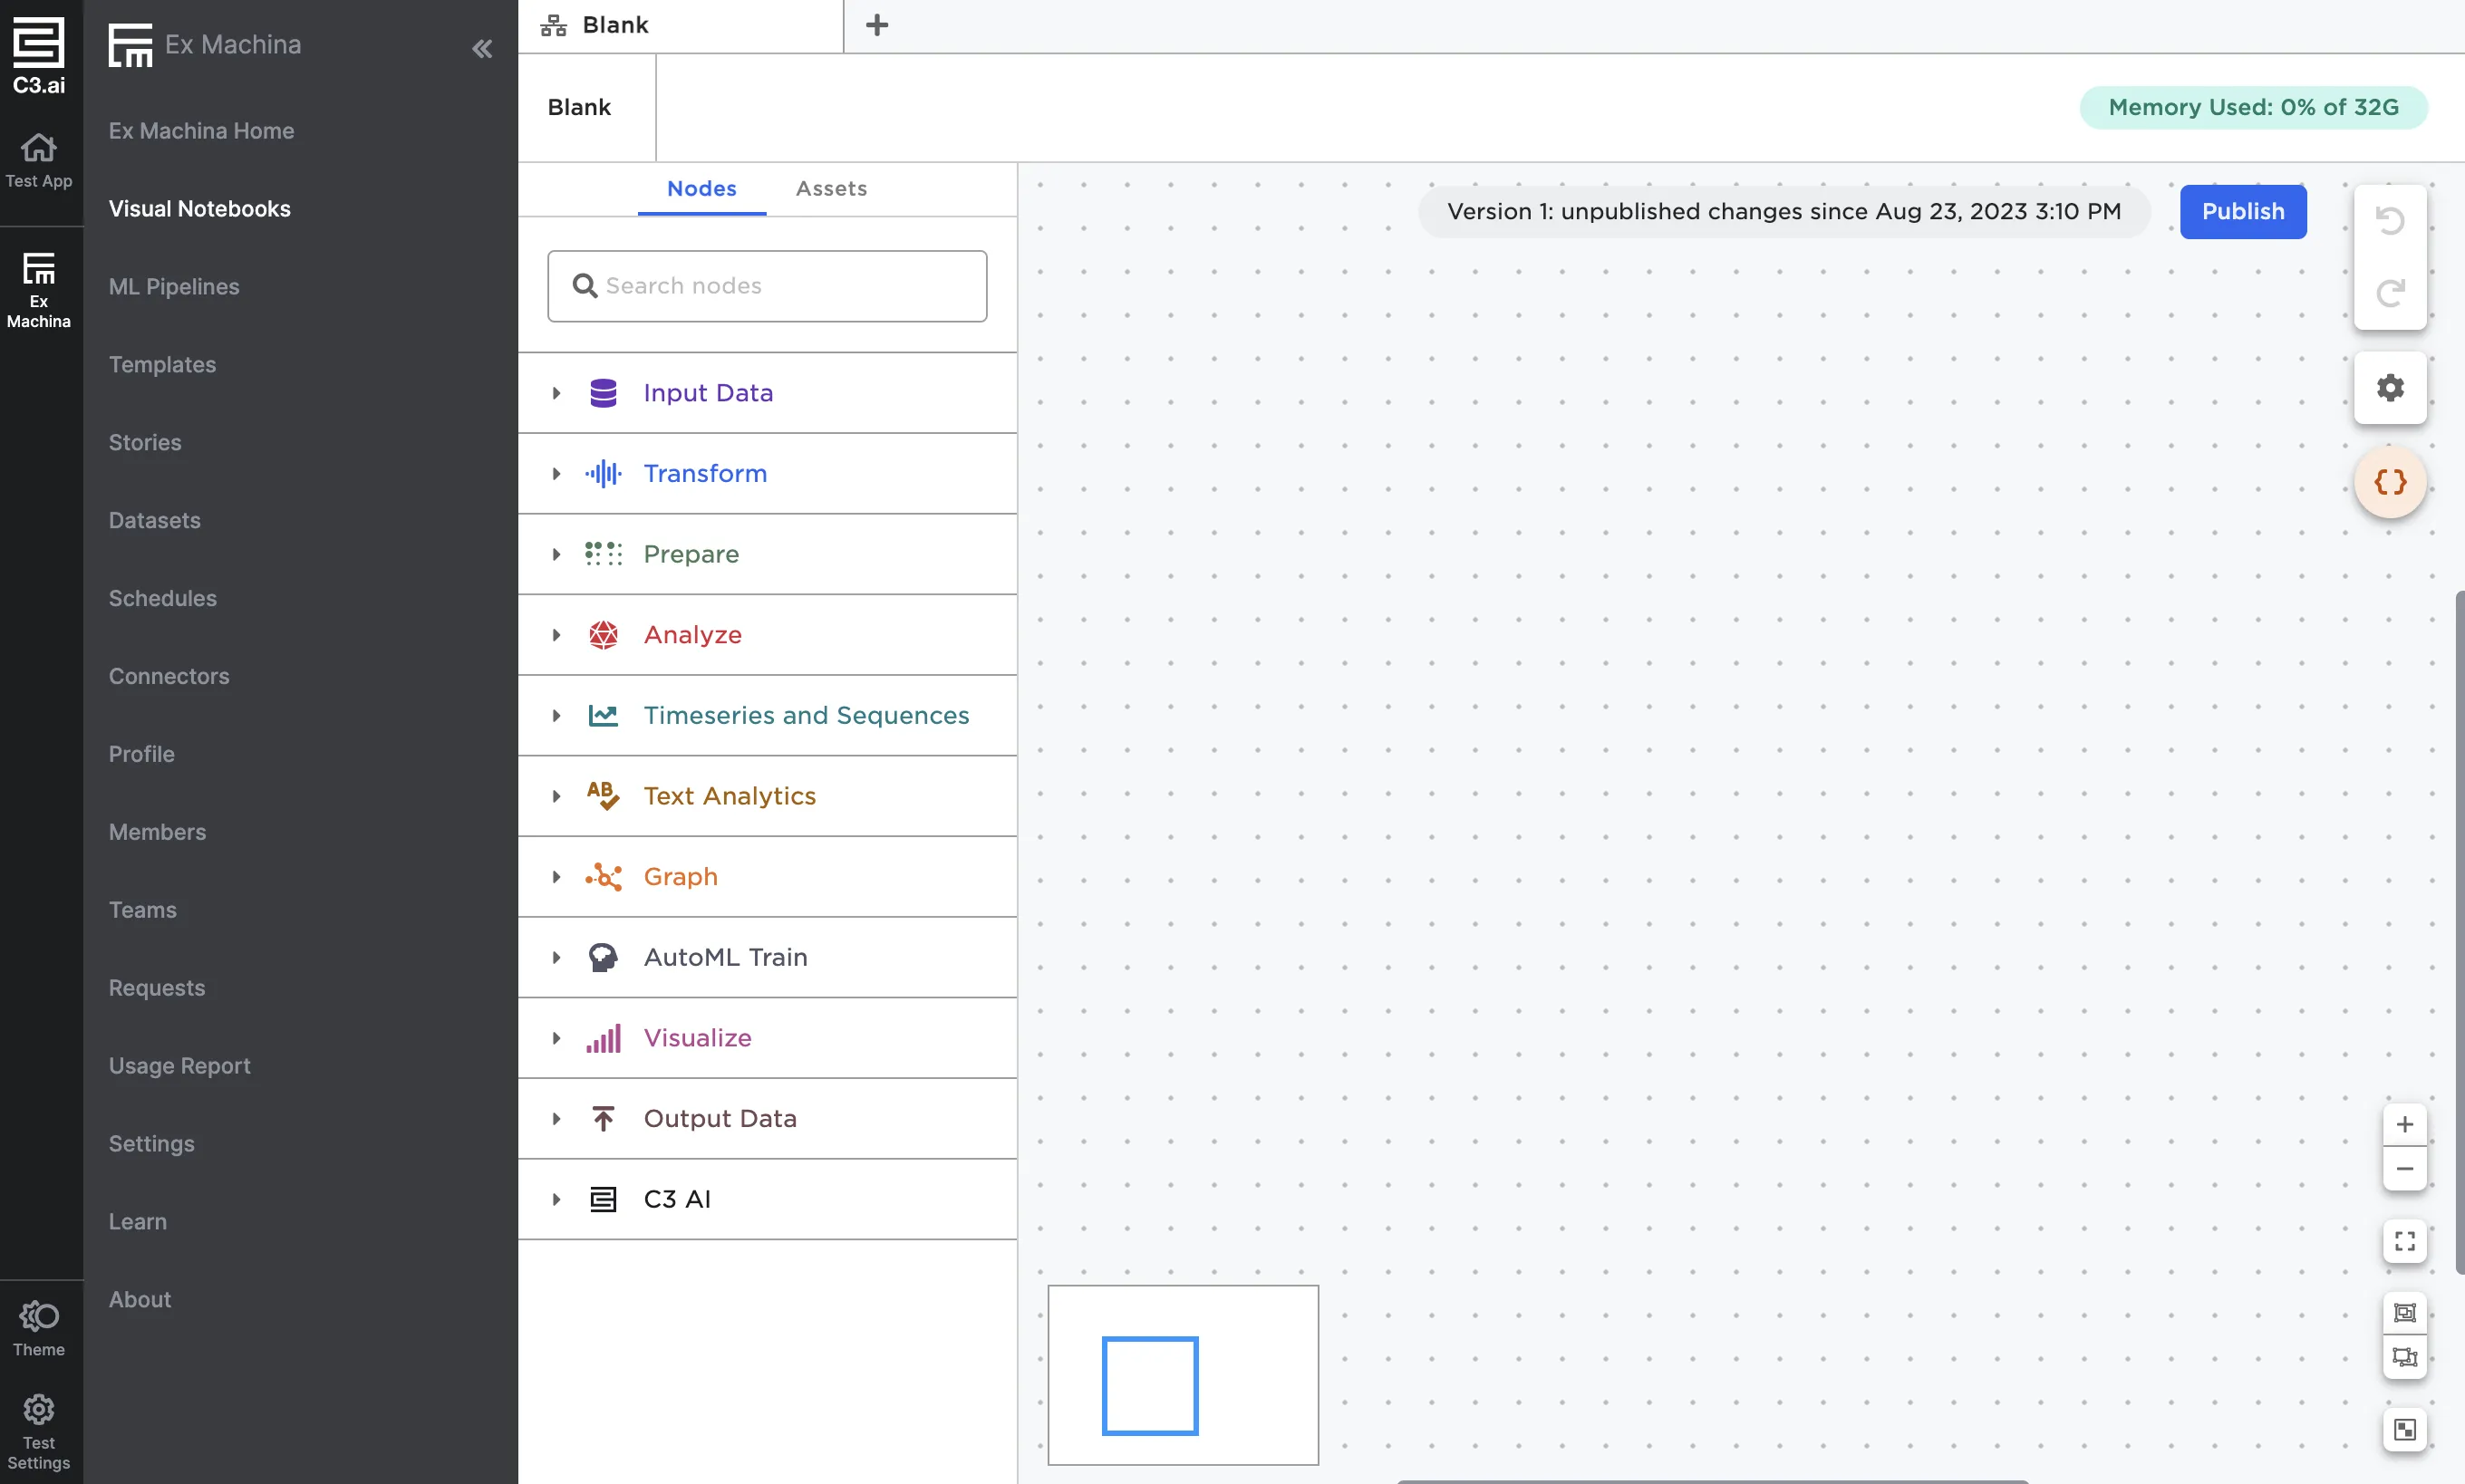
Figure 1: Blank visual notebook
Across the top of the screen are tabs that show open visual notebooks and pipelines. Select the x icon to close an open visual notebook or pipeline. Select the + icon to create or load an existing visual notebook or pipeline.
There are two main components of the visual notebook interface: the node palette and the canvas. The node palette is the vertical column with colorful, collapsible sections, while the canvas is the dot grid section to the right.
In Figure 2 below, the node palette is outlined in pink, and the canvas is outlined in blue.
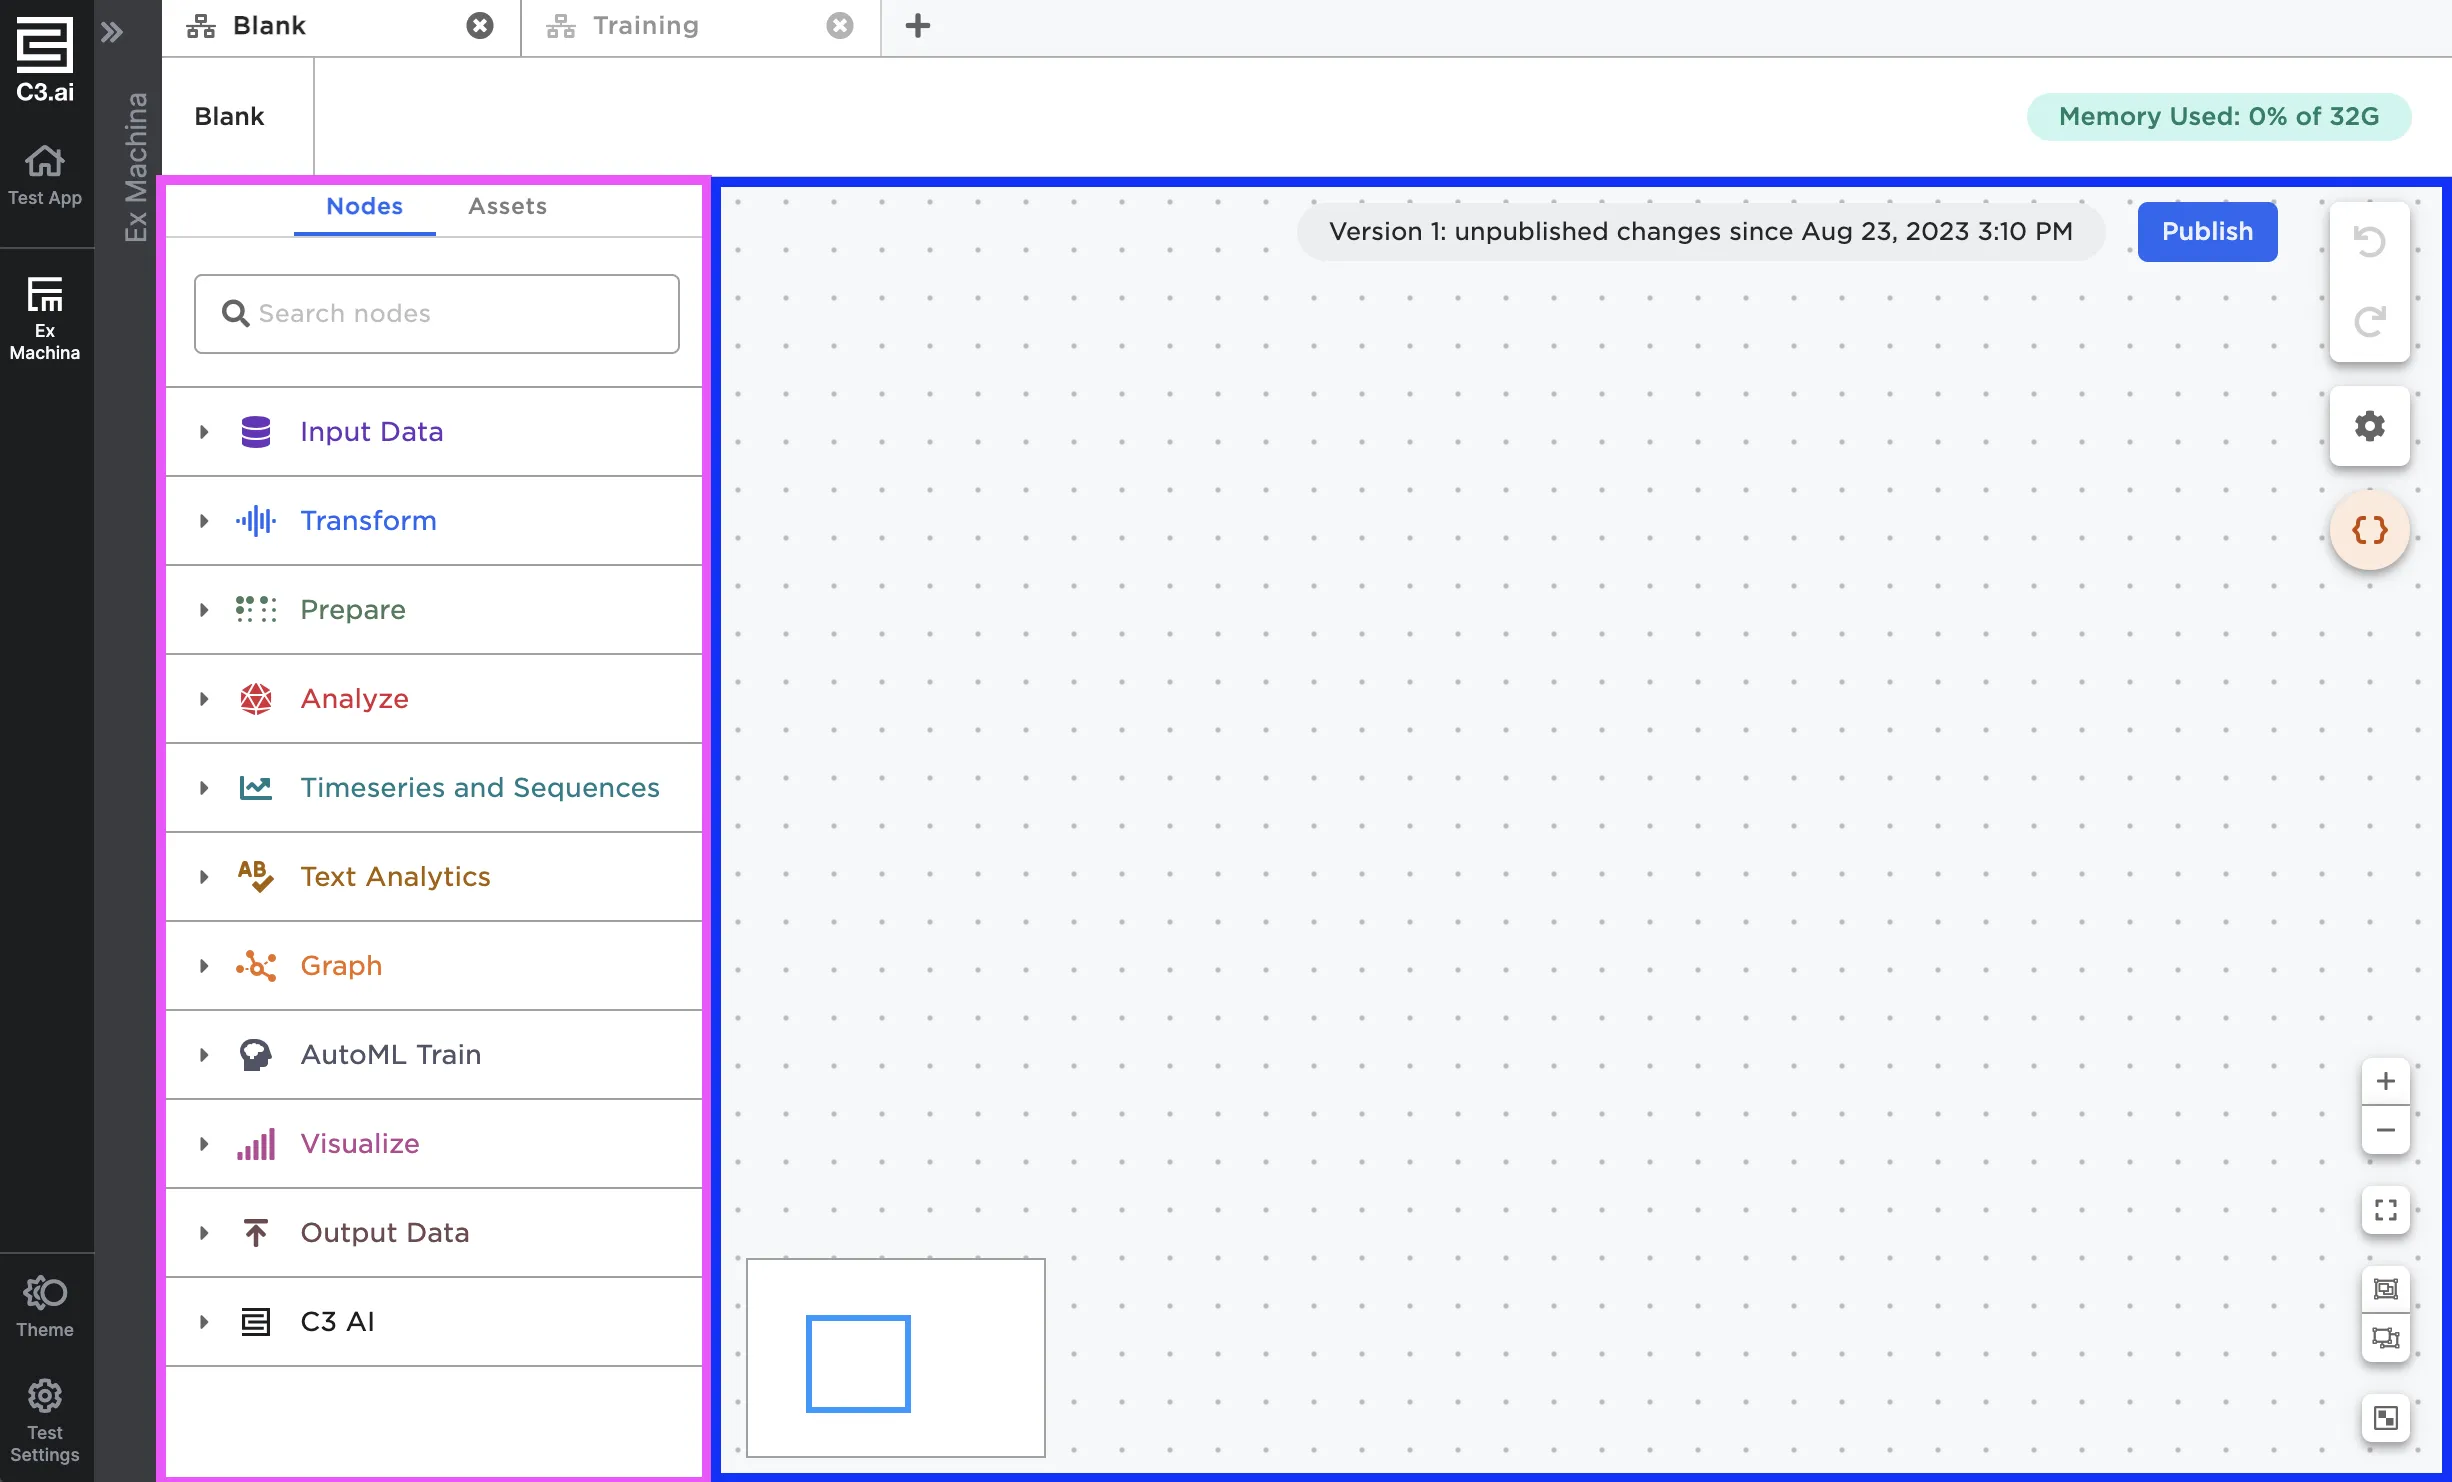
Figure 2: Visual notebook sections
Node Palette
The node palette has two panels: Nodes and Assets.
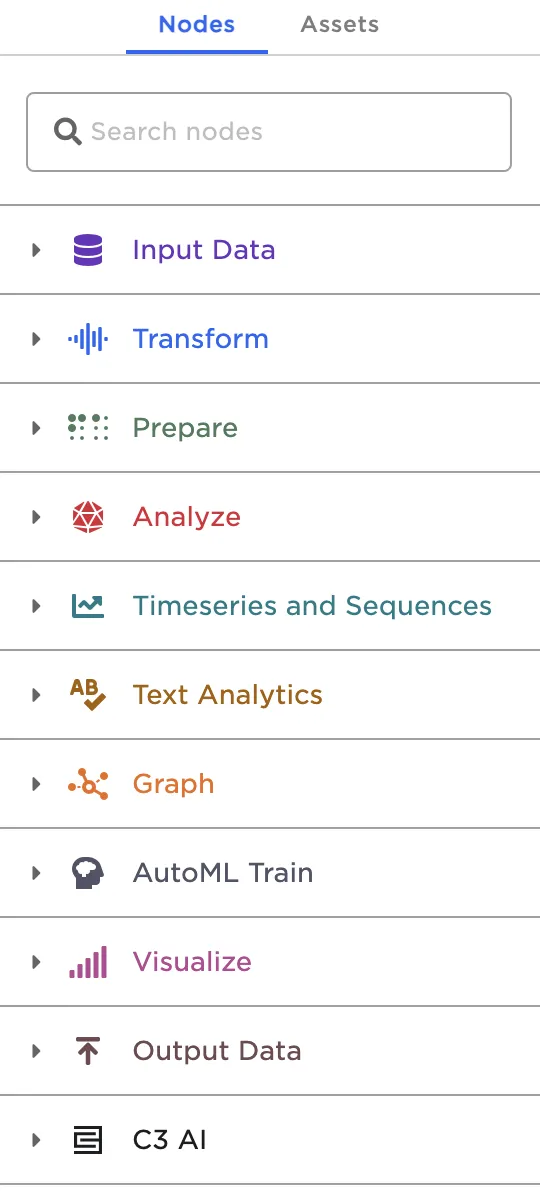 Figure 3a: Node panel
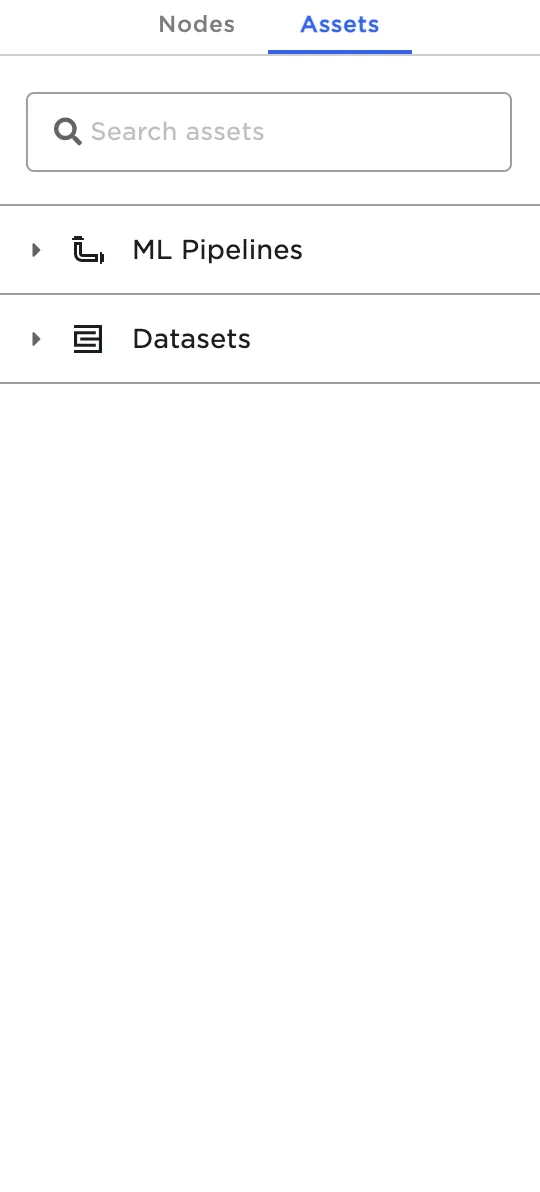 Figure 3b: Asset panel
At the top of the node palette is a search bar so you can quickly find the node or asset you are looking for.
Nodes
Nodes contain the majority of Visual Notebooks's functionality and are used to accomplish tasks. Nodes are separated into categories.
- Input Data: Import data into Visual Notebooks from your computer or from cloud storage systems
- Transform: Edit, combine, split, and clean data
- Prepare: Encode, scale, and impute data
- Analyze: Perform statistical analysis
- Timeseries and Sequences: Edit timeseries data and create new features
- Text Analytics: Prepare string columns
- Graph: Maximize insights from graphs
- AutoML Train: Train machine learning models
- Visualize: Create charts, graphs, and other visualizations
- Output Data: Export data to cloud storage systems
- C3 AI: Integrate with other C3 AI products
Inside each category are subcategories that further organize the available nodes. Hover over a node to read its description.
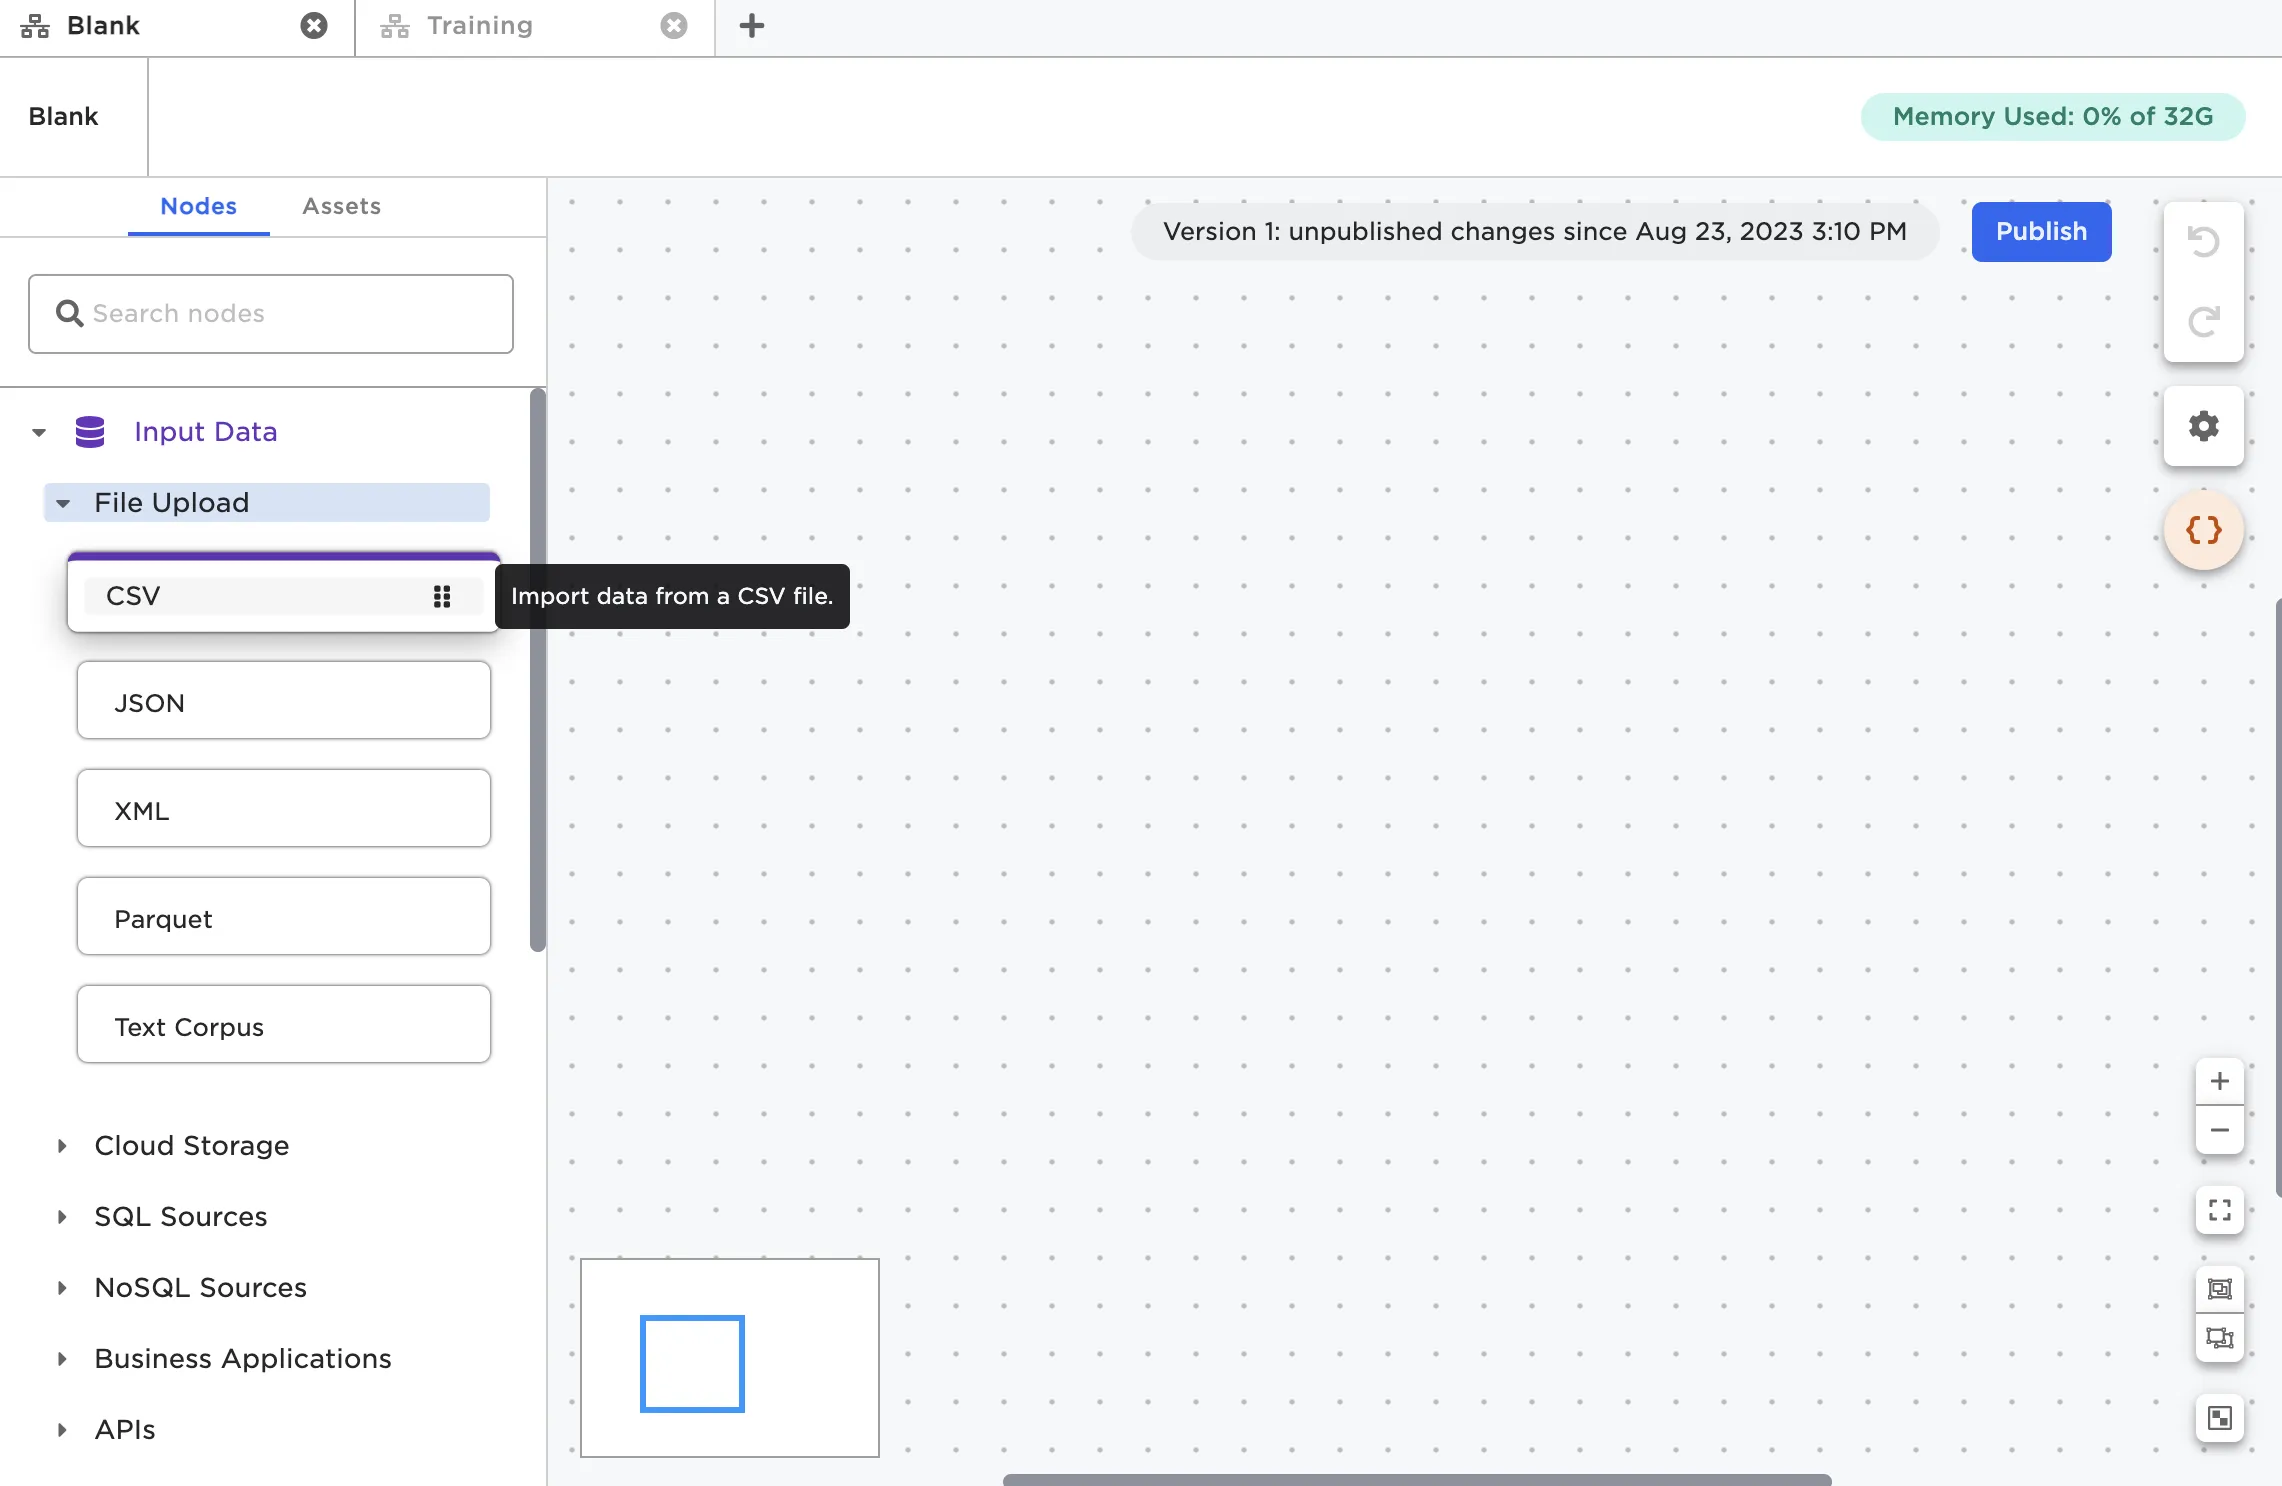
Figure 4: Nodes inside a subcategory
Assets
Assets are shareable, versioned resources in Visual Notebooks. From the Assets panel, you can access two specific assets: ML Pipelines and Datasets. ML Pipelines are combinations of nodes that output a trained model capable of making predictions on unseen data. Datasets are snapshots of data saved in Visual Notebooks that can be shared with team members.
Expanding either category loads all available assets of that type. Select Owned to view assets that you have created, Shared to see assets that have been shared with you, and Public to see publicly-available assets.
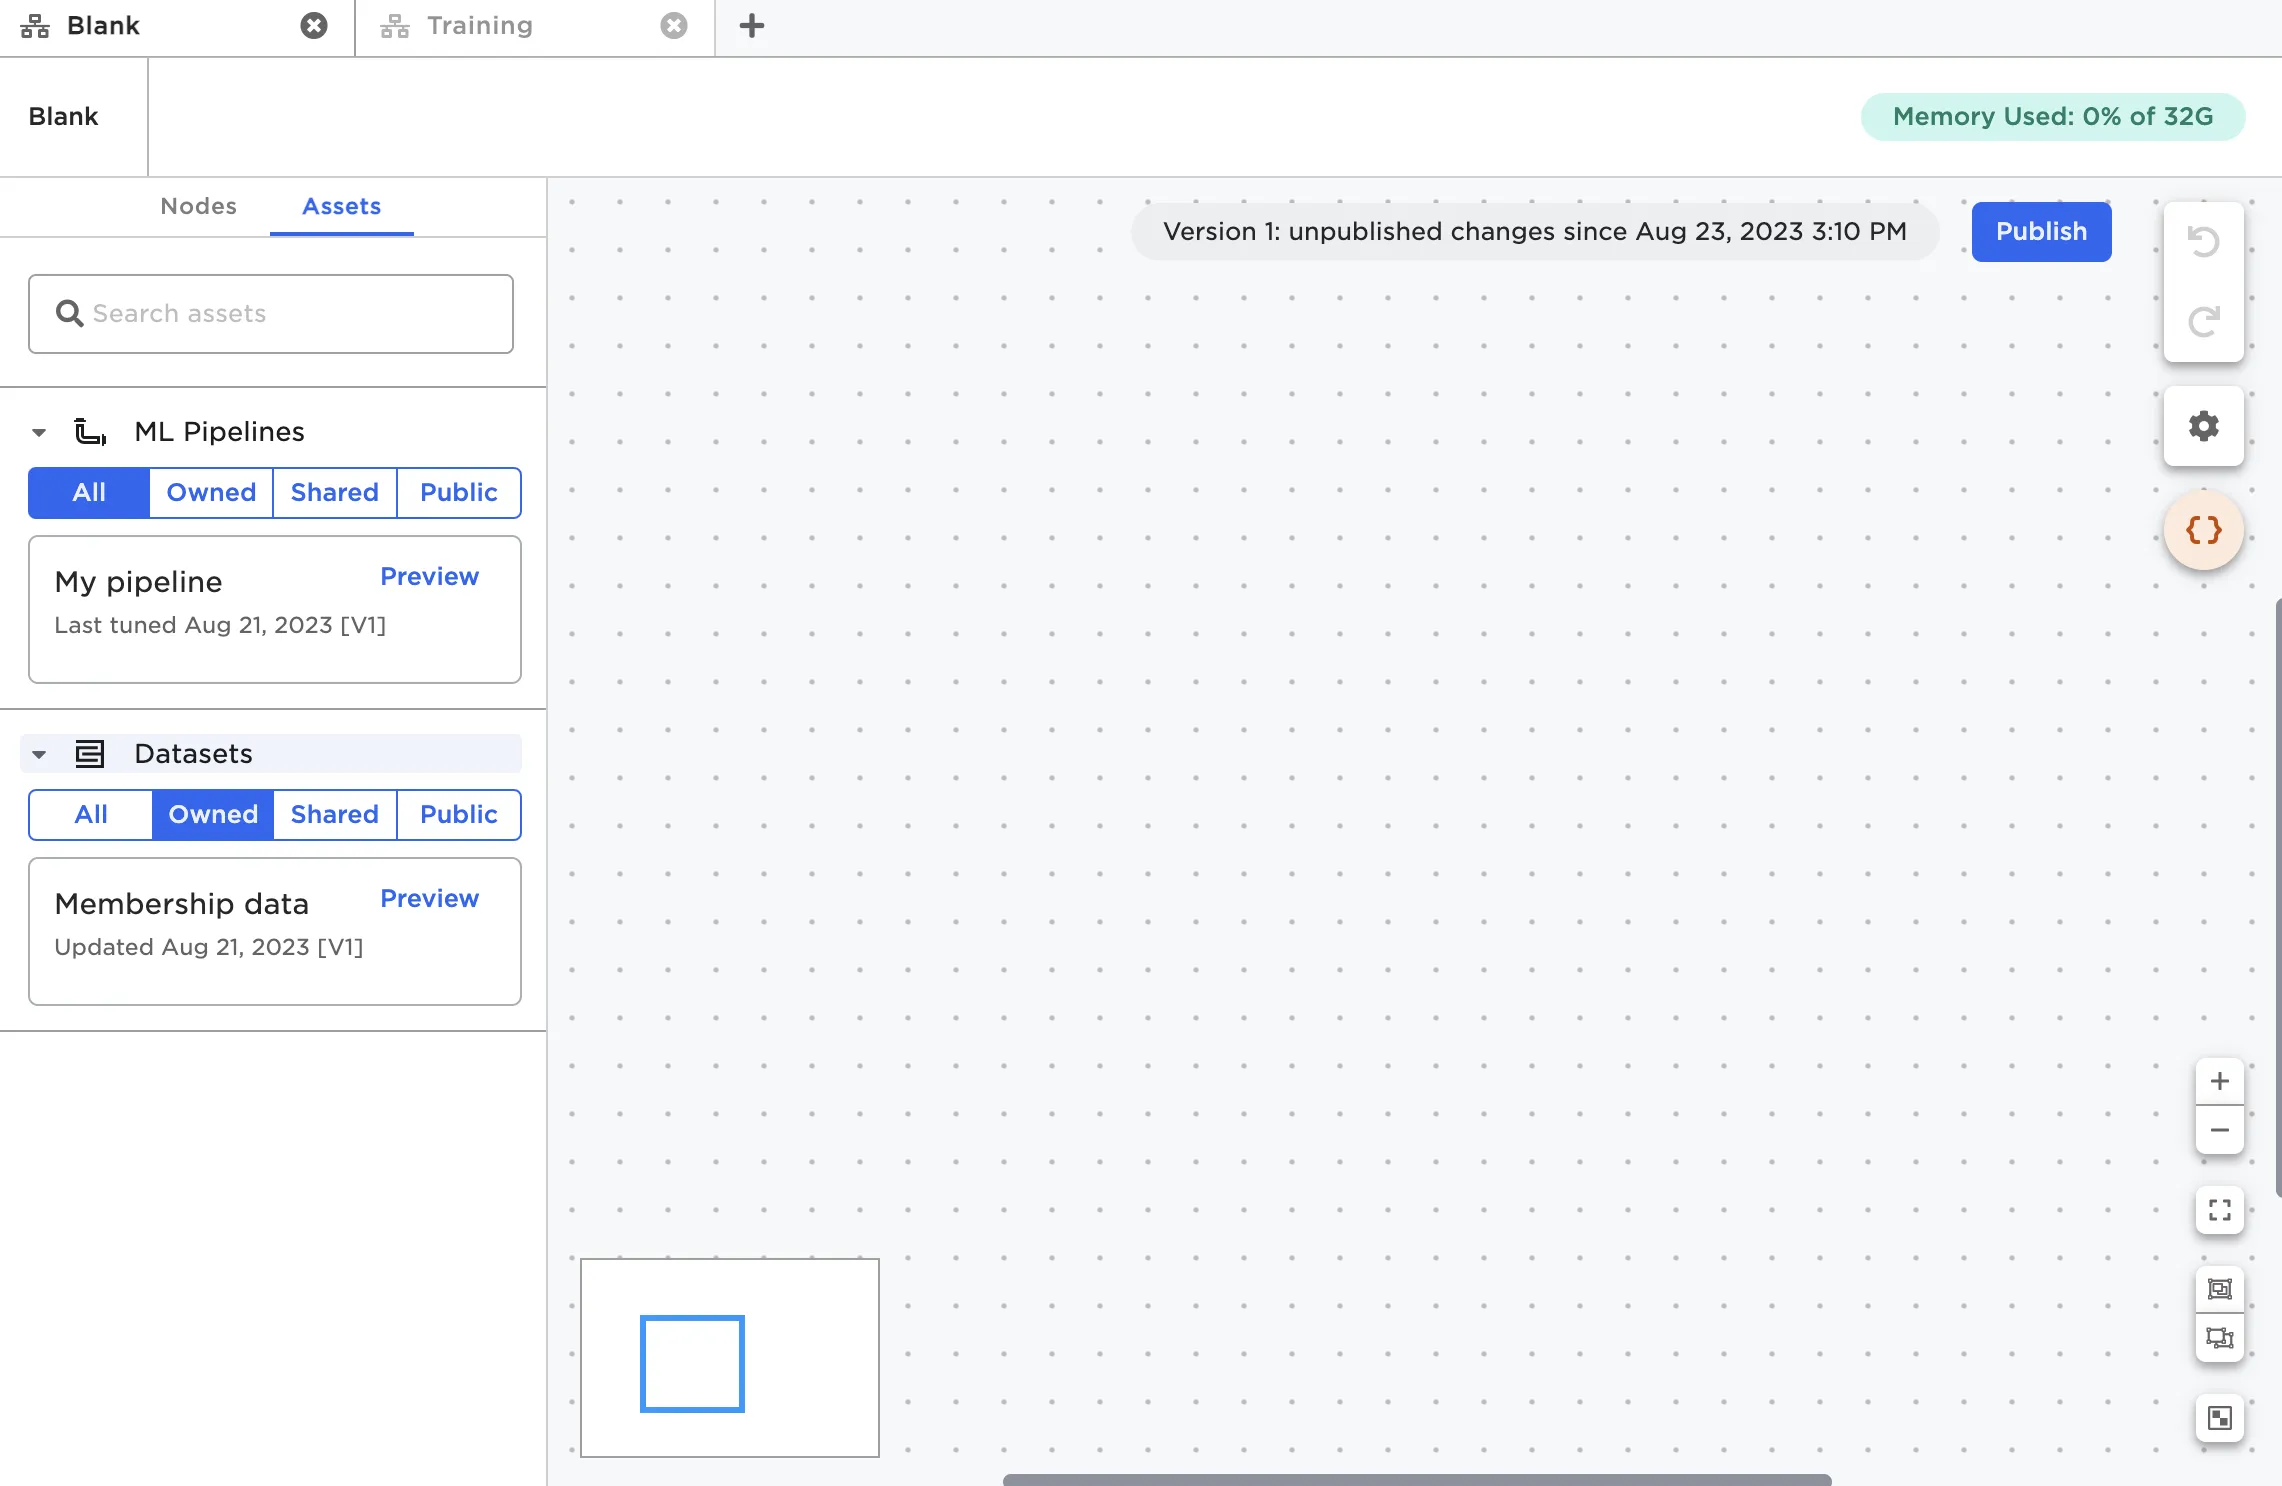
Figure 5: Available assets
Select Preview to view a summary of a specific asset.
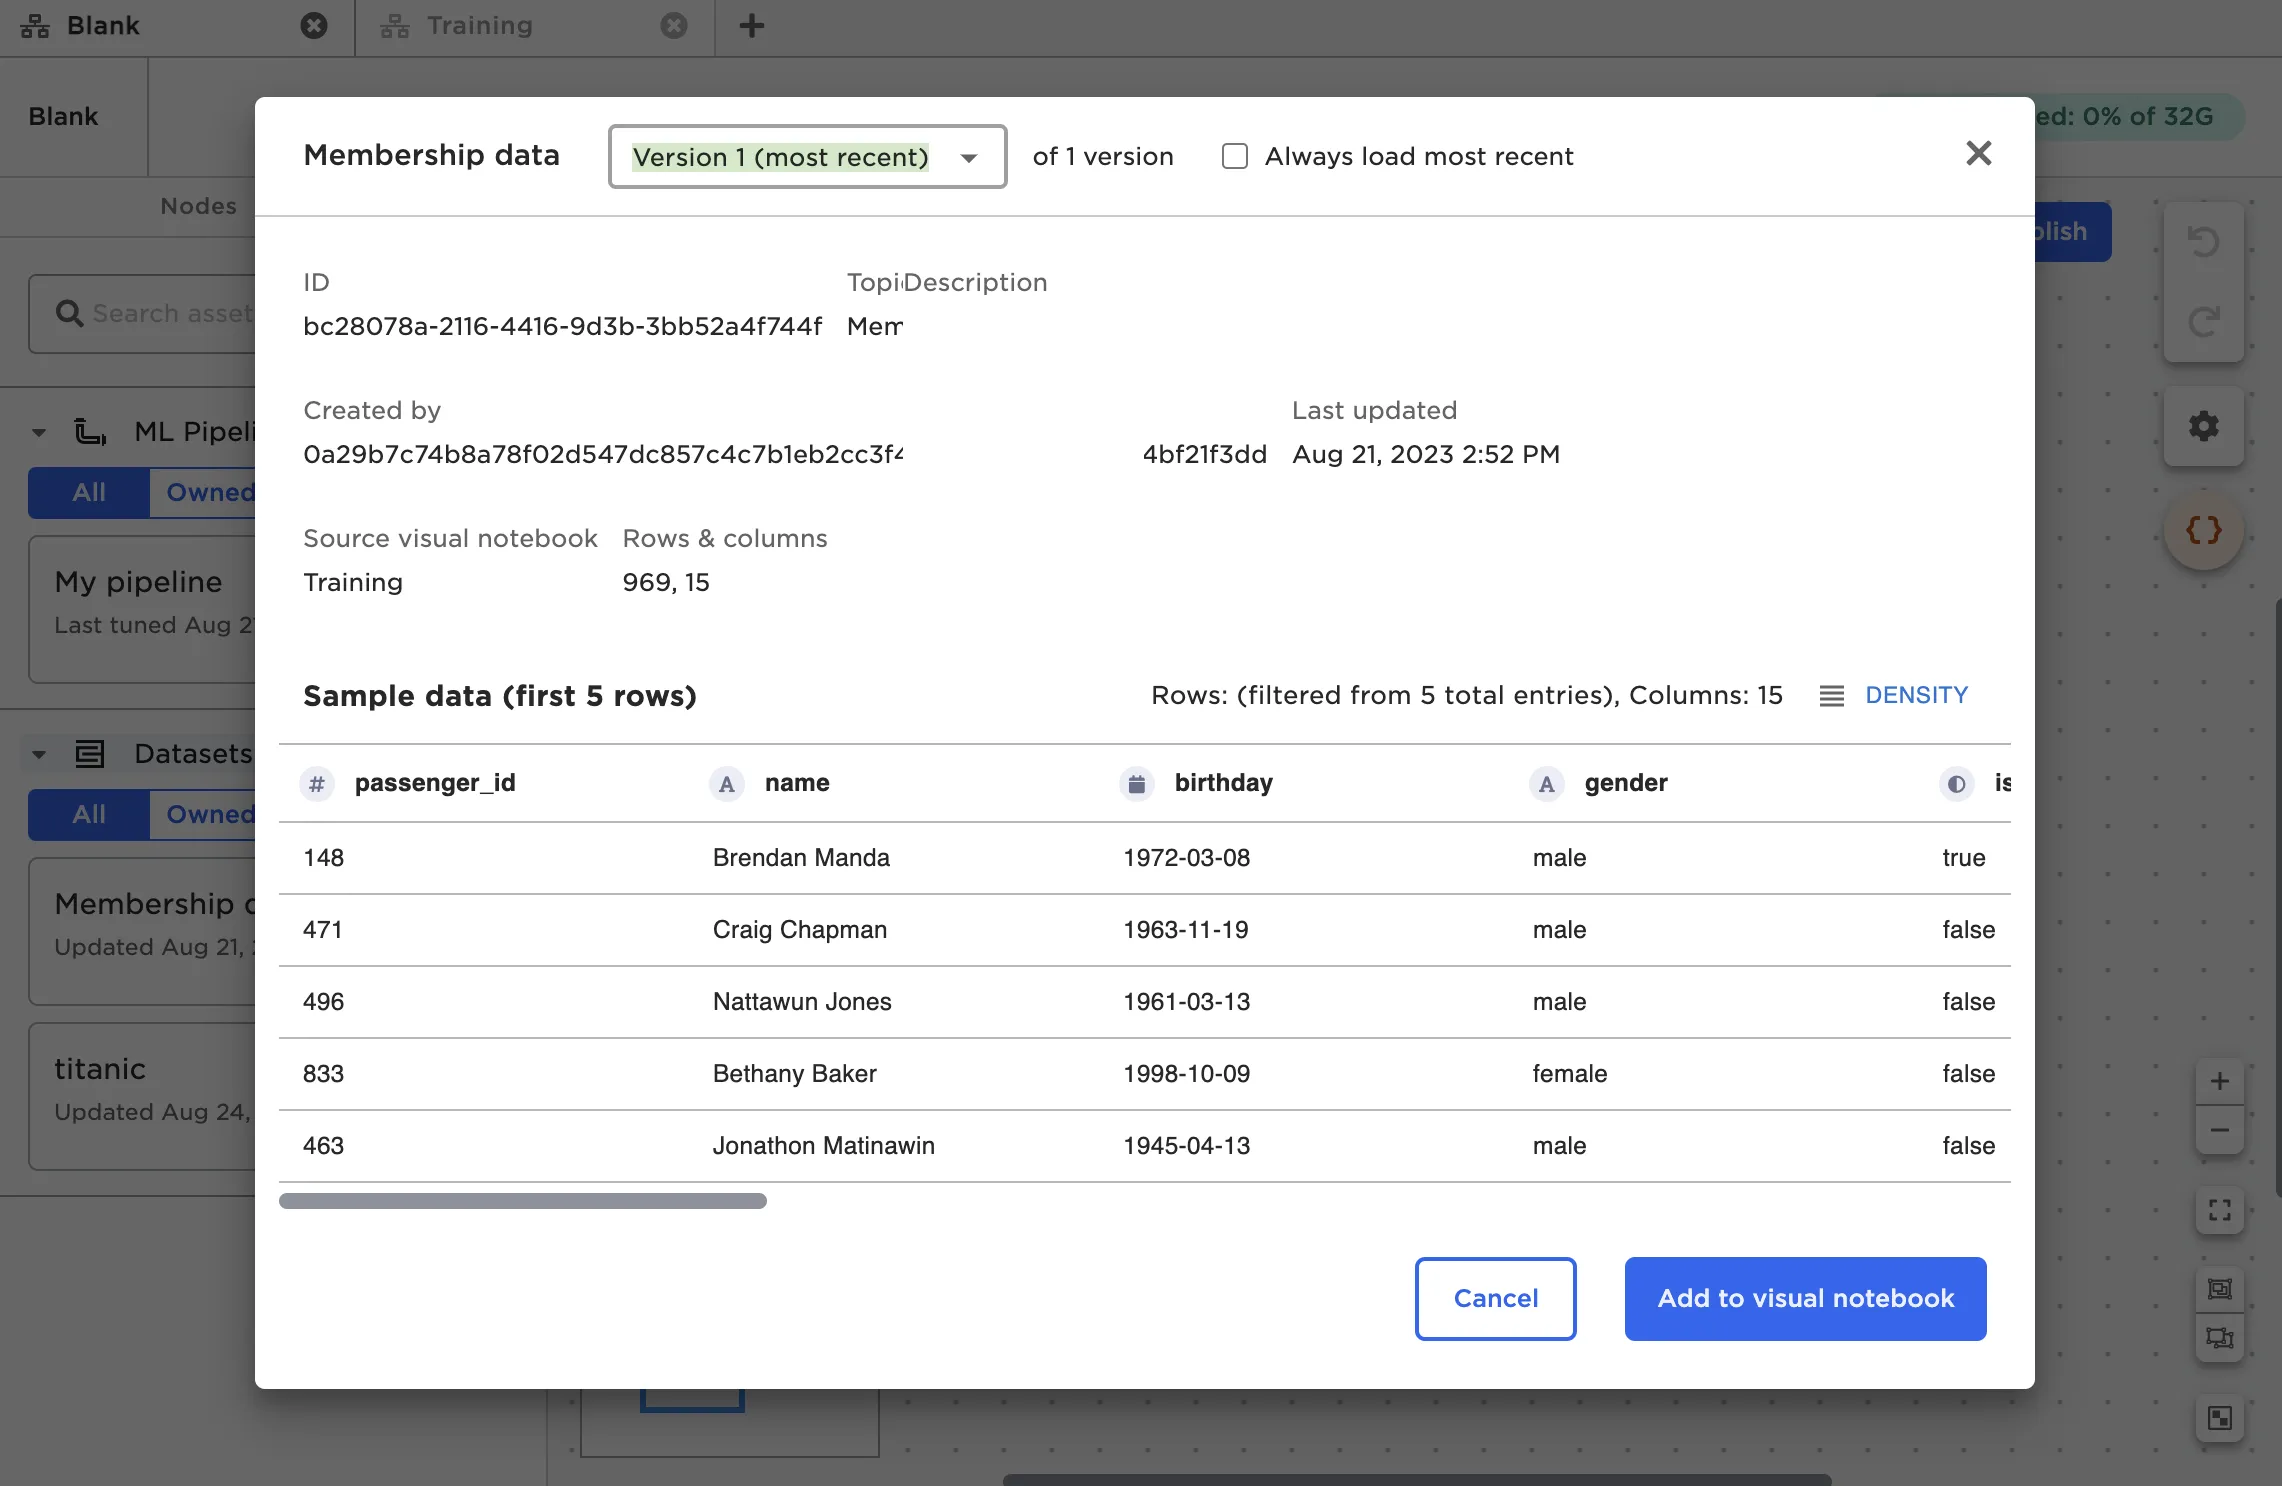
Figure 6: Dataset asset preview
Canvas
The canvas has several features designed to make work in Visual Notebooks more efficient. These features are numbered in Figure 7 and explained below.
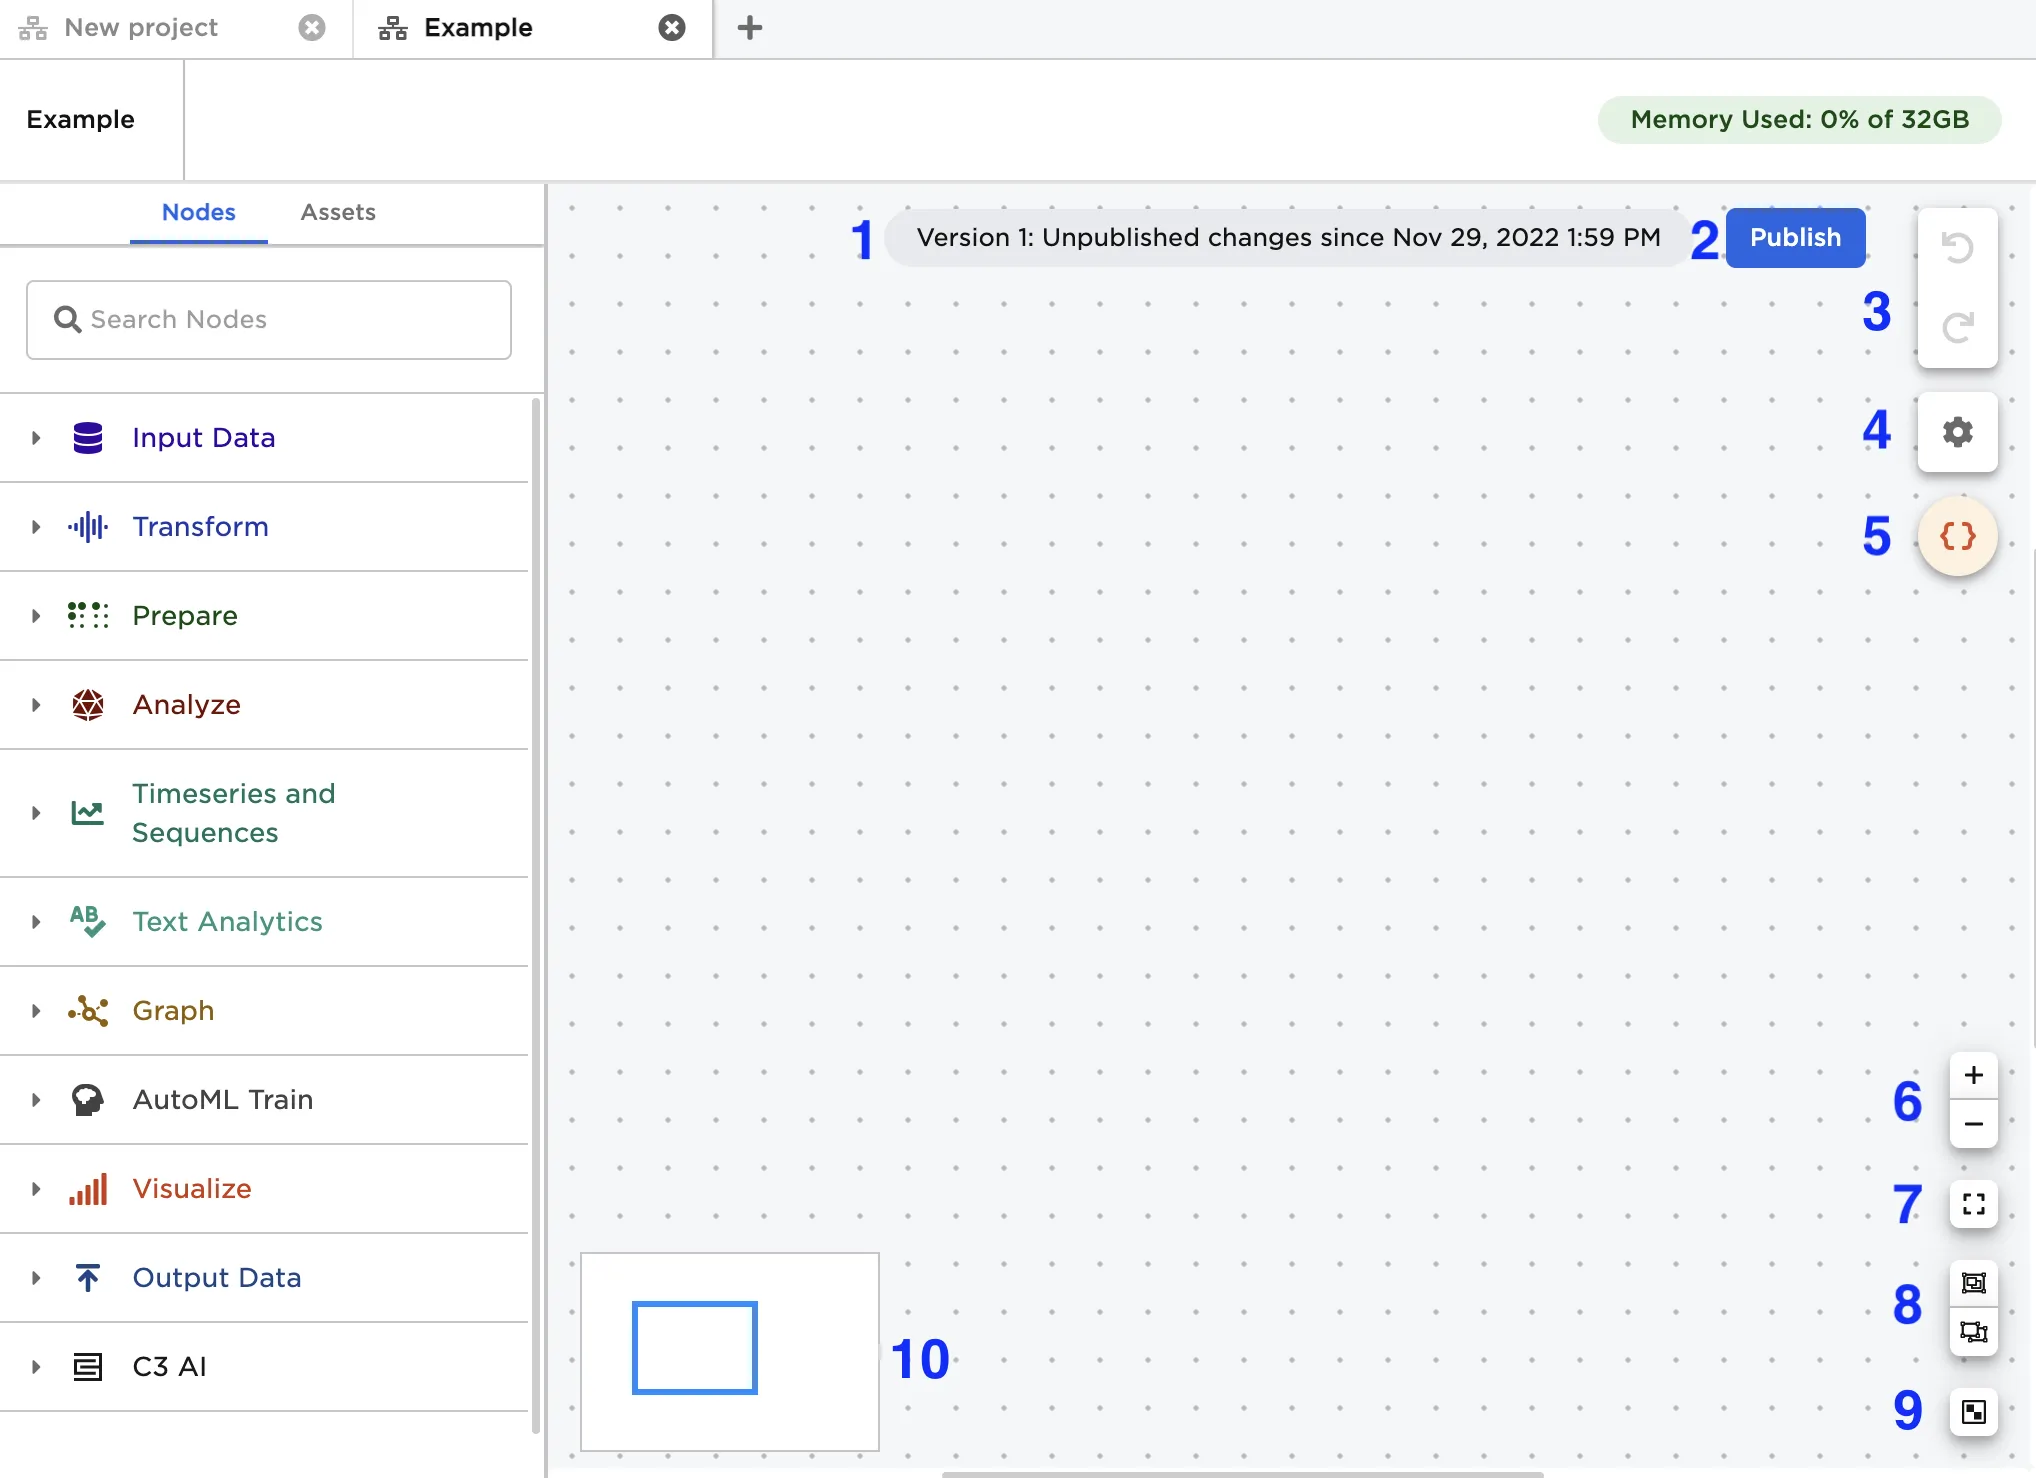
Figure 7: Blank visual notebook
- This gray pill shows the current version number and the date the visual notebook was lasted edited. Select this pill to open a view of the visual notebook lineage and revert to an earlier version if desired
- Publish a new version of the visual notebook
- Undo and redo recent actions
- Add a visual notebook description
- Manage visual notebook parameters. For more information about parameters, see the section on automation
- Zoom in or zoom out of the canvas
- Zoom to the default canvas view
- Group or ungroup nodes on the canvas
- Arrange all nodes on the canvas
- View your location on the canvas within this miniature map
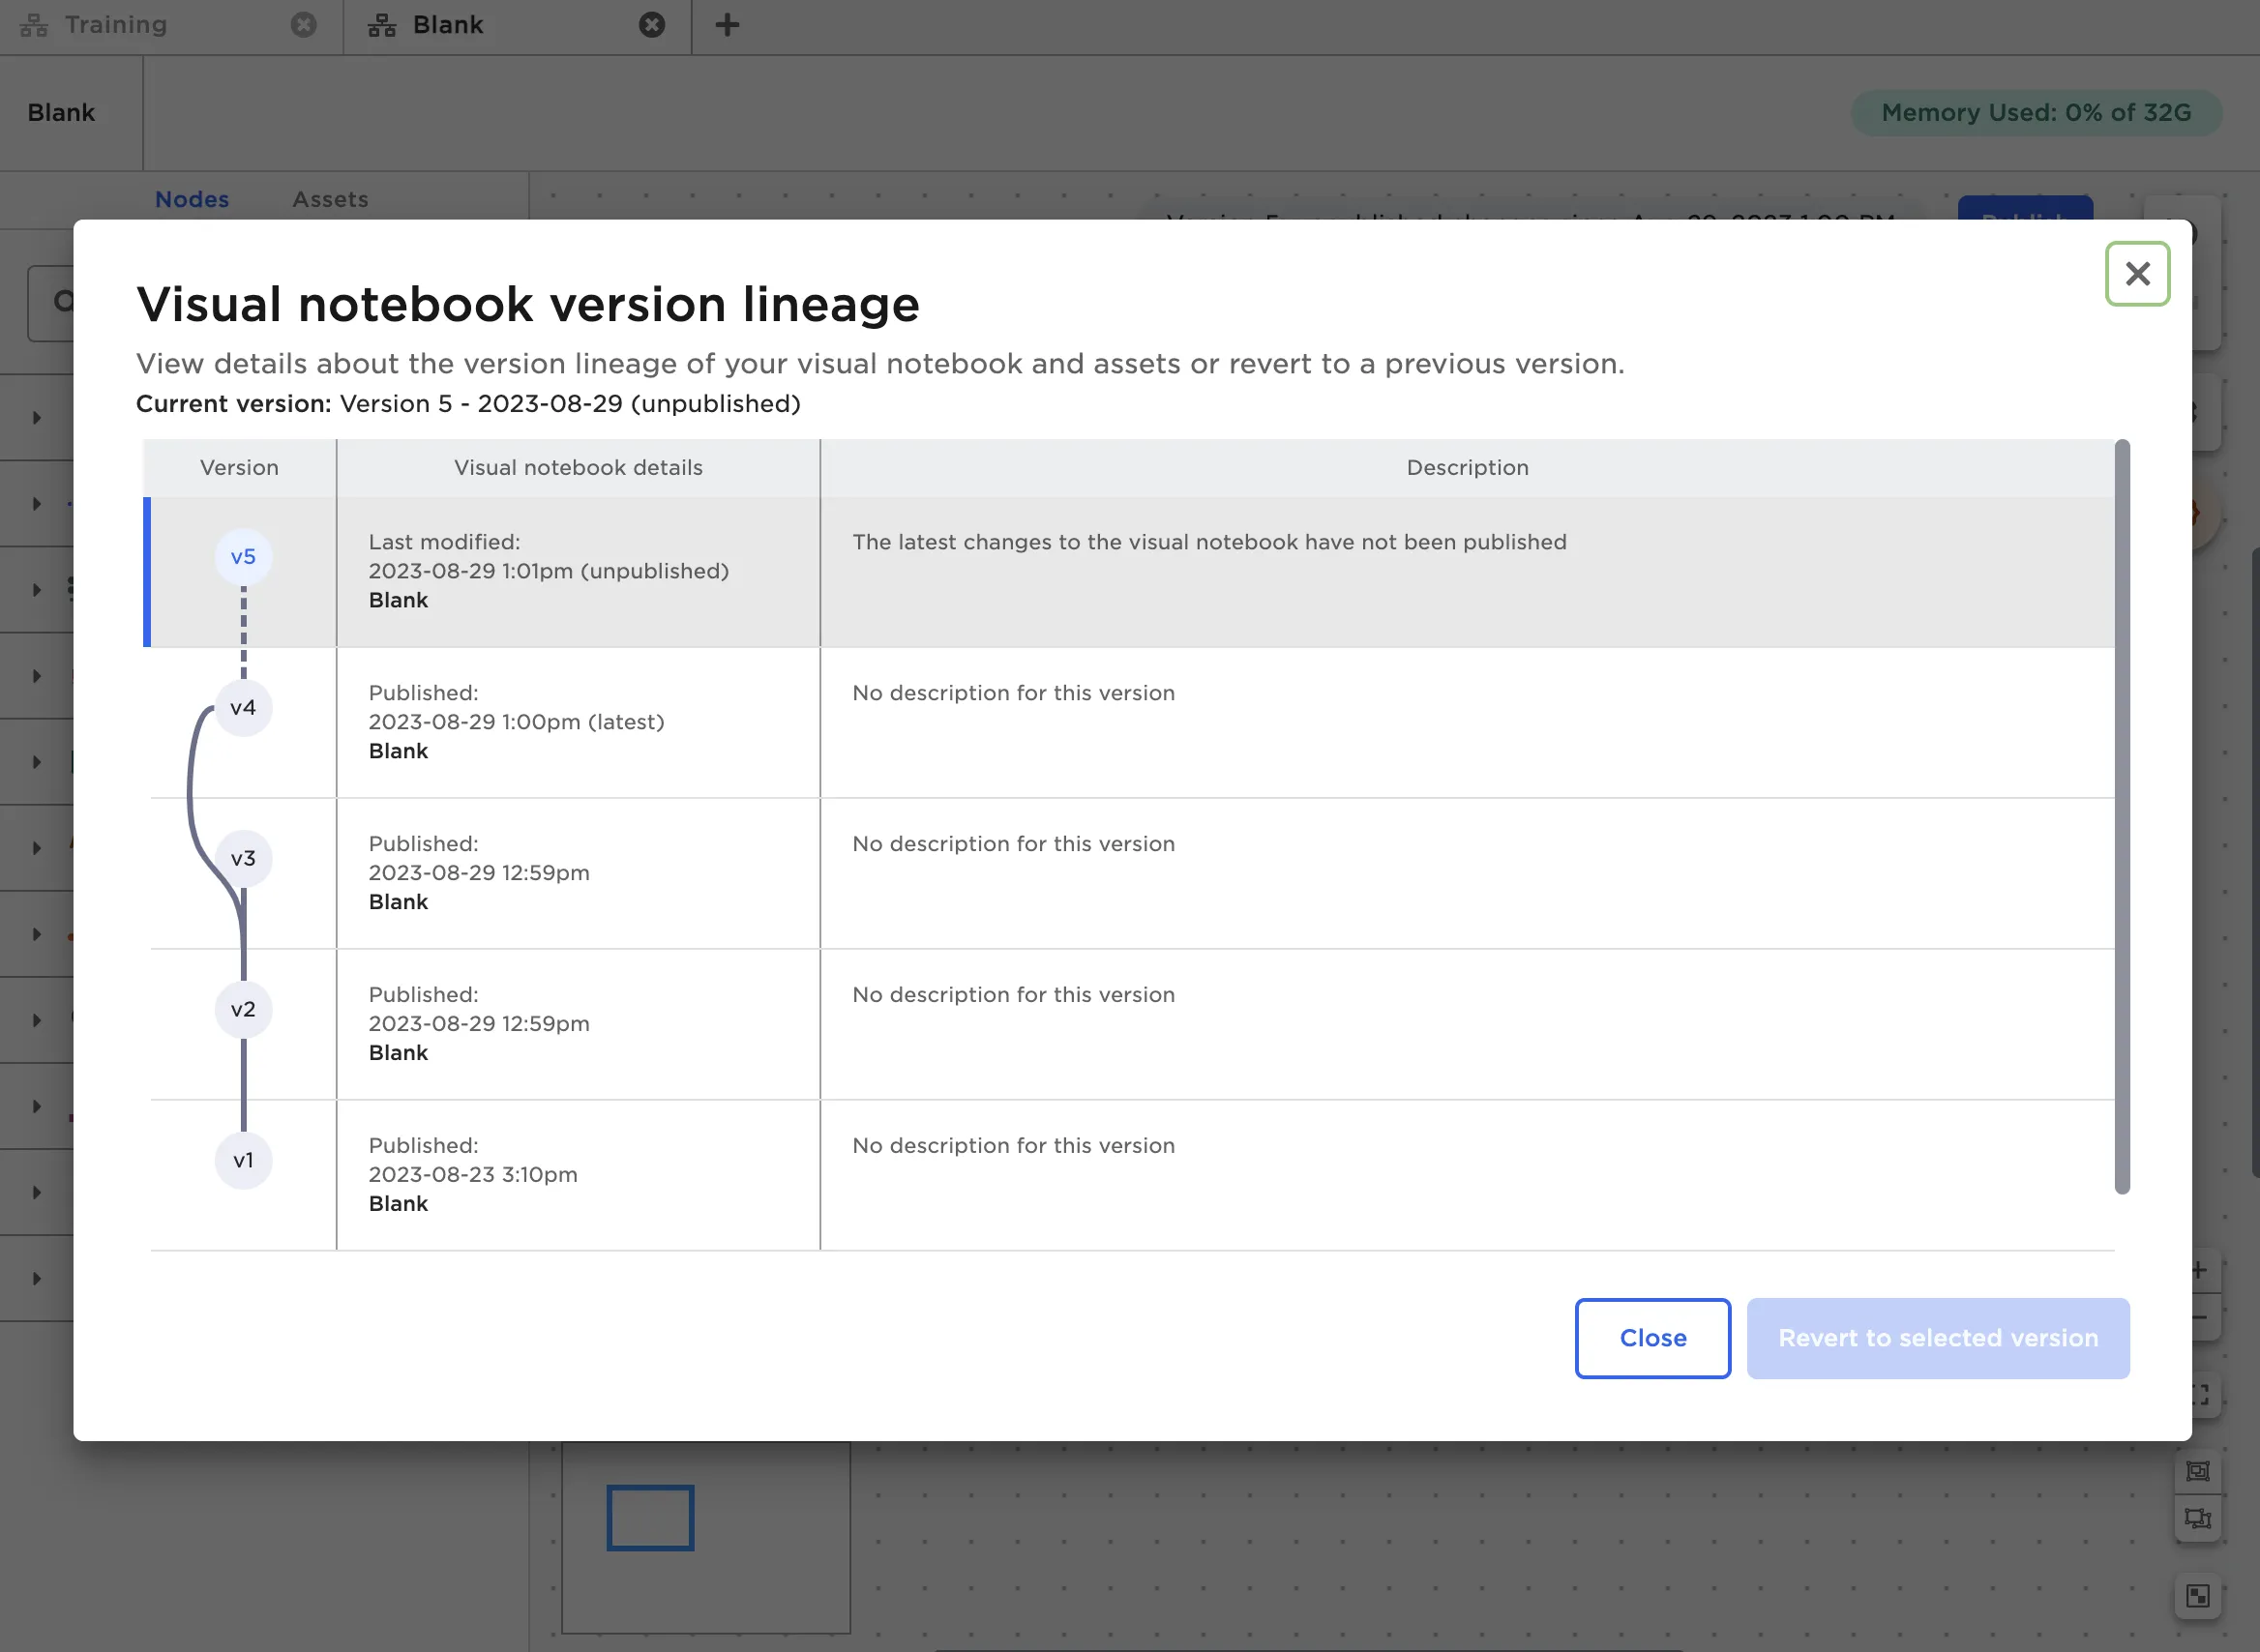
Figure 8: Visual notebook lineage modal that appears when selecting the gray pill
The Visual Notebooks canvas is keyboard-accessible. See the Keyboard Controls document for a list of available shortcuts.
Dark Theme
Visual Notebooks offers both a light and dark theme. To toggle between themes, select the sun and moon icon in the bottom left corner of the screen from any page in Visual Notebooks. This icon is outlined in pink in Figure 9 below.
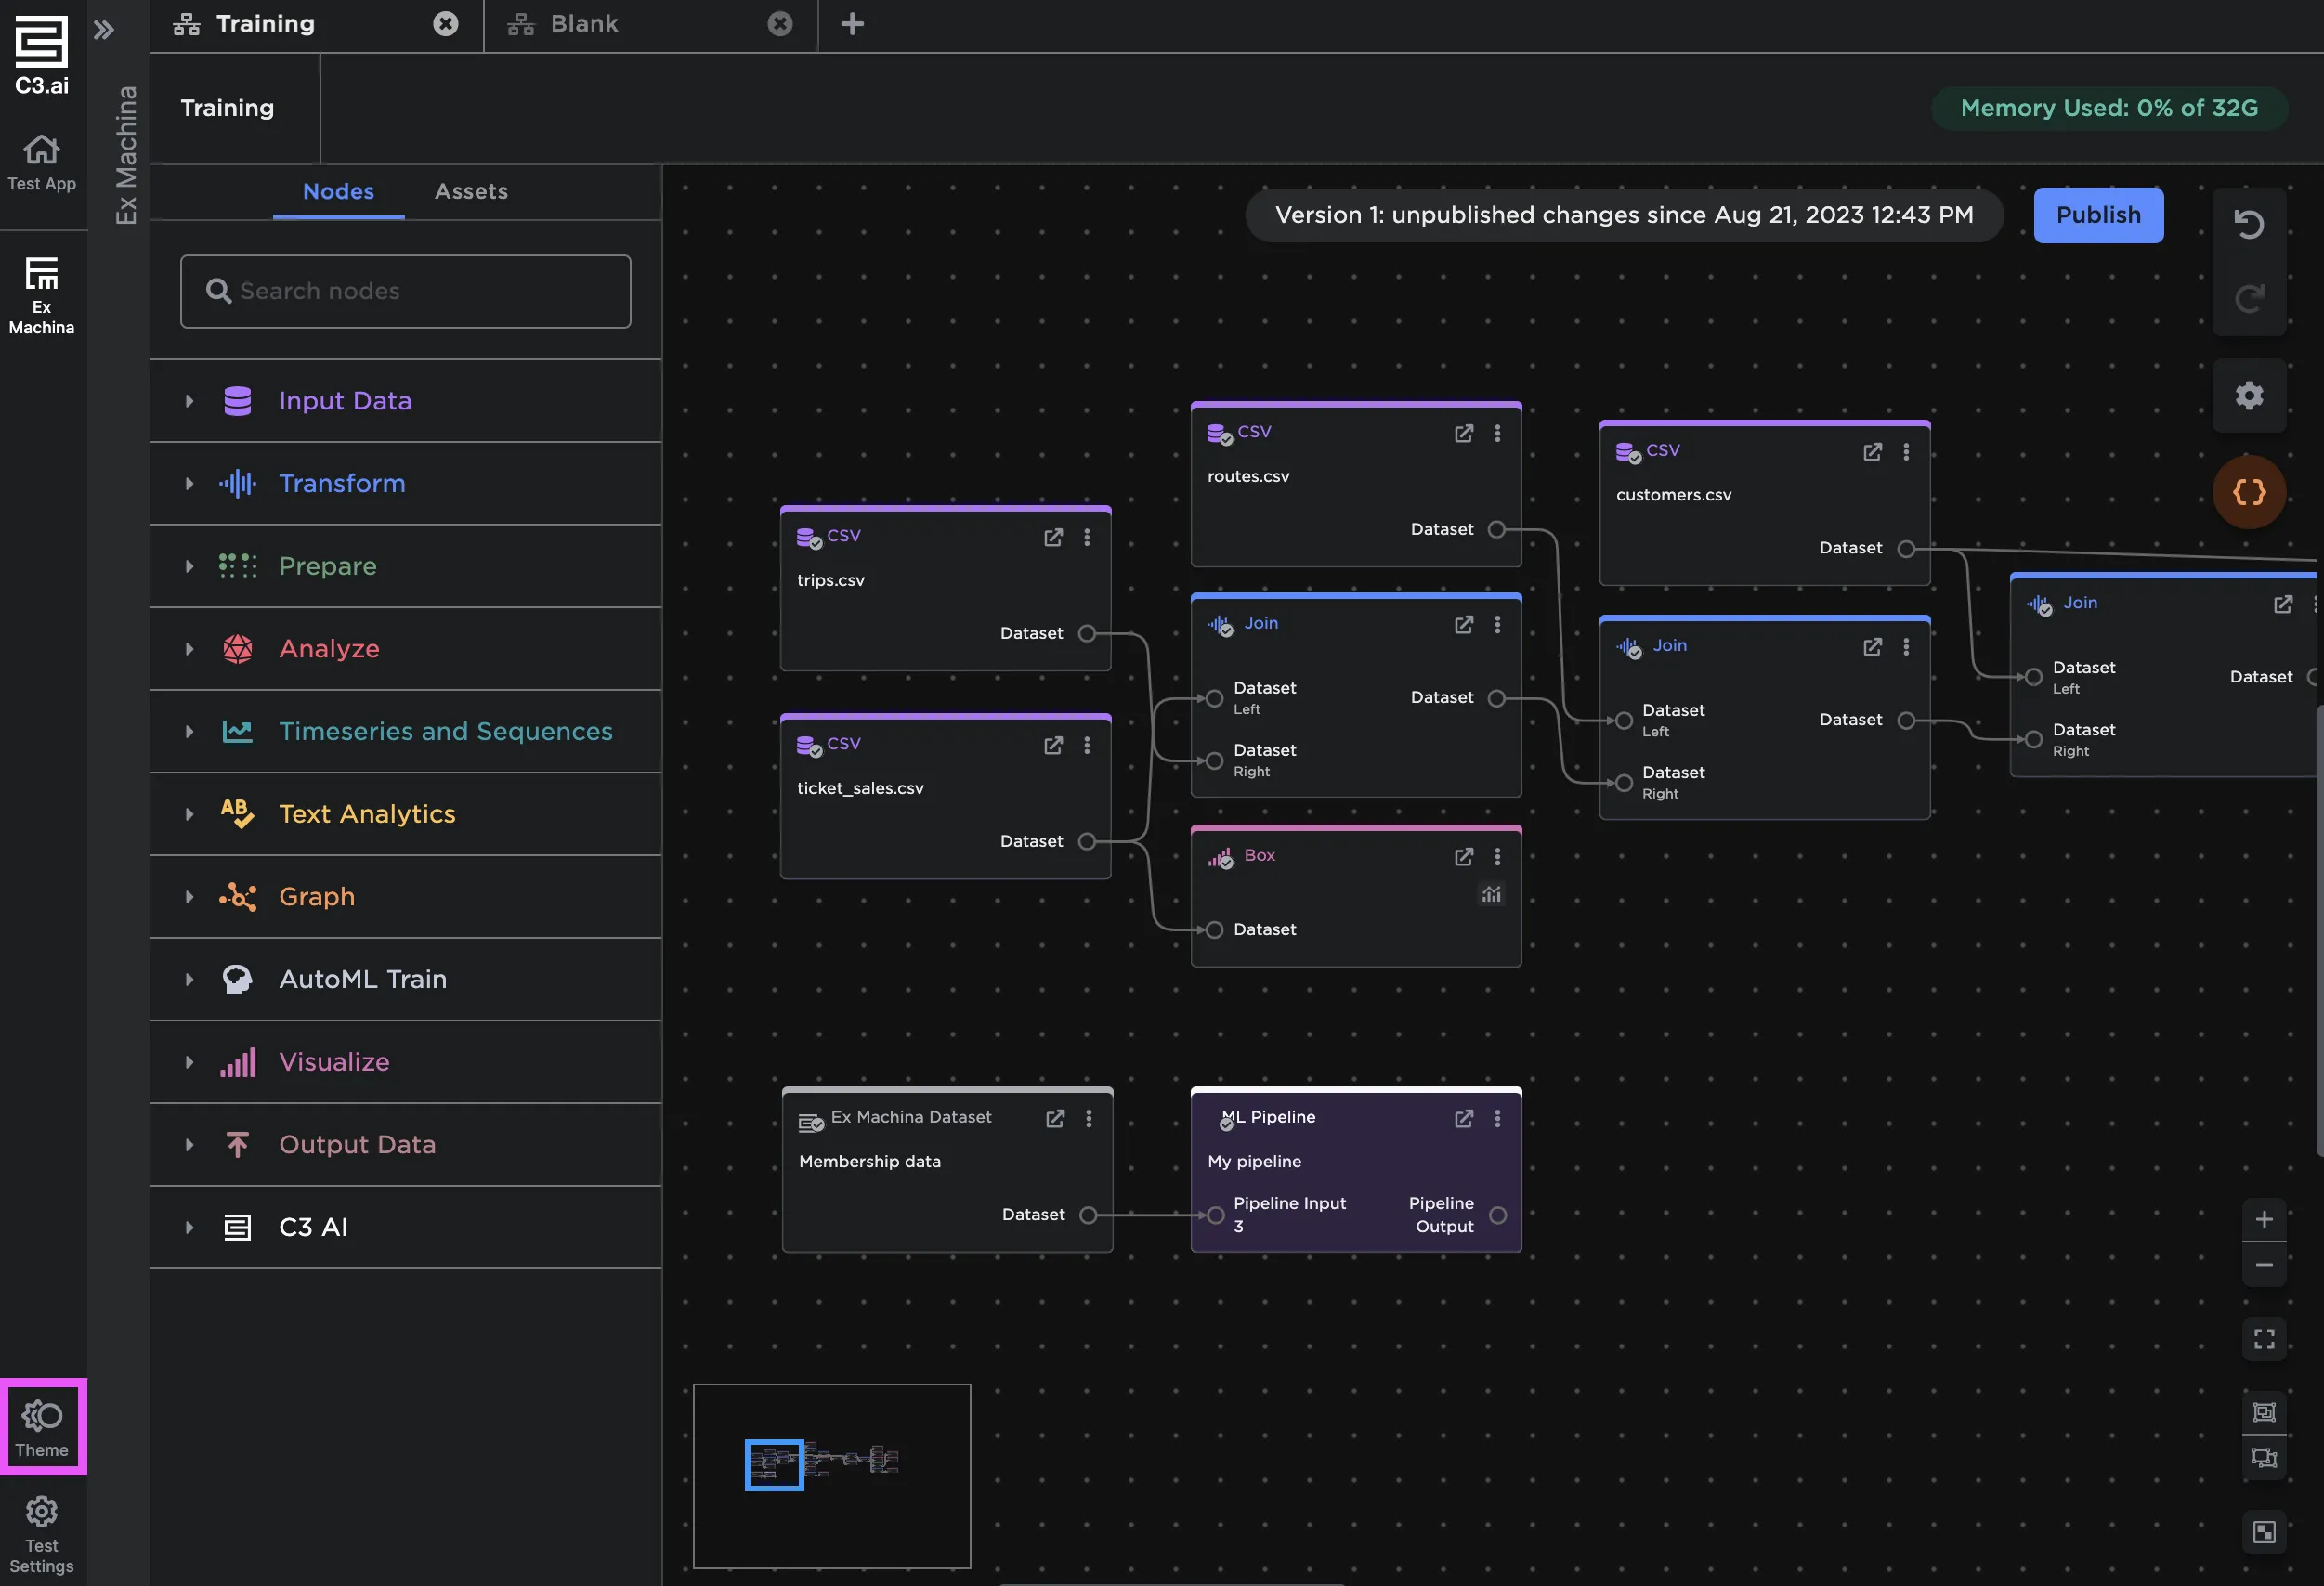
Figure 9: Canvas dark theme