Navigating Visual Notebooks
The main tool for navigation in Visual Notebooks is the left sidebar. Expand the sidebar to navigate to a different page in the product. When you're working in a specific page, you can collapse the sidebar to maximize space on the screen.
Visual Notebooks Home
When you first log into Visual Notebooks, you're presented with the homepage. At the top of the homepage are usage statistics. Below is the Get Started section, where you can begin building a new analytical project using a blank canvas or using one of more than a dozen prebuilt templates geared to your specific use case or industry. Access additional templates by selecting View all or navigating to the Template page using the left sidebar.
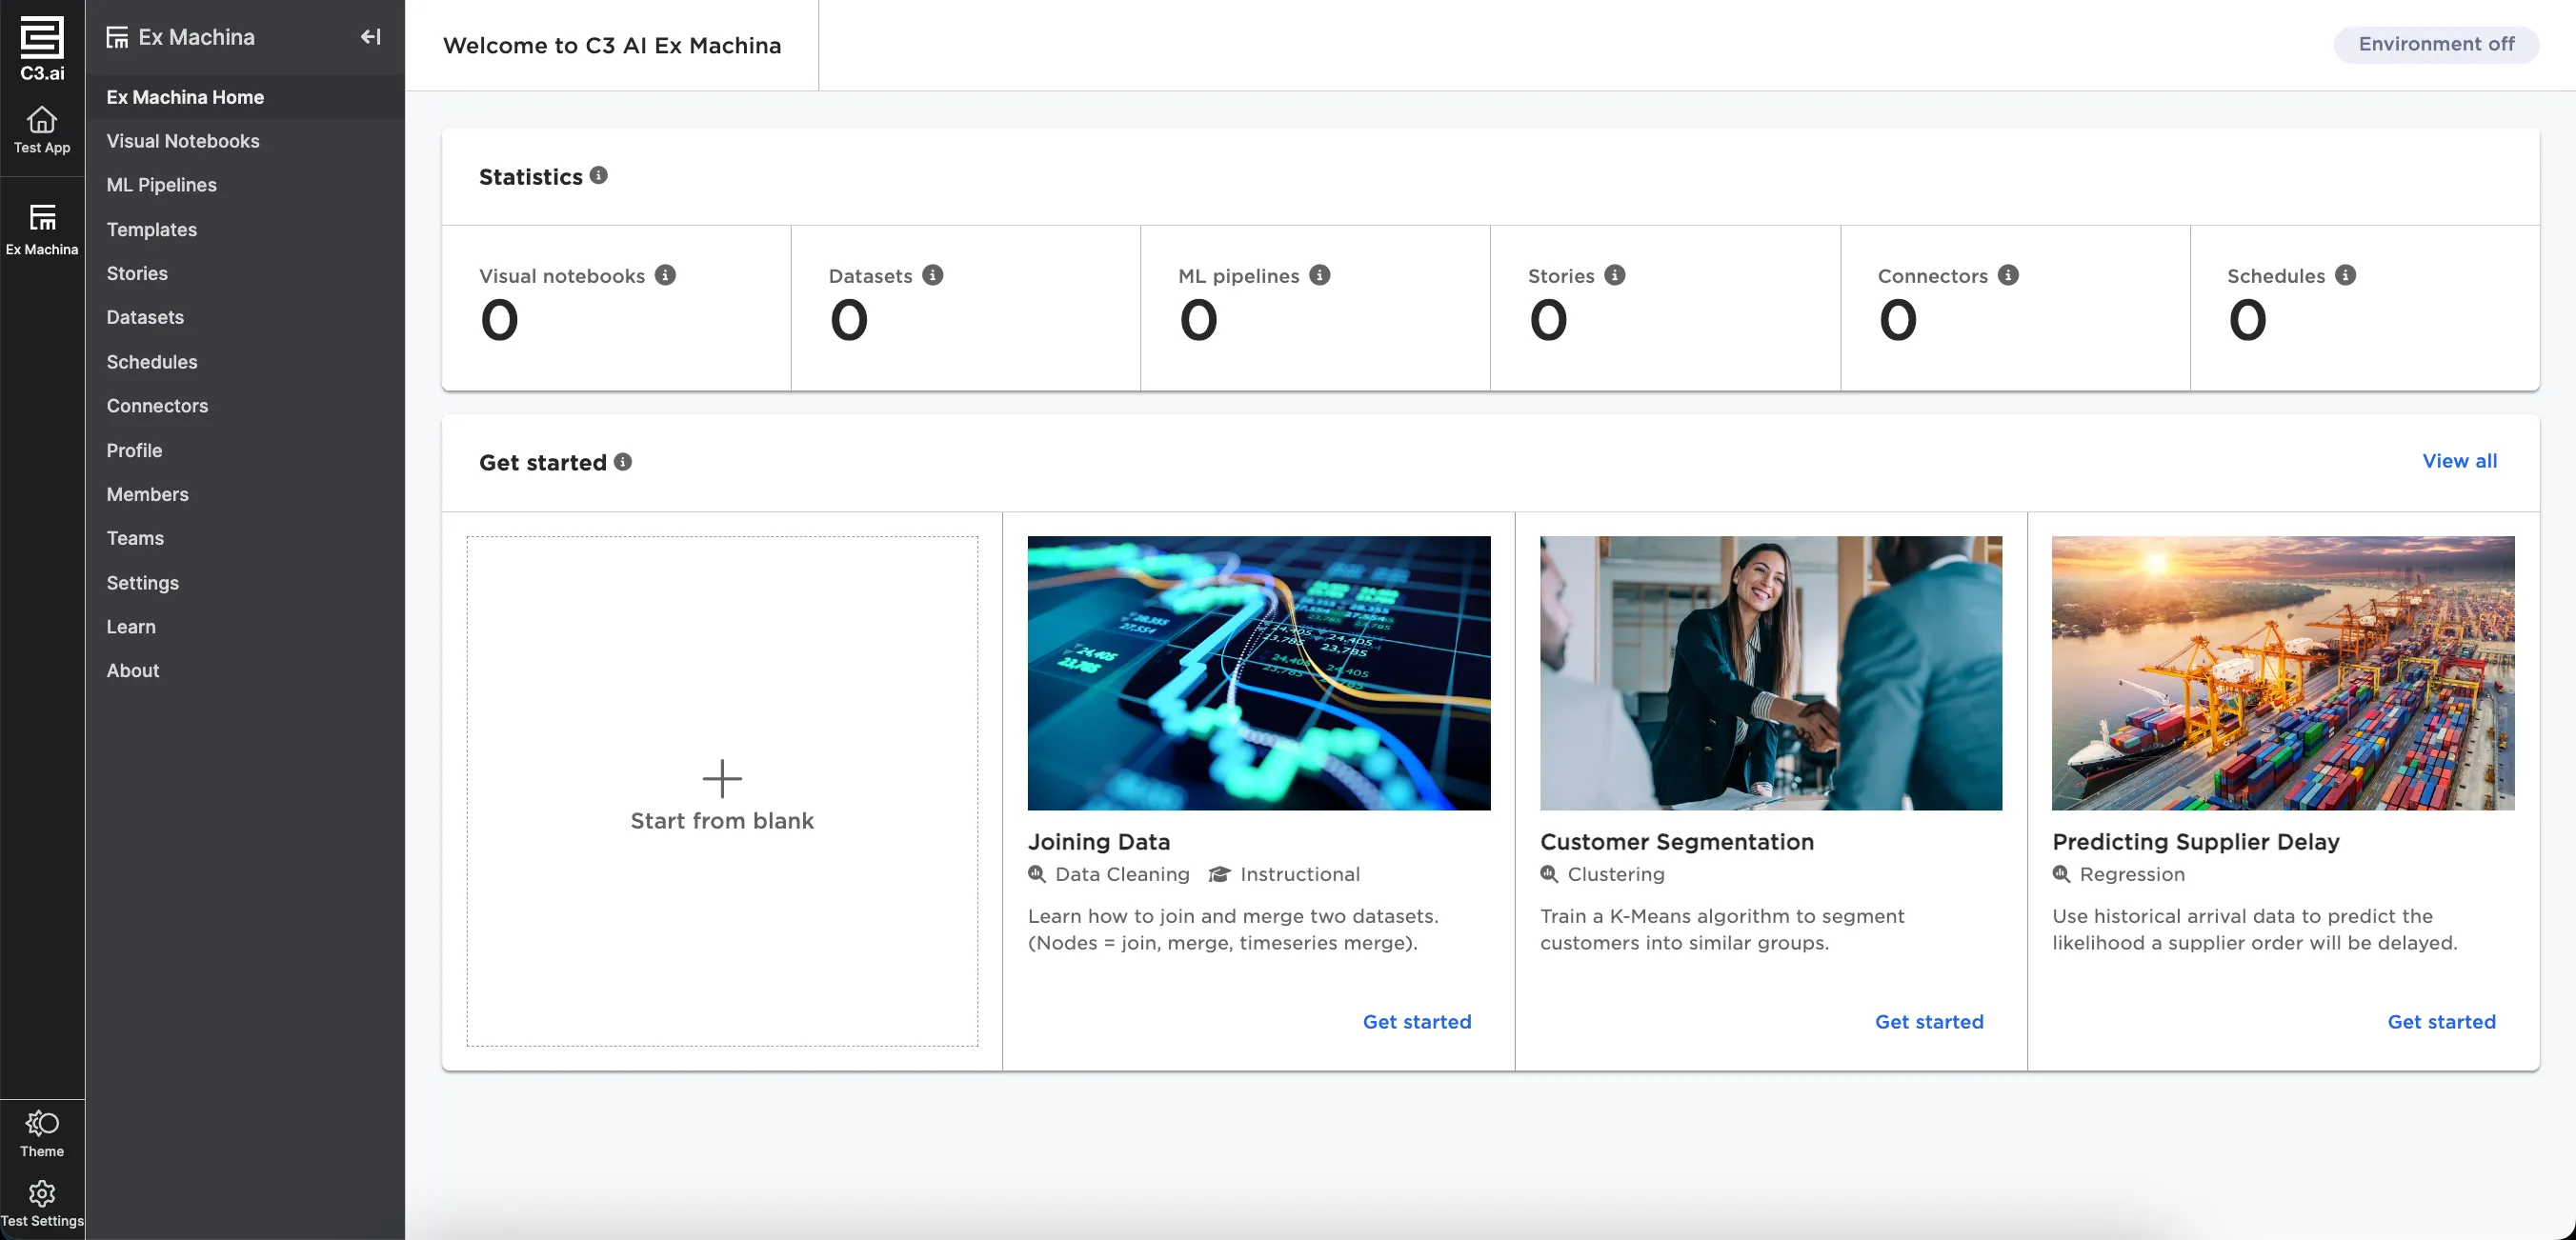
Figure 1: The initial Visual Notebooks Home page
Once you've created your first visual notebook in Visual Notebooks, the homepage looks a bit different. Under the statistics is a quick start section, where you can quickly create a new visual notebook, ML pipeline, story, or schedule. There are also previews of your three most recent stories. Select a story to view or edit it.
Beneath the templates are lists of your recent visual notebooks, ML pipelines, and schedules. Select a saved asset in this section to open it and continue working where you left off. Select the Create new button at the top of each list to create a new notebook, pipeline, or schedule.
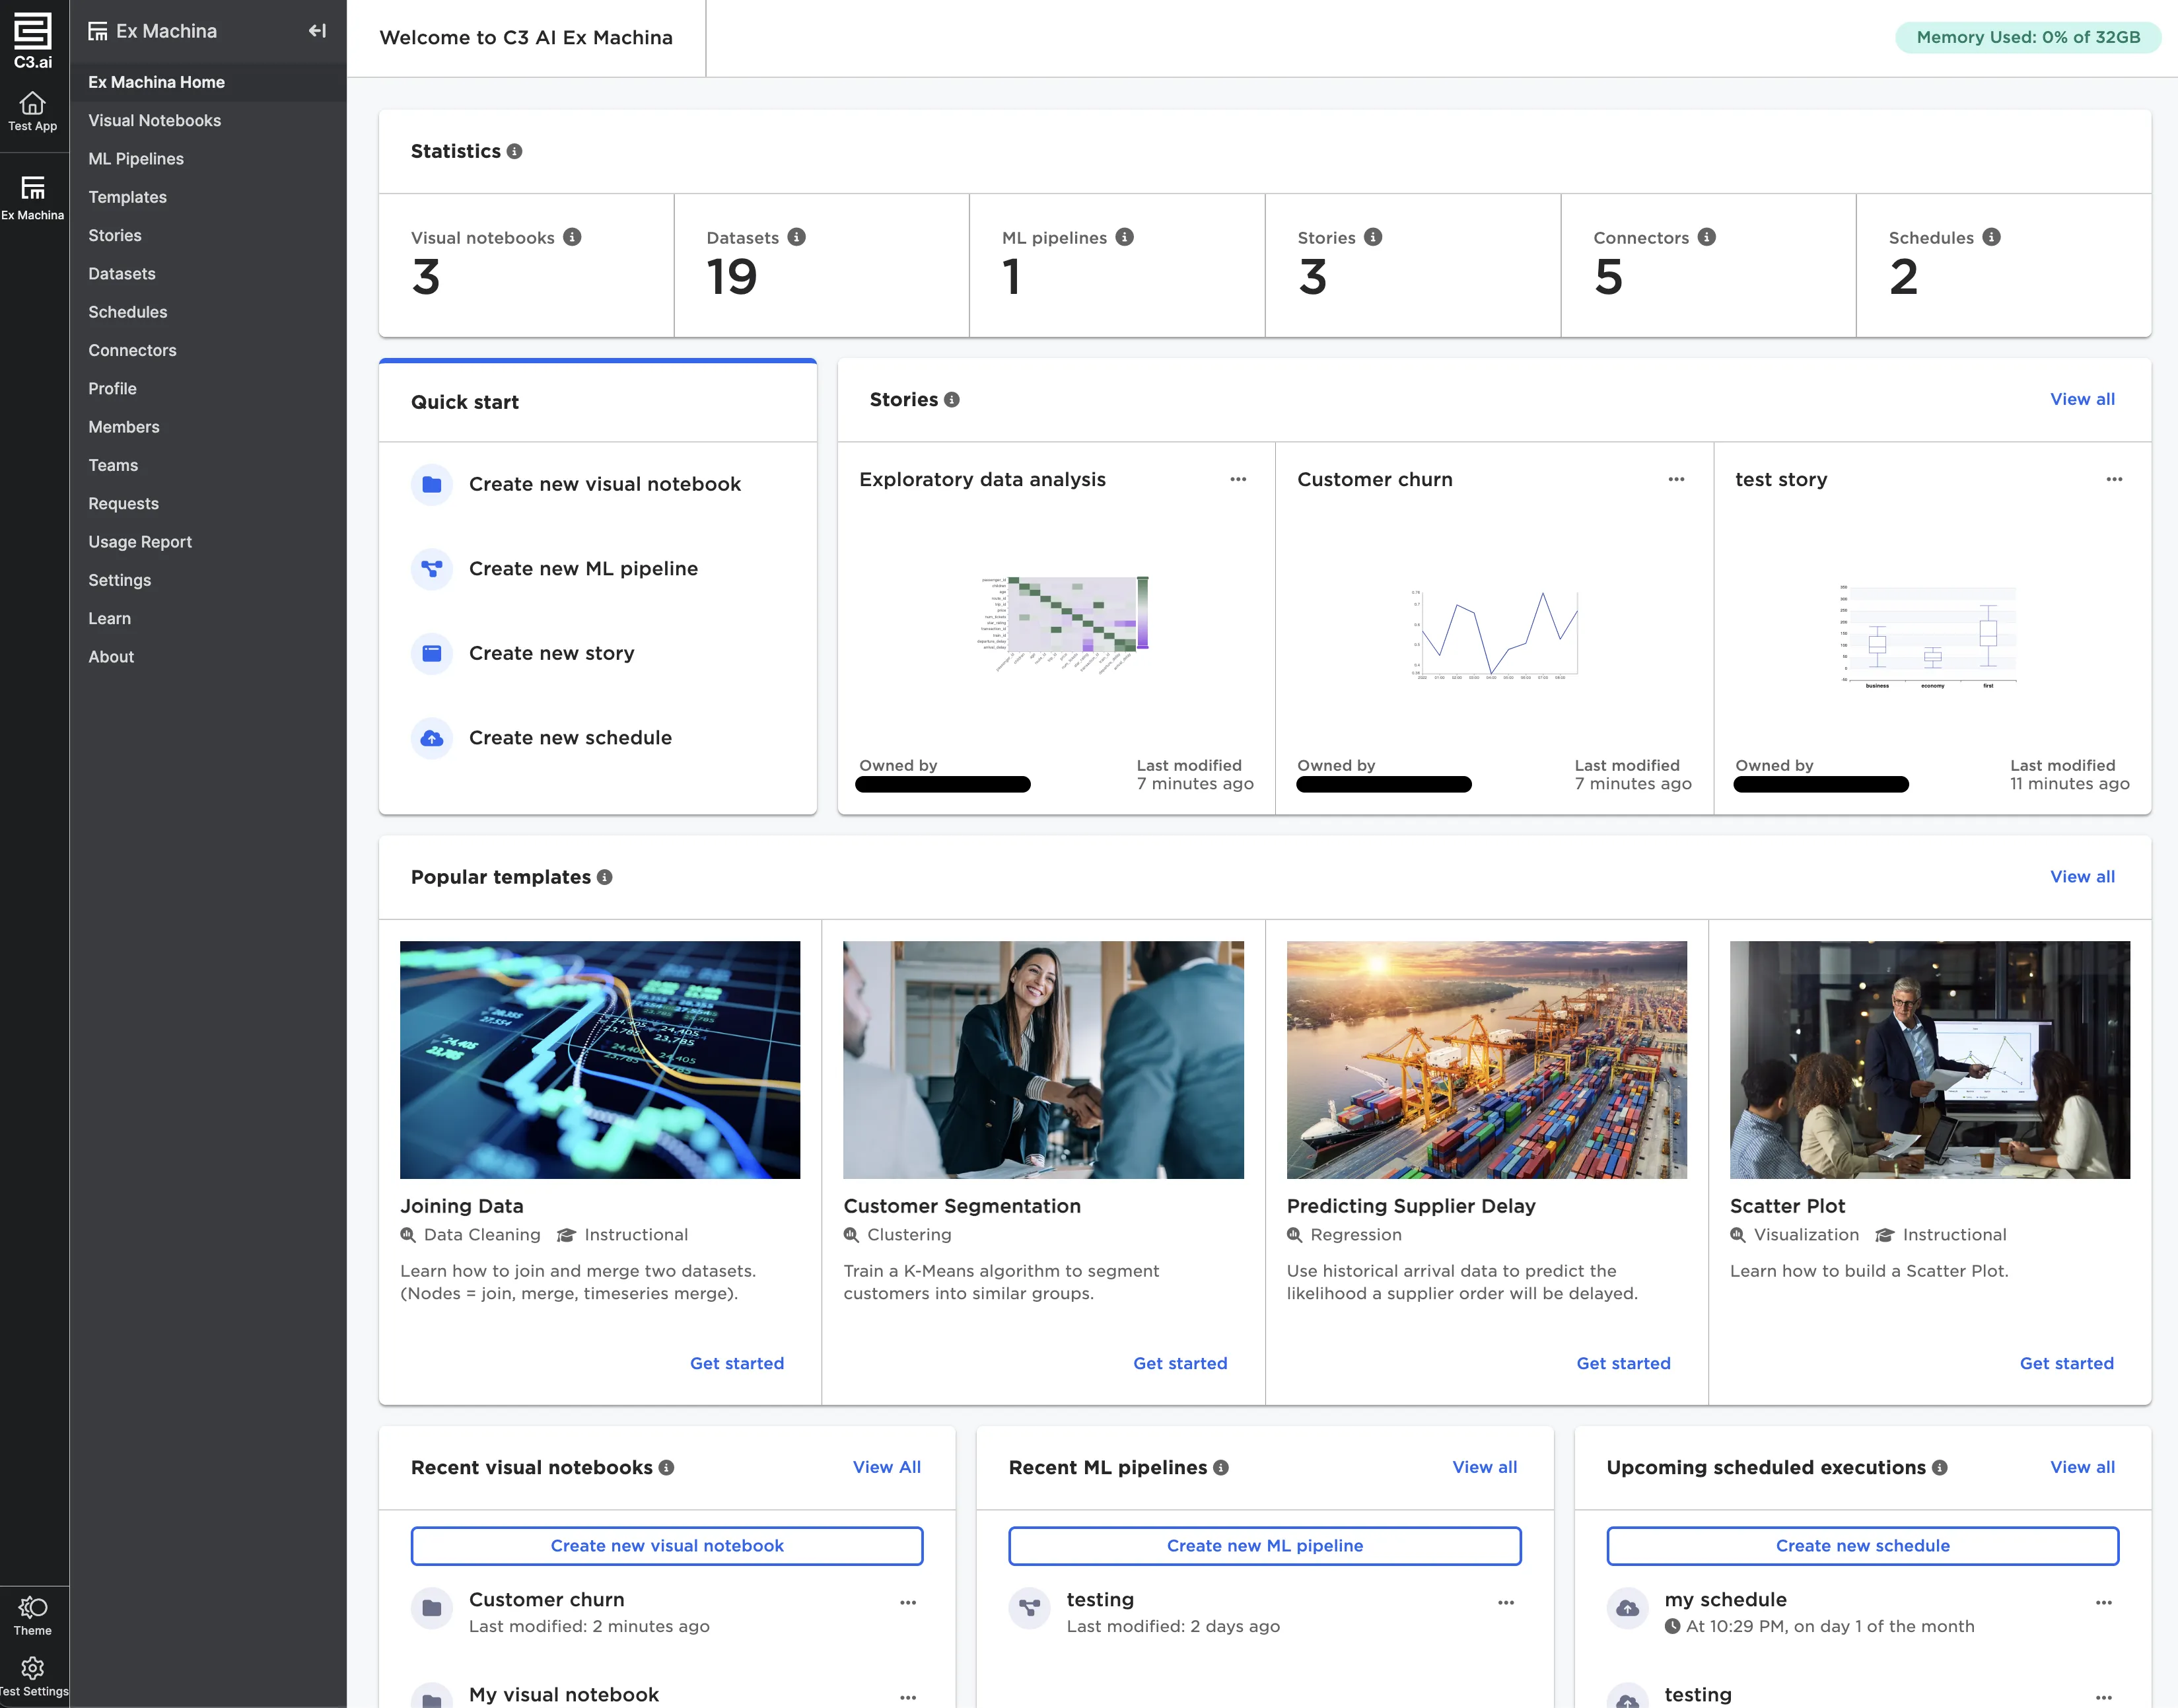
Figure 2: The Visual Notebooks Home page
Visual Notebooks
This page shows all visual notebooks that you've created. Create a new visual notebook or open an existing one. For more information on visual notebooks, see the Visual Notebooks section.
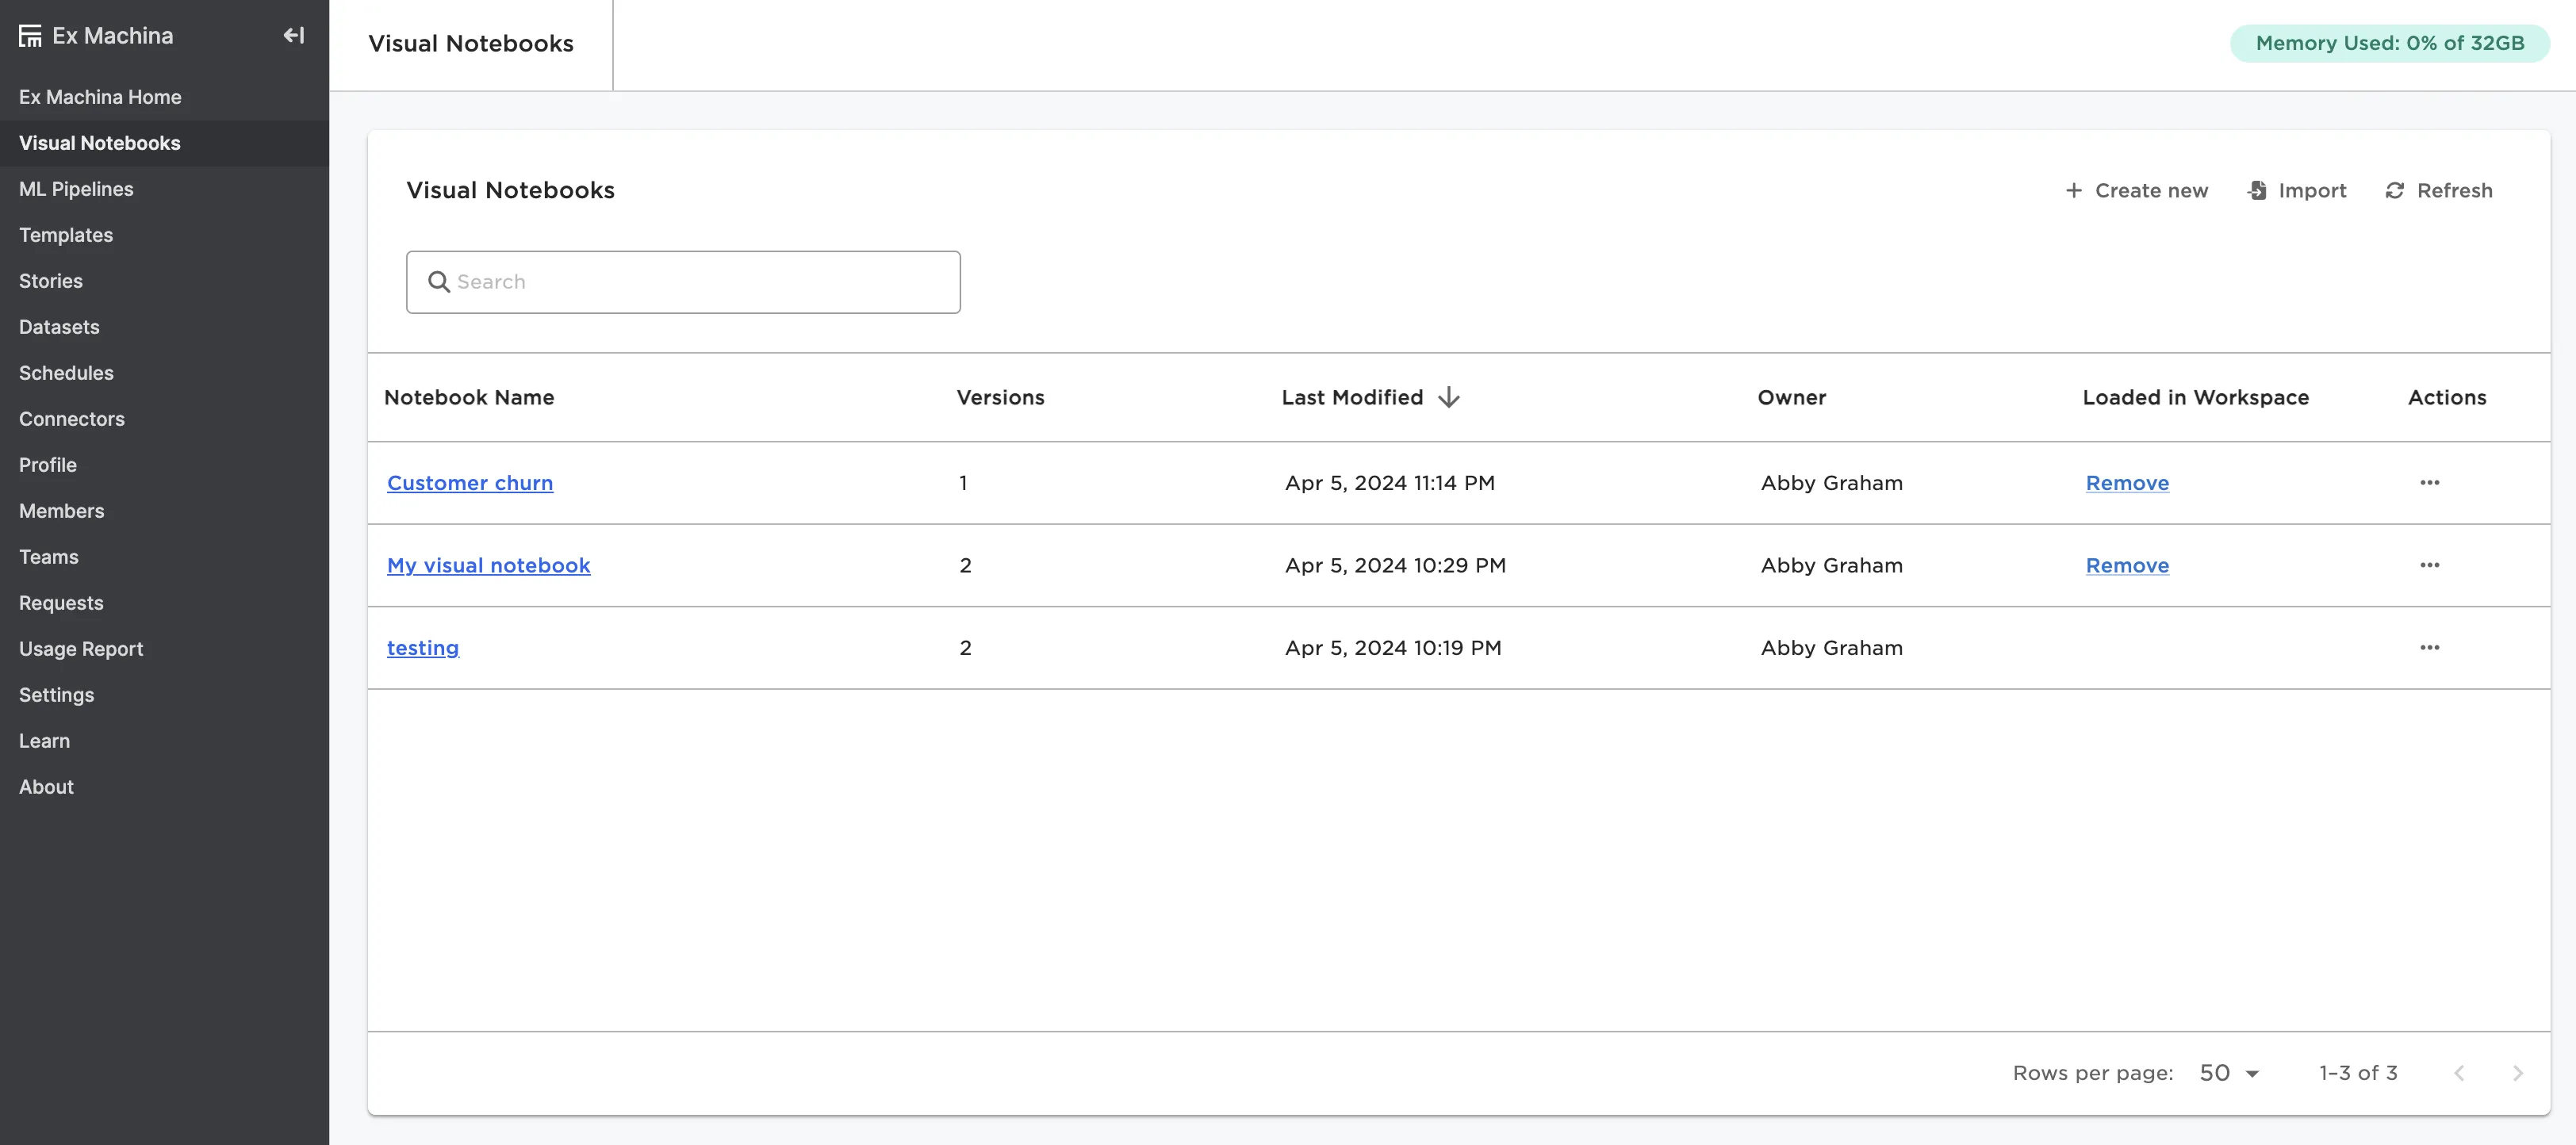
Figure 3: The Visual Notebooks page
ML Pipelines
This page shows all ML pipelines that you've created. Create a new ML pipeline or open an existing pipeline. For more information on ML pipelines, see the ML Pipelines section.
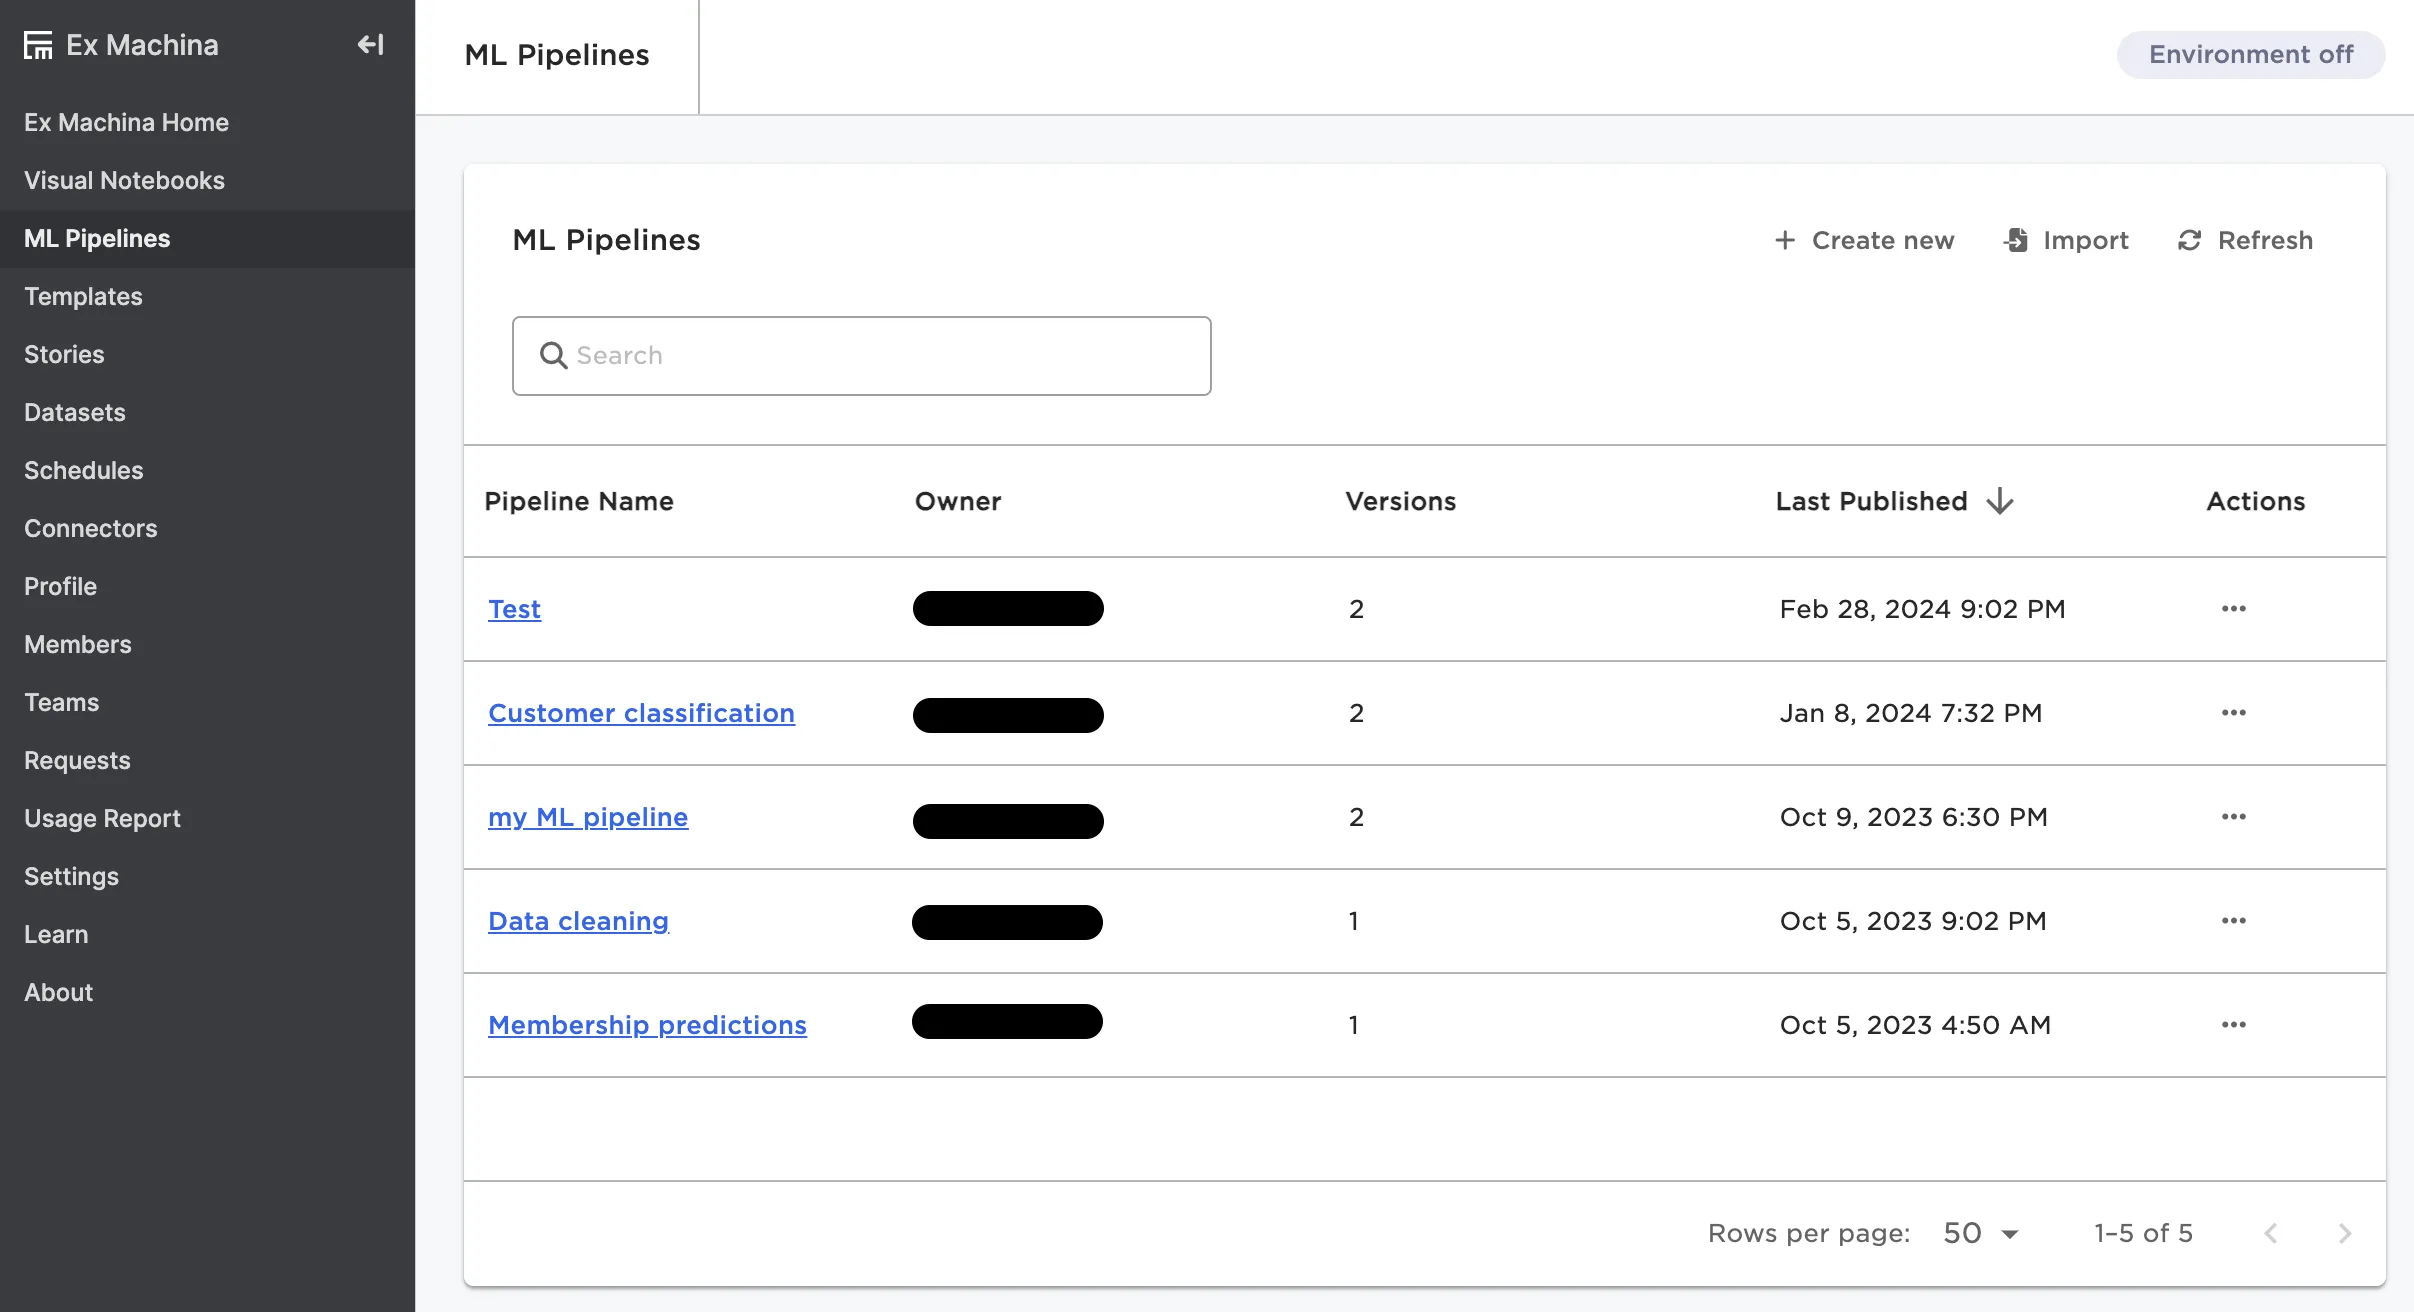
Figure 4: The ML Pipelines page
Templates
This page shows all available templates in your instance of Visual Notebooks. Templates are customizable, pre-configured visual notebooks meant to serve as a starting point when solving a specific use case.
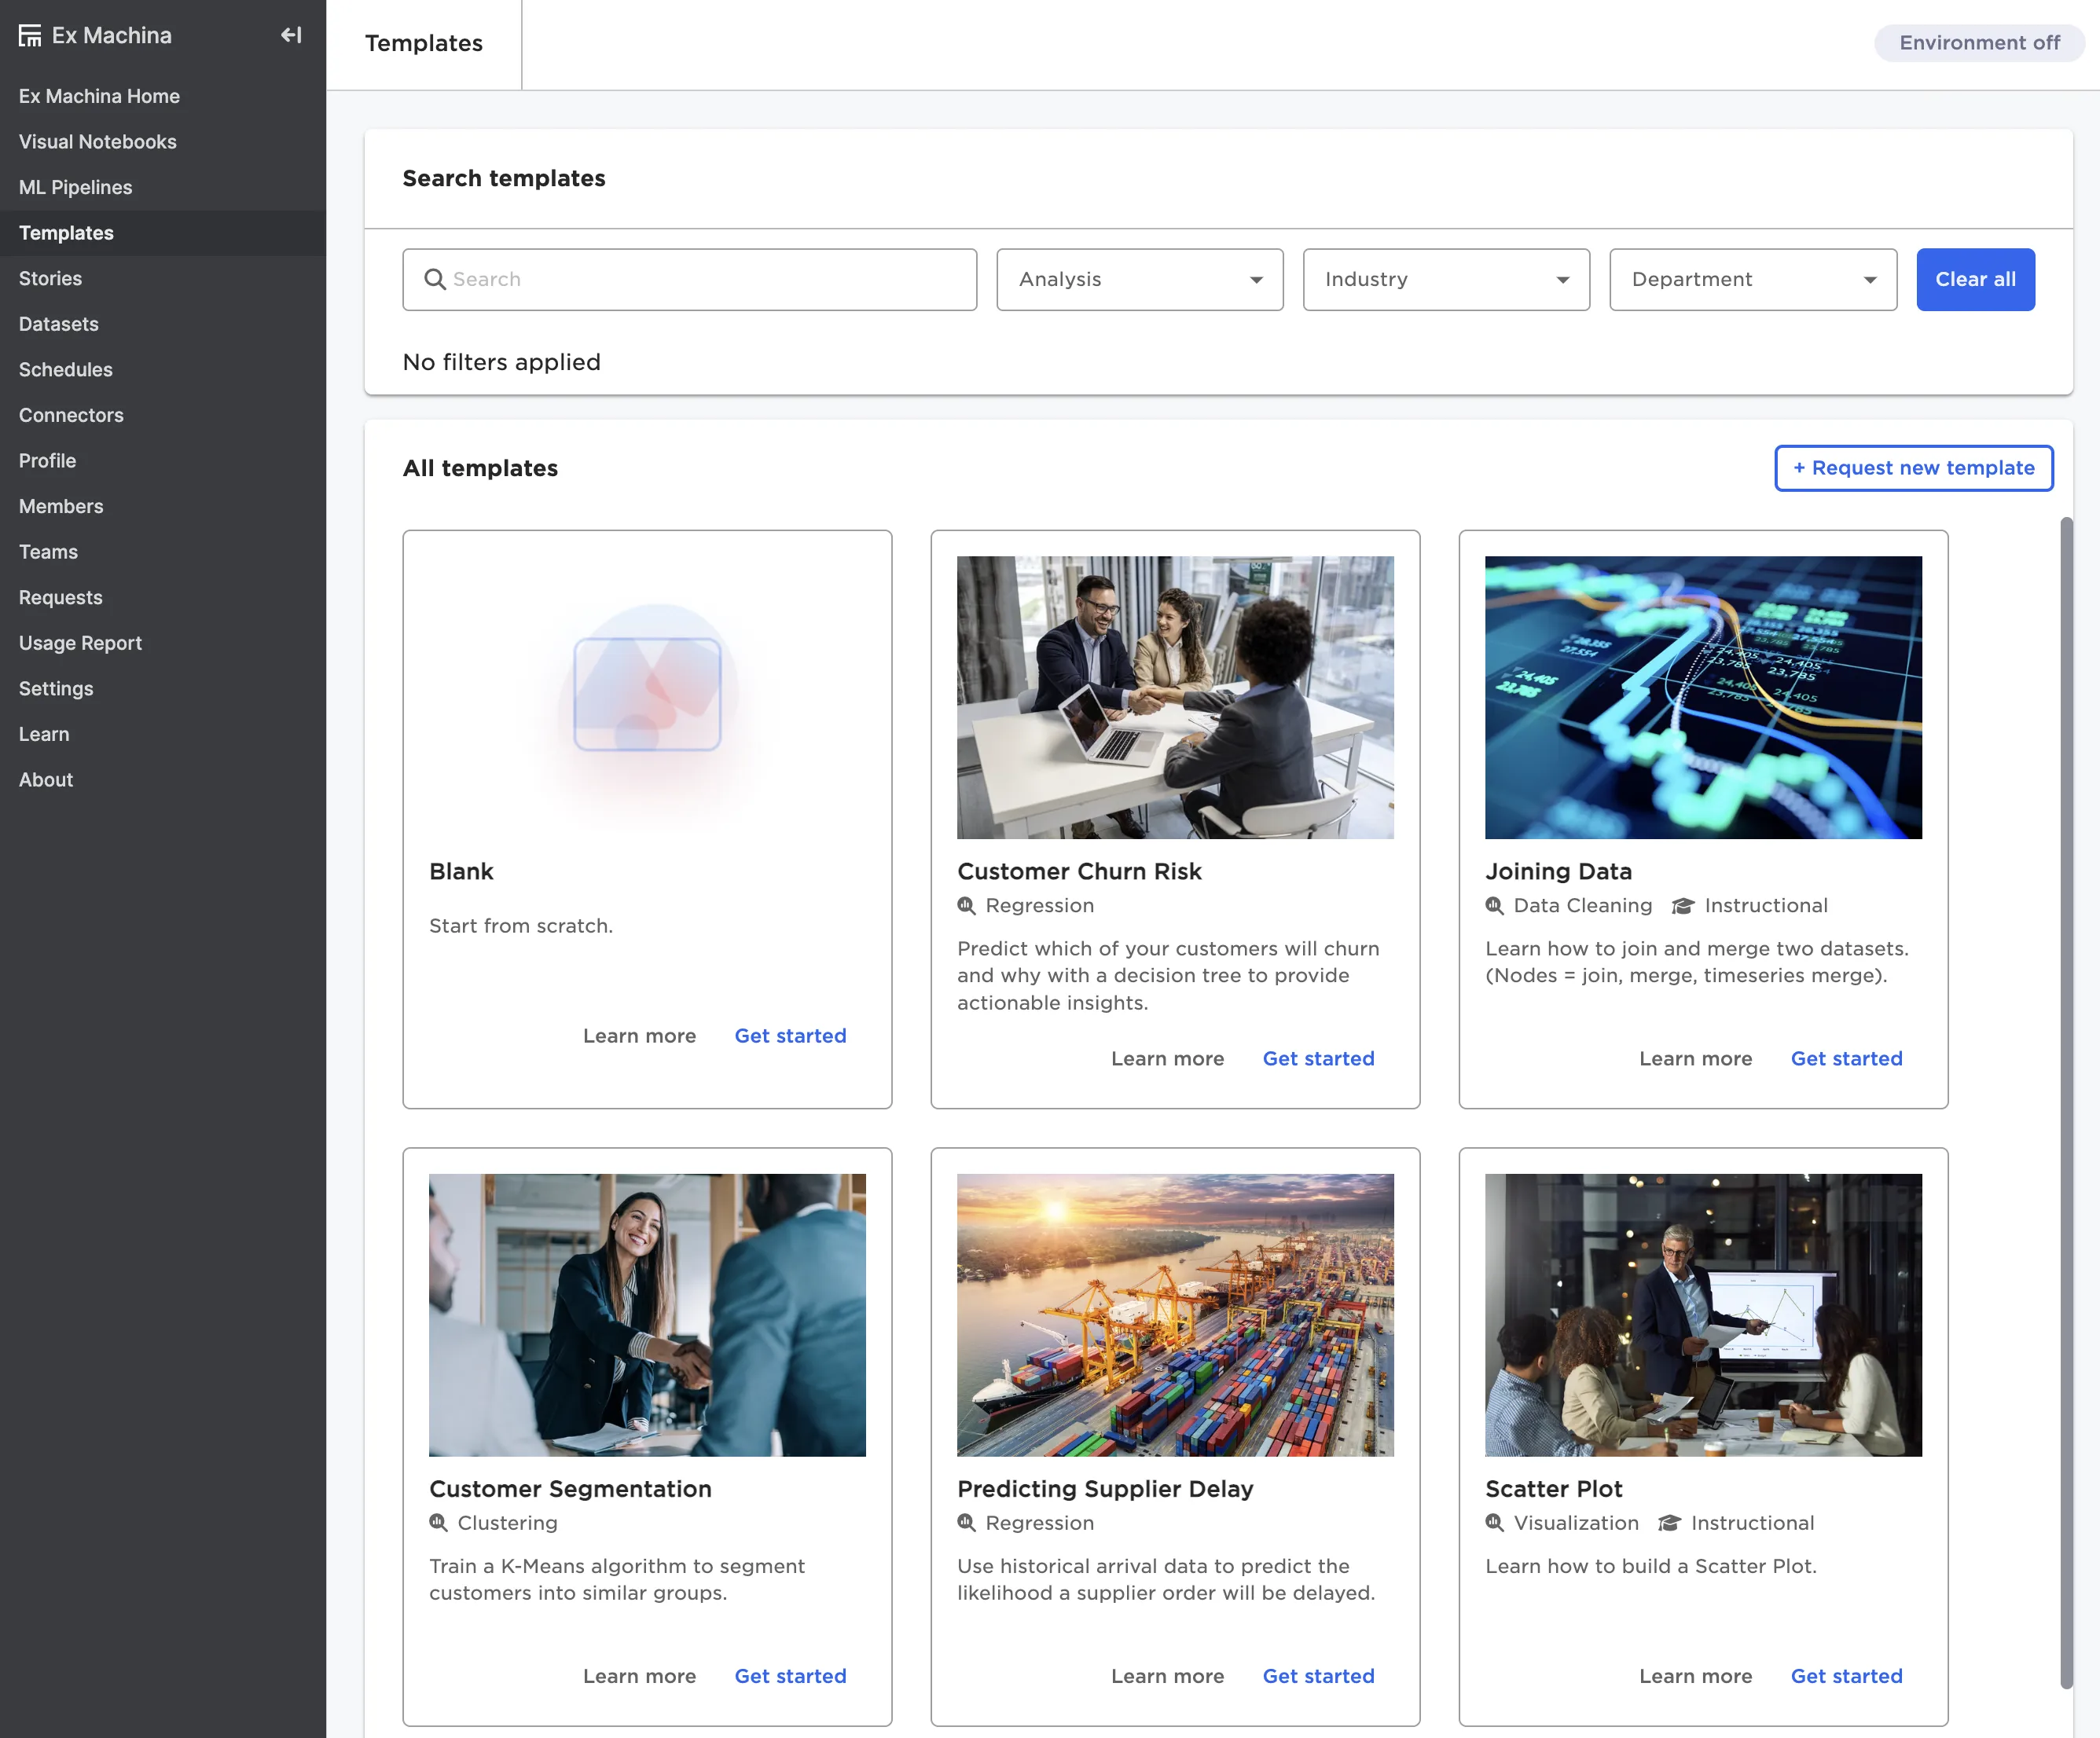
Figure 5: The Templates page
Stories
This page shows all stories that you have created or have access to. Create a new story or view an existing story. For more information on stories, see the Stories section.
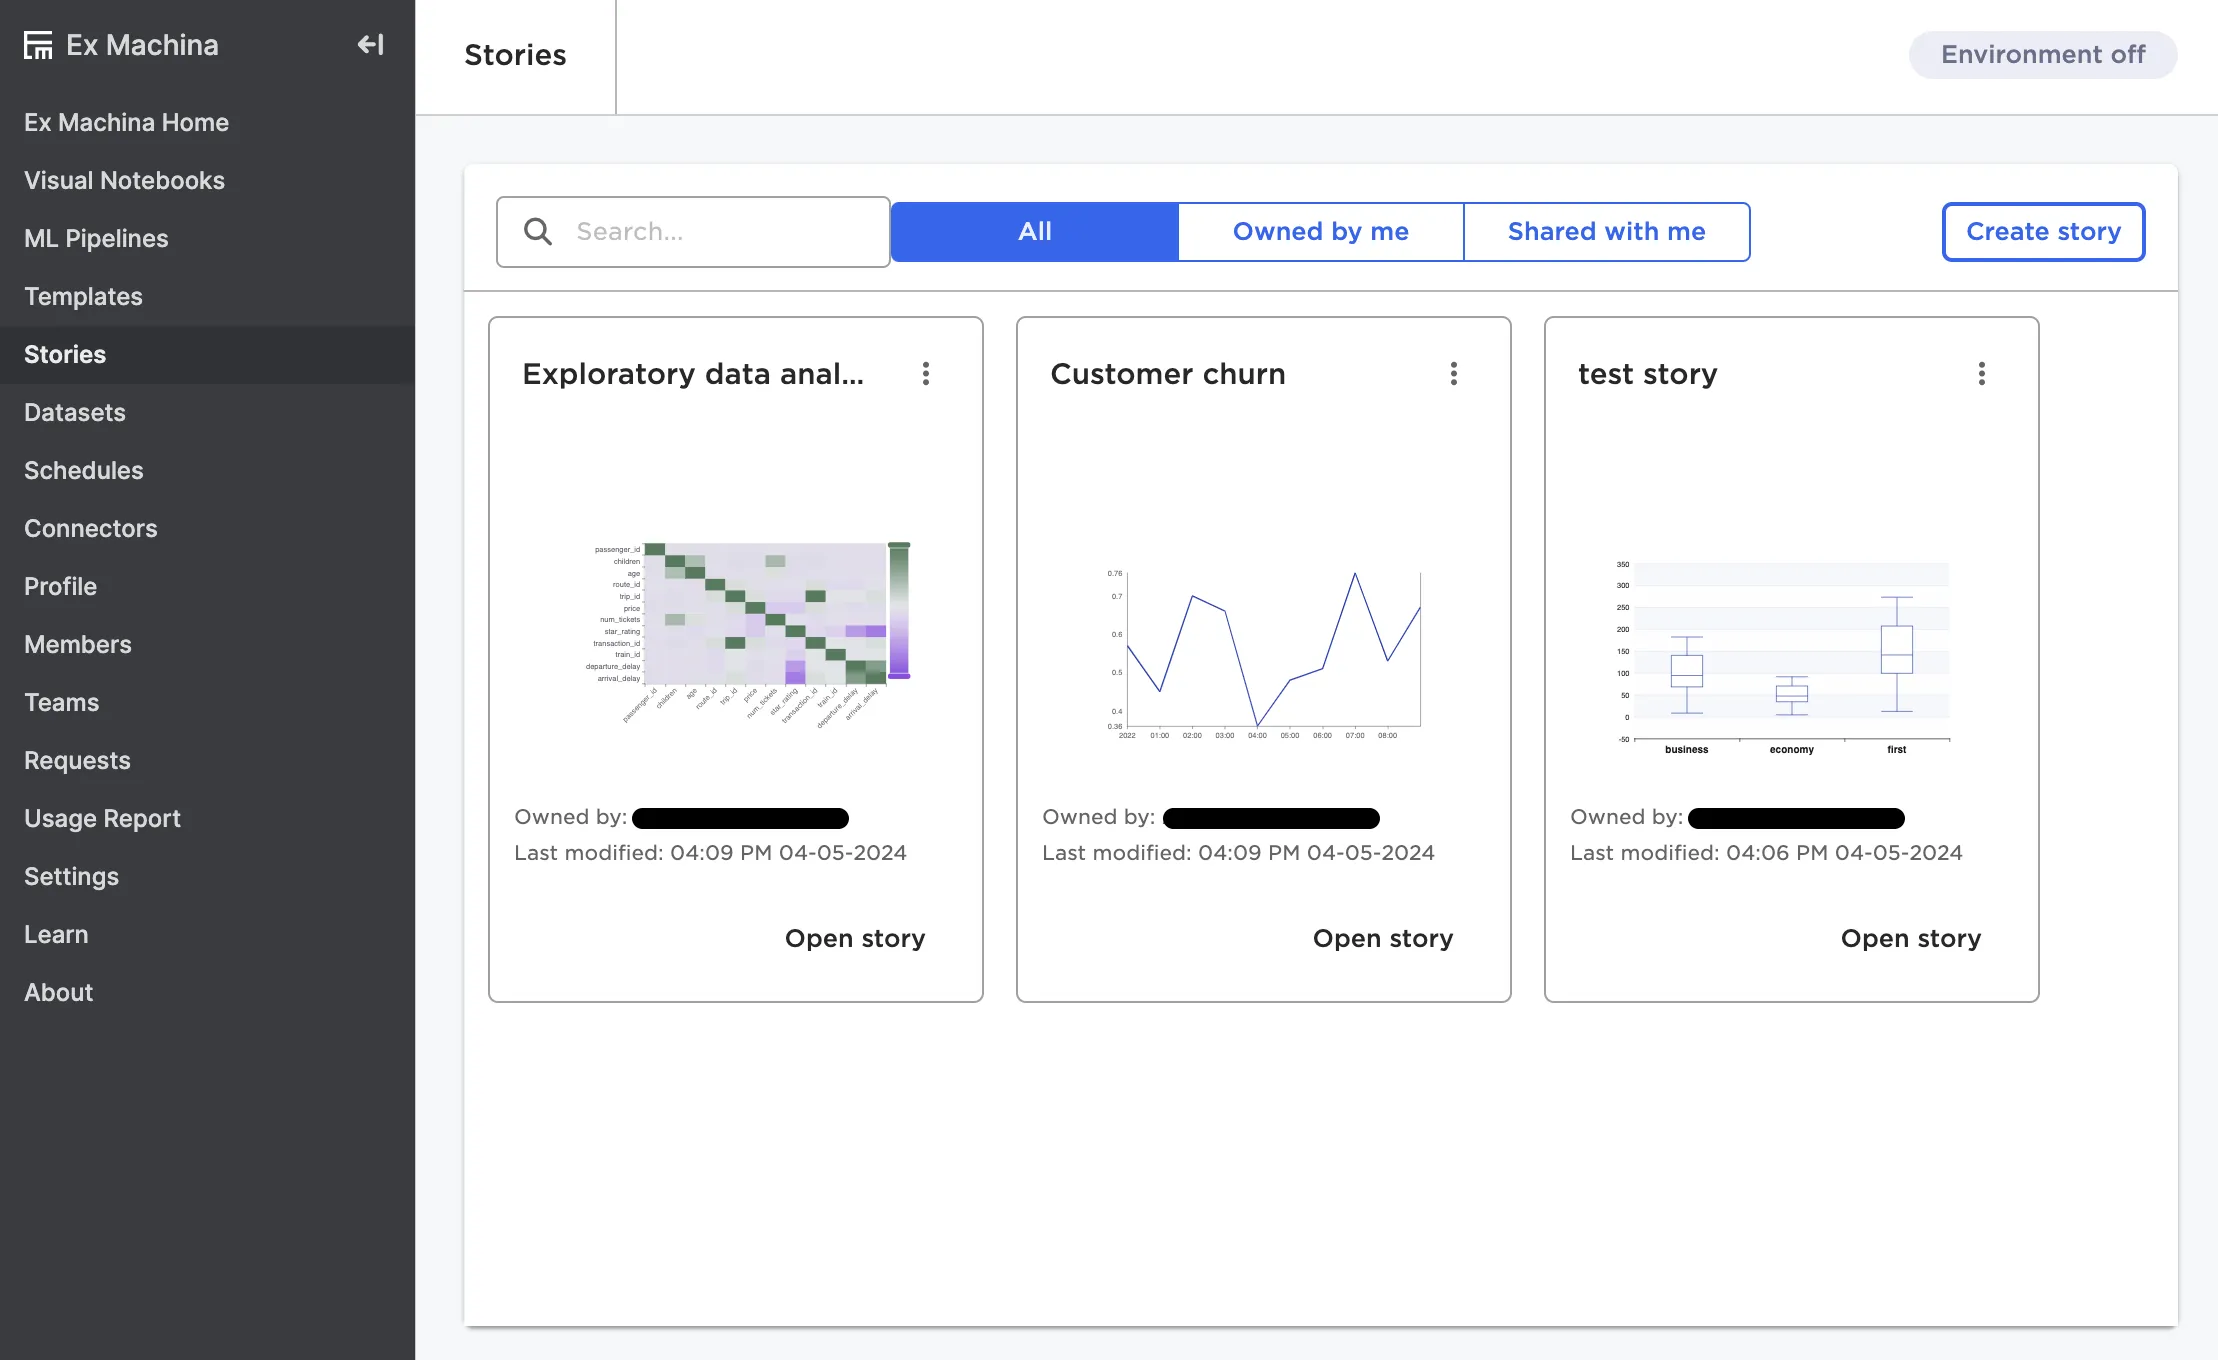
Figure 6: The Stories page
Datasets
This page shows a list of all datasets you have access to. For more information on datasets, see the Datasets section.
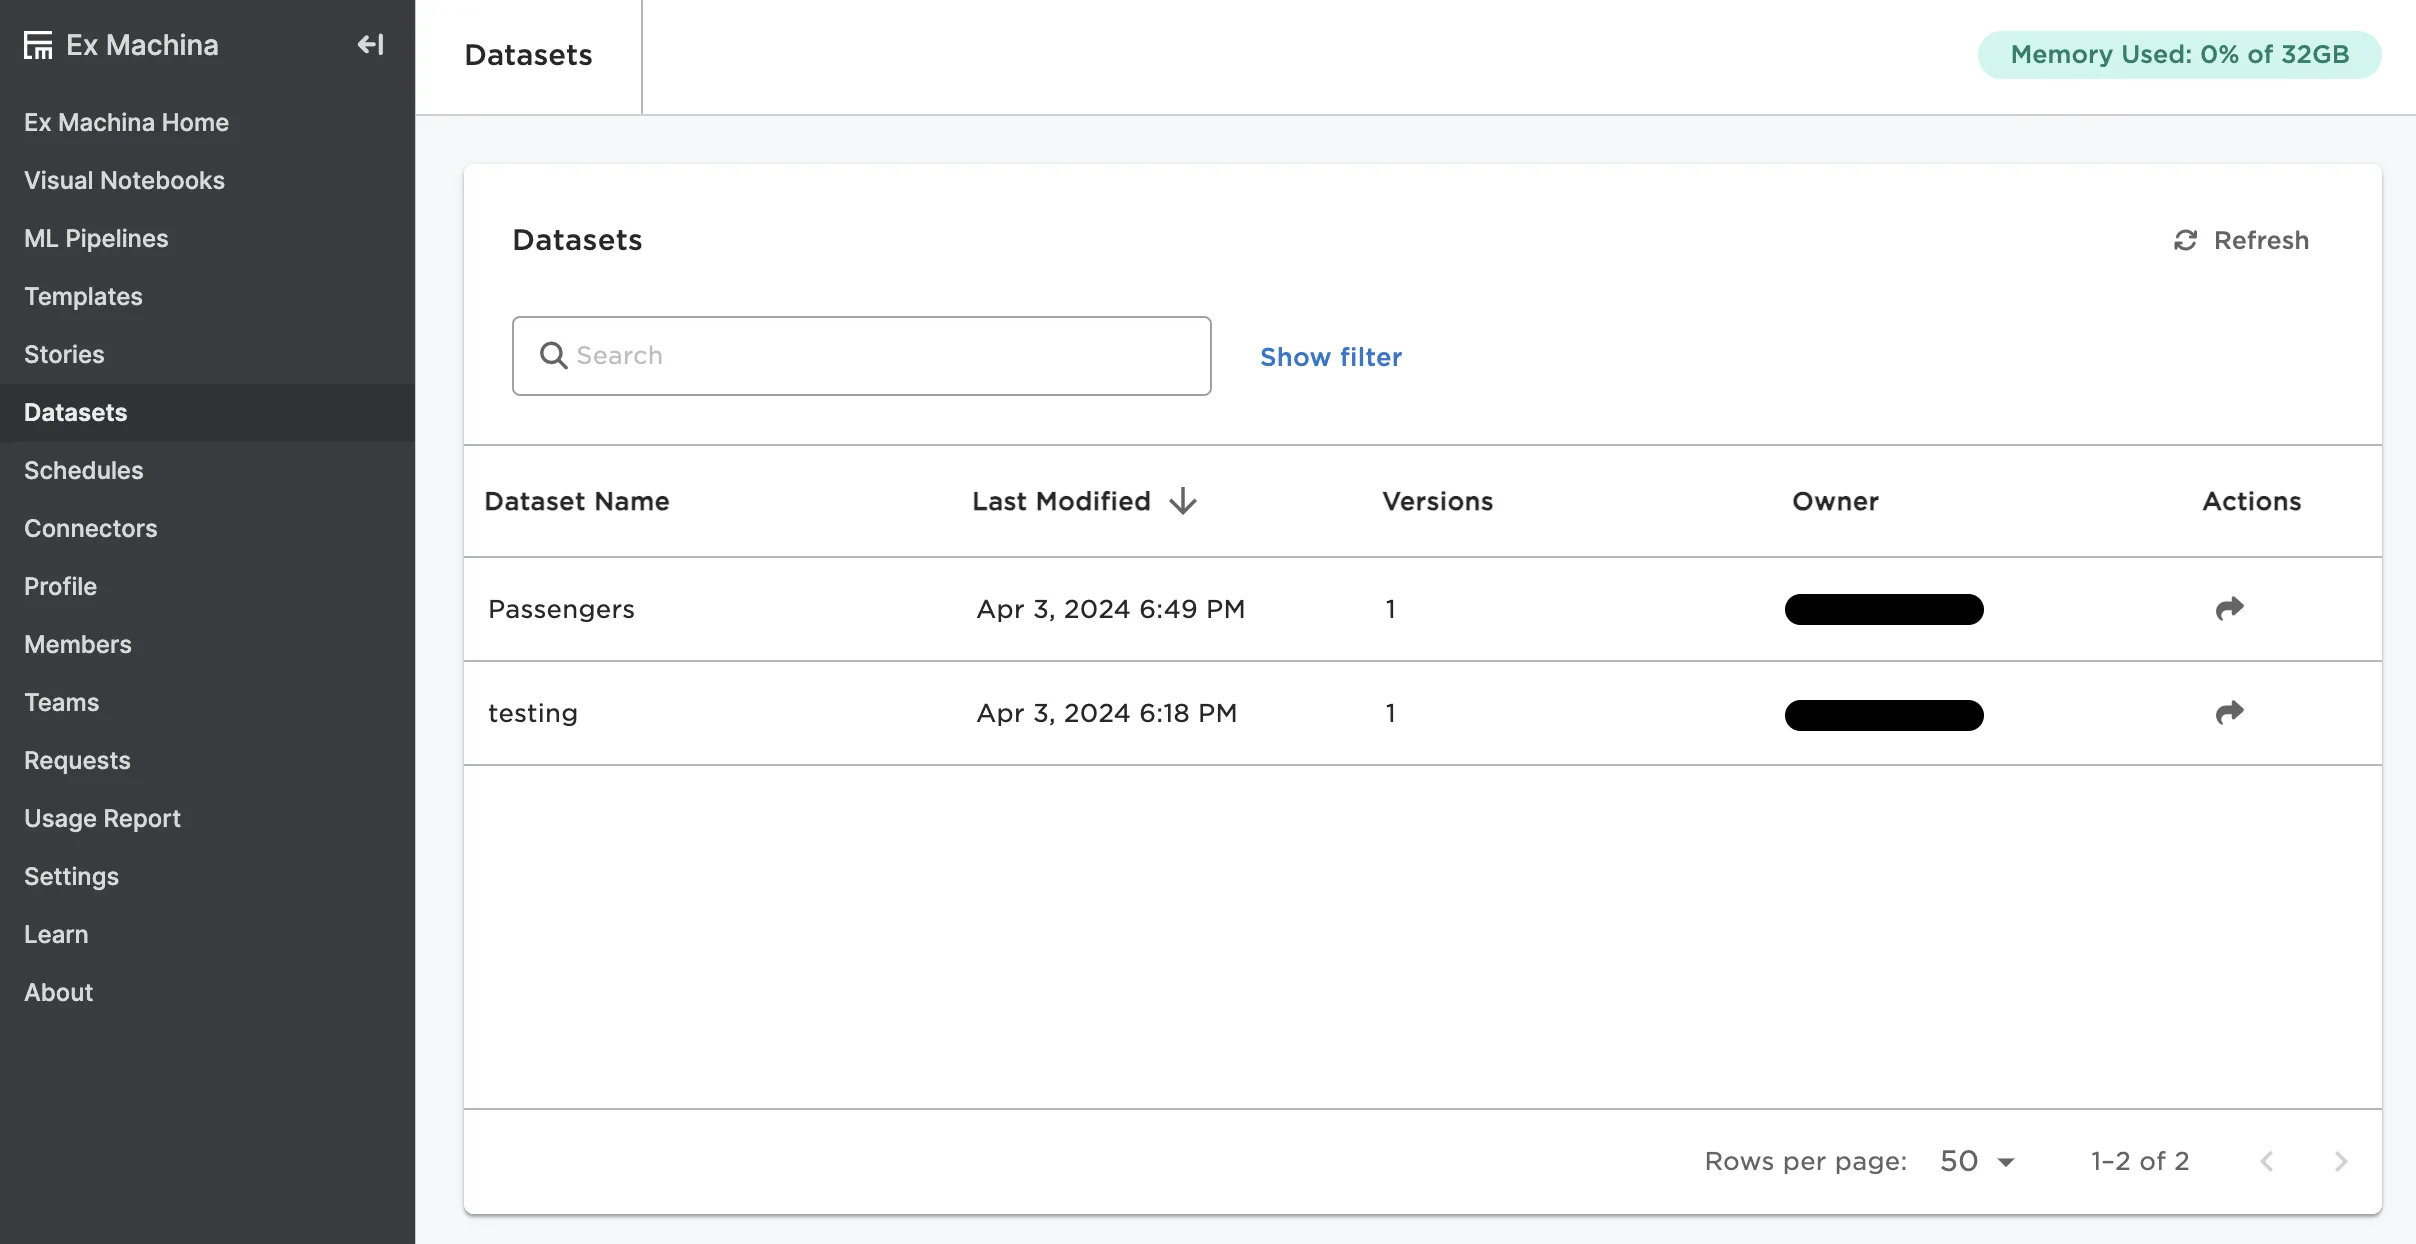
Figure 7: The Datasets page
Schedules
This page shows a list of all schedules you've created. Create a new schedule or view historical executions of existing schedules. For more information on schedules, see the Schedules section.
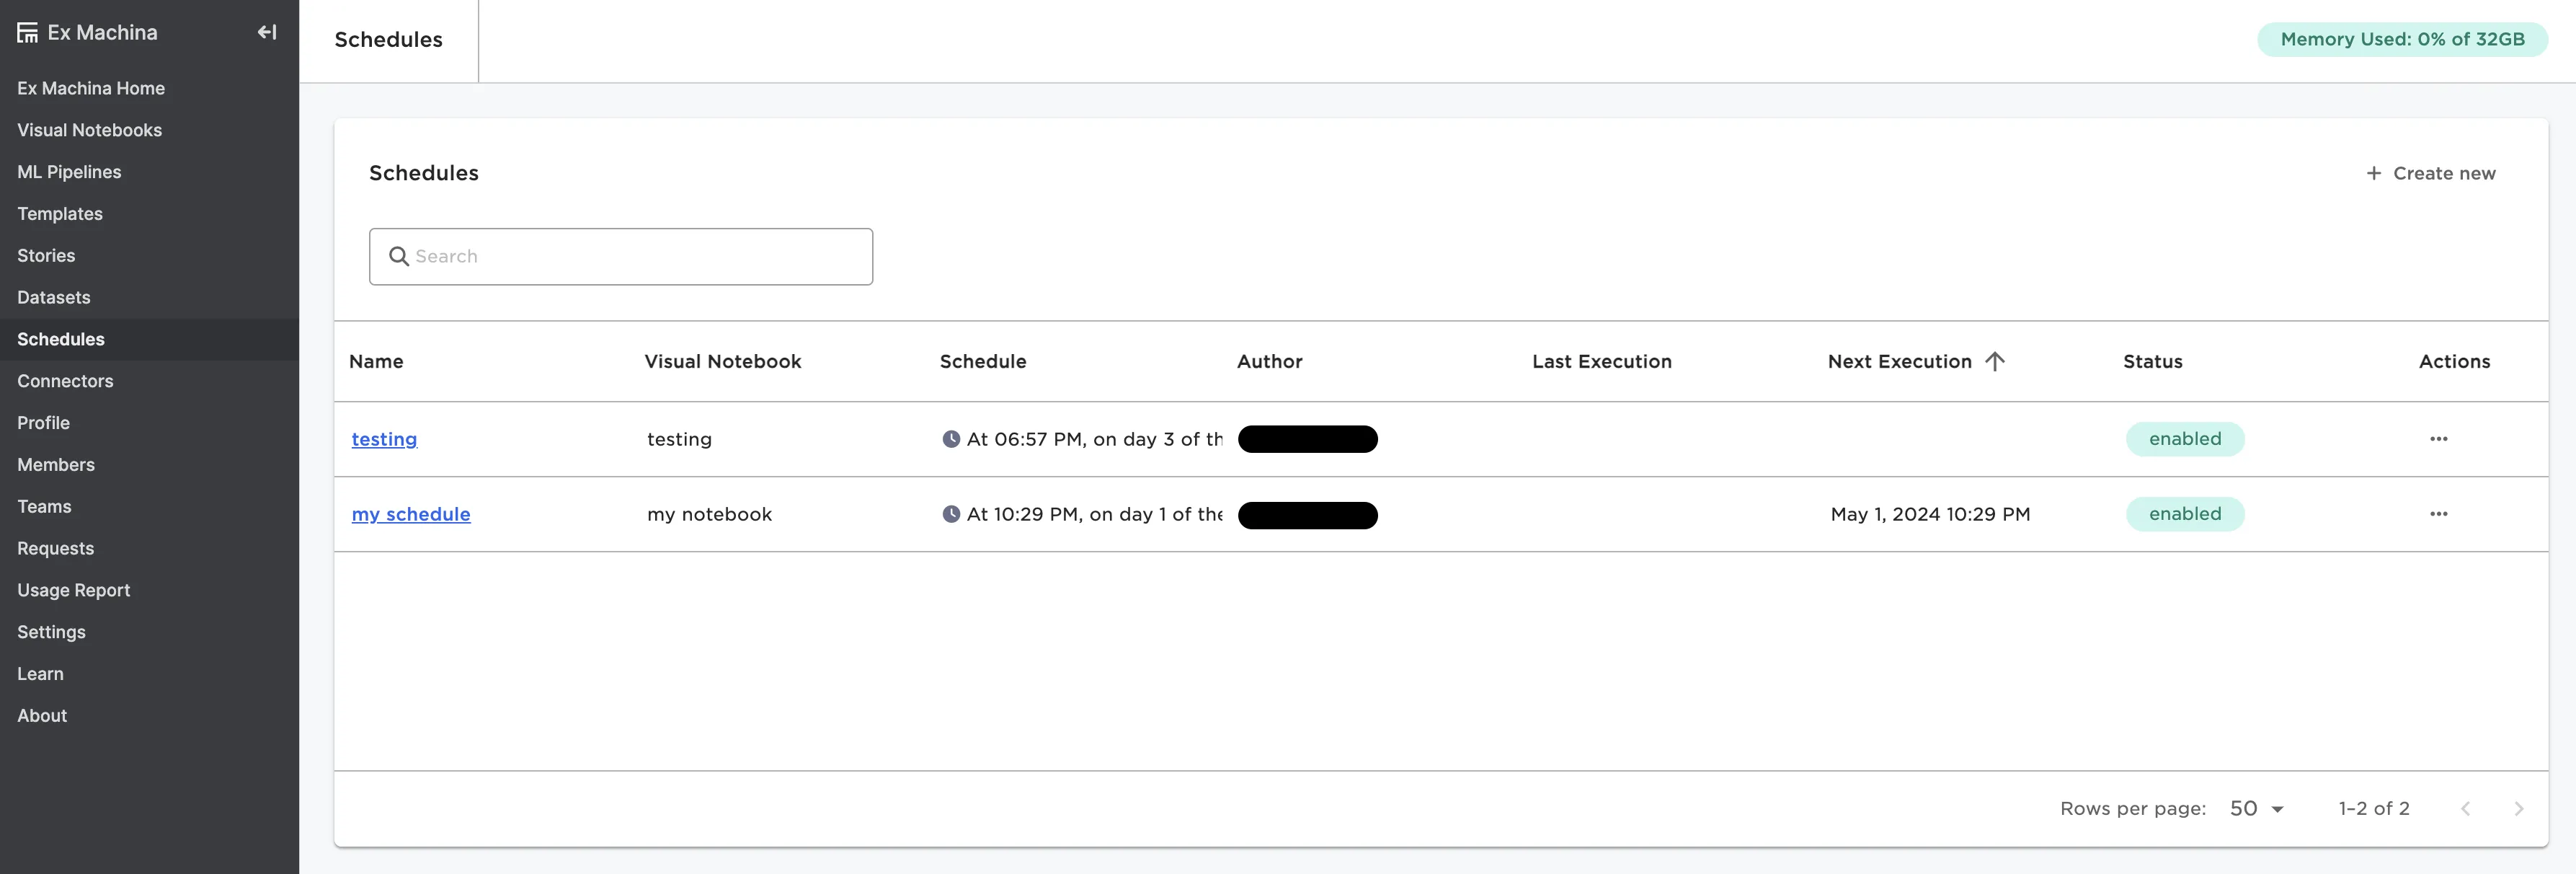
Figure 8: The Schedules page
Connectors
This page shows a list of all connectors configured in Visual Notebooks that you have access to. Select the arrow icon under the Actions column to share a specific connector with a team of users. For more information on connectors, see the sections on Input Connectors and Output Connectors.
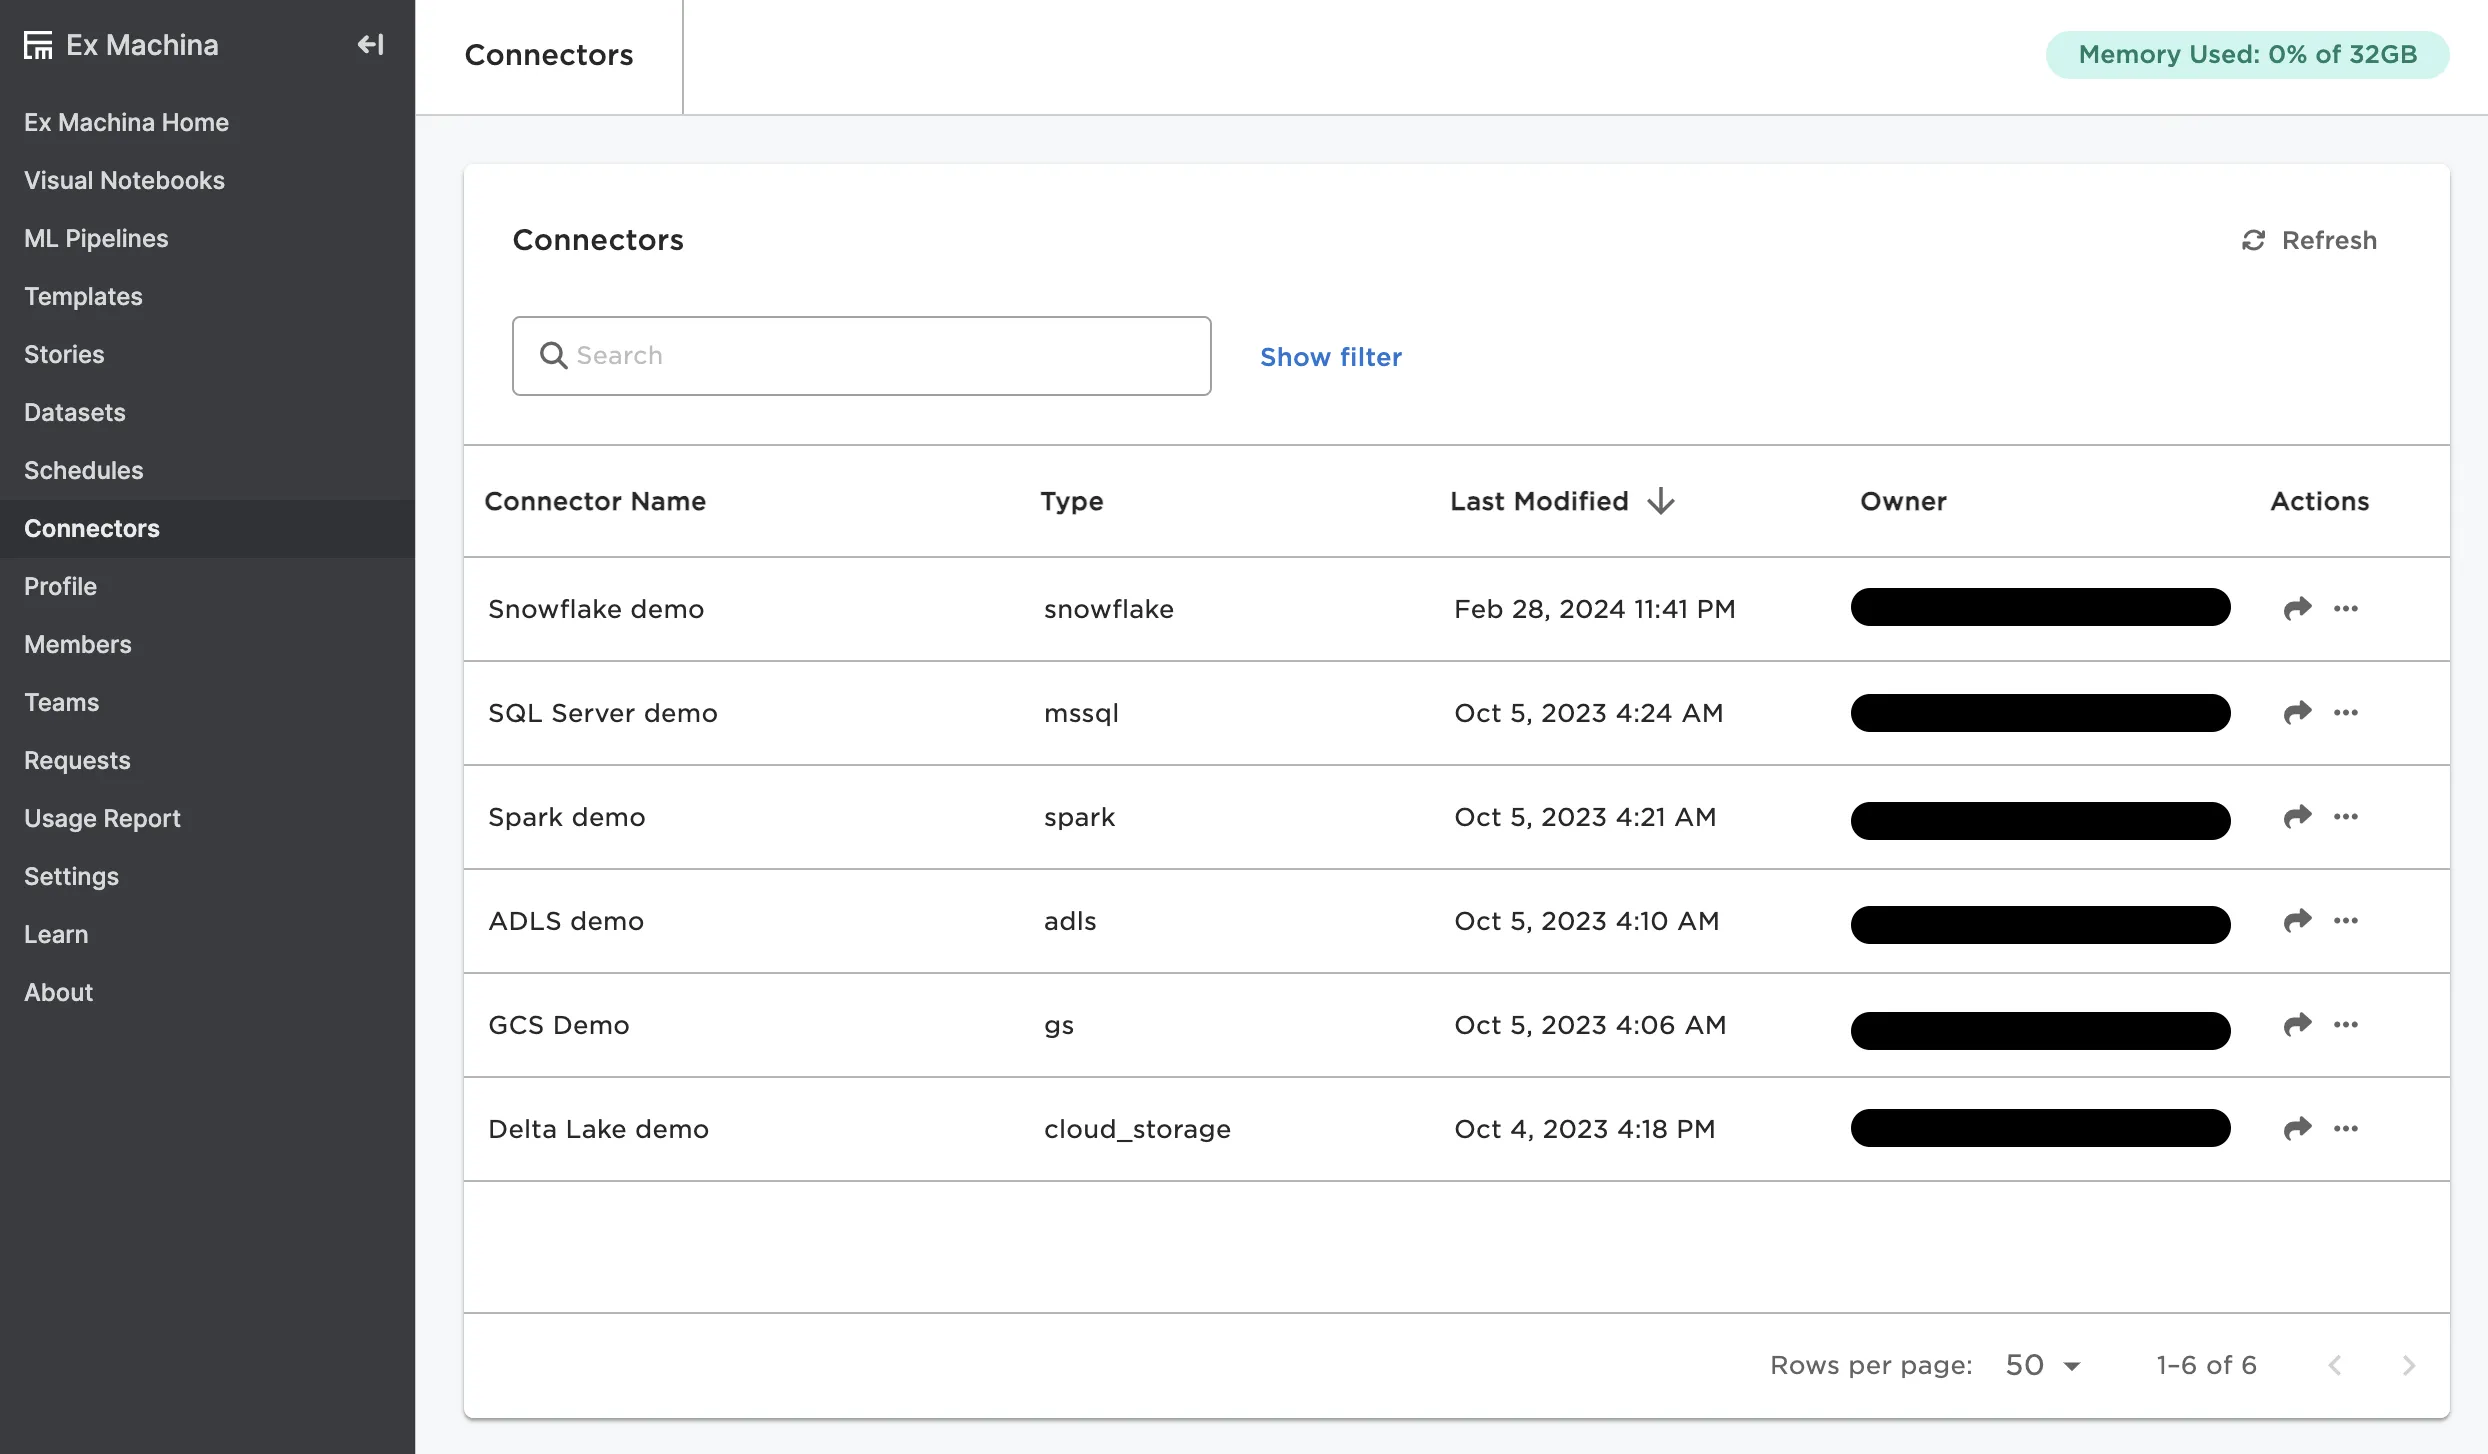
Figure 9: The Connectors page
Profile
This page displays account information including your name, email, role, and subscription status.
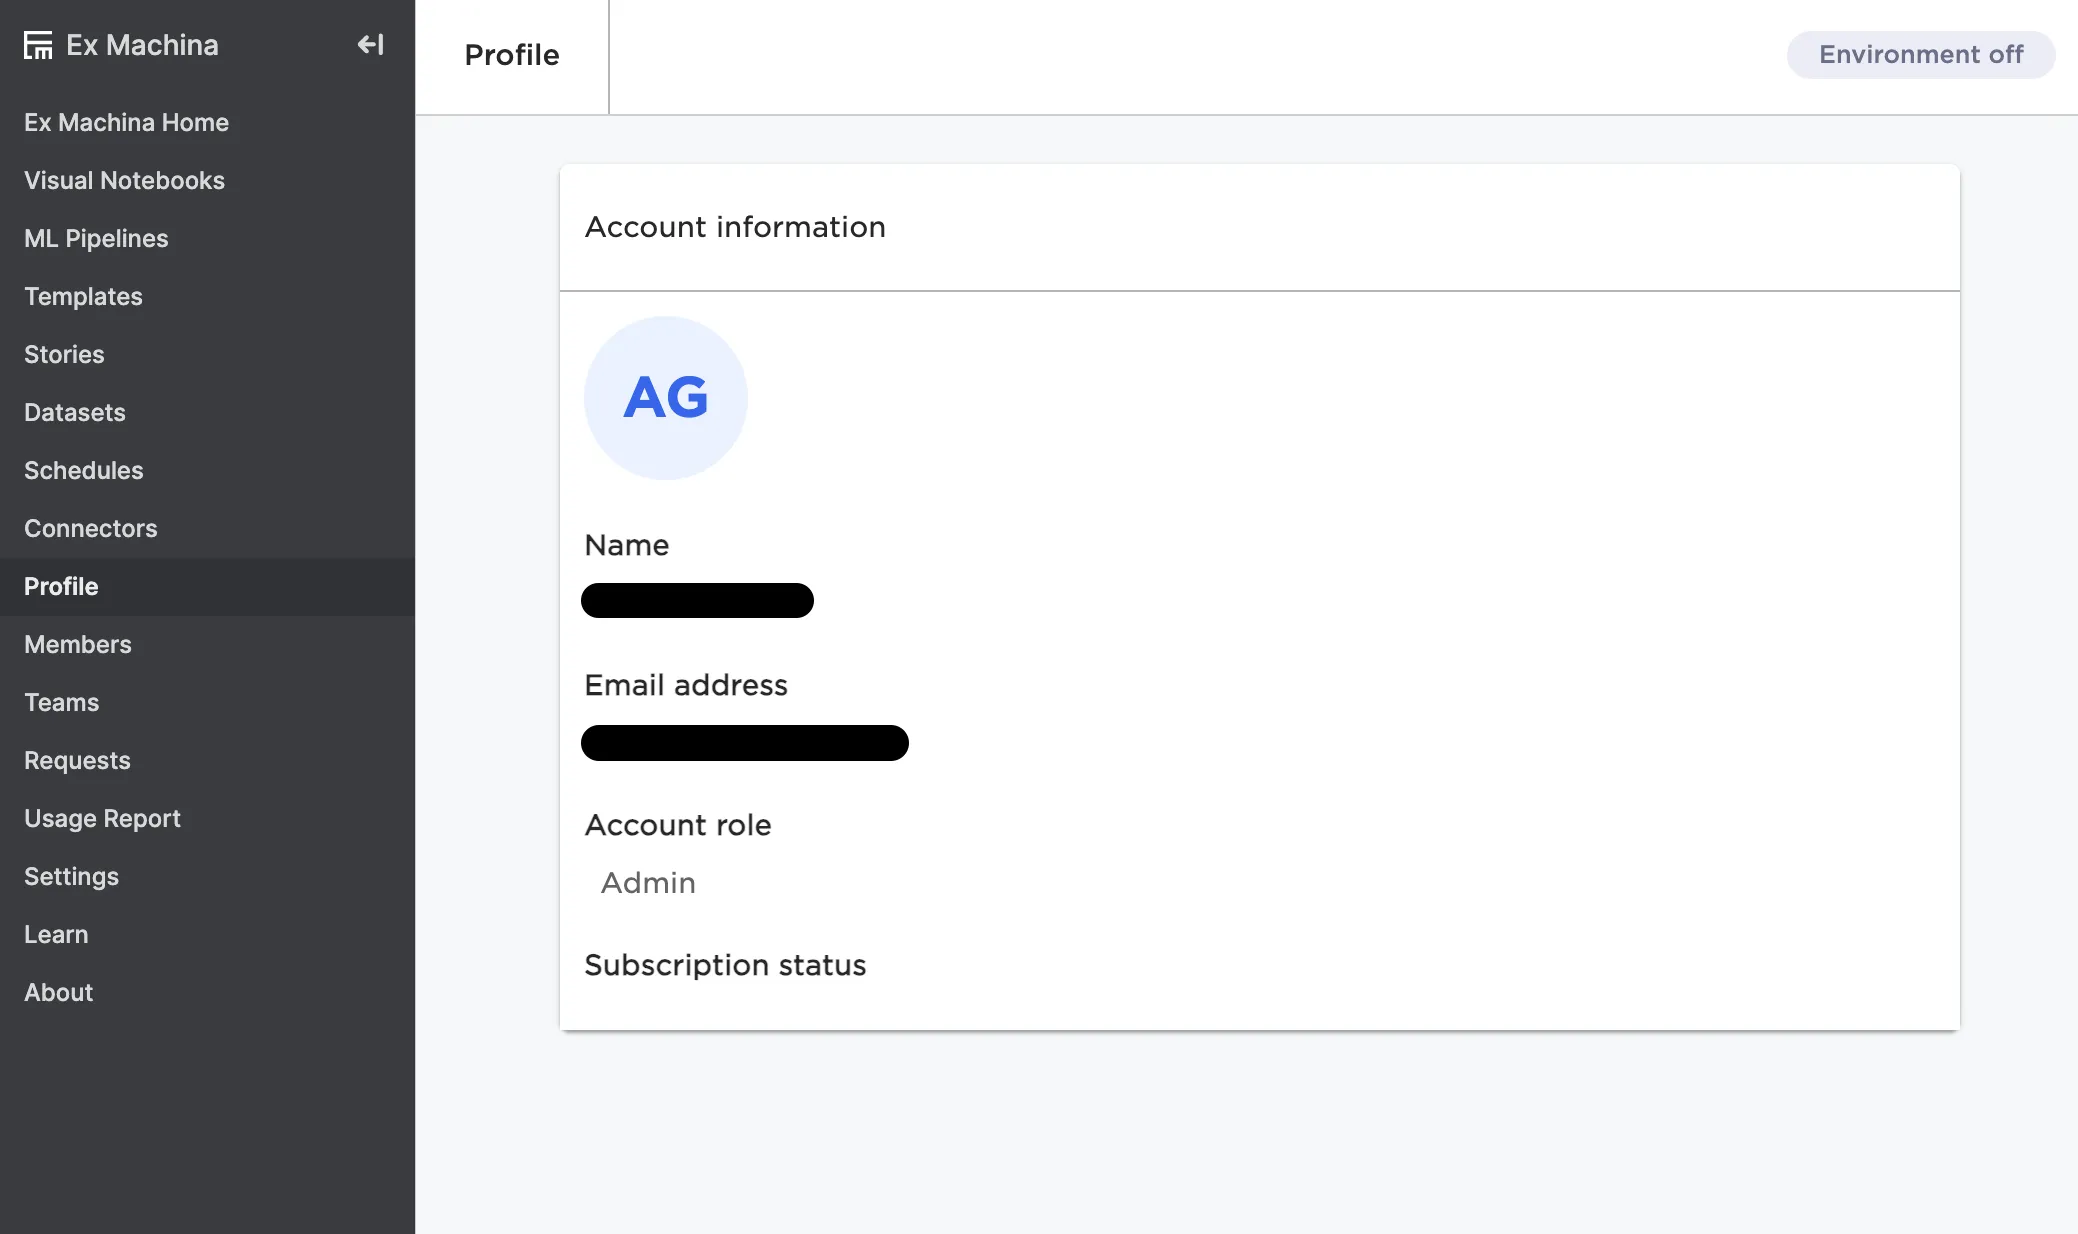
Figure 10: The Profile page
Members
This page shows a list of all members added to Visual Notebooks.
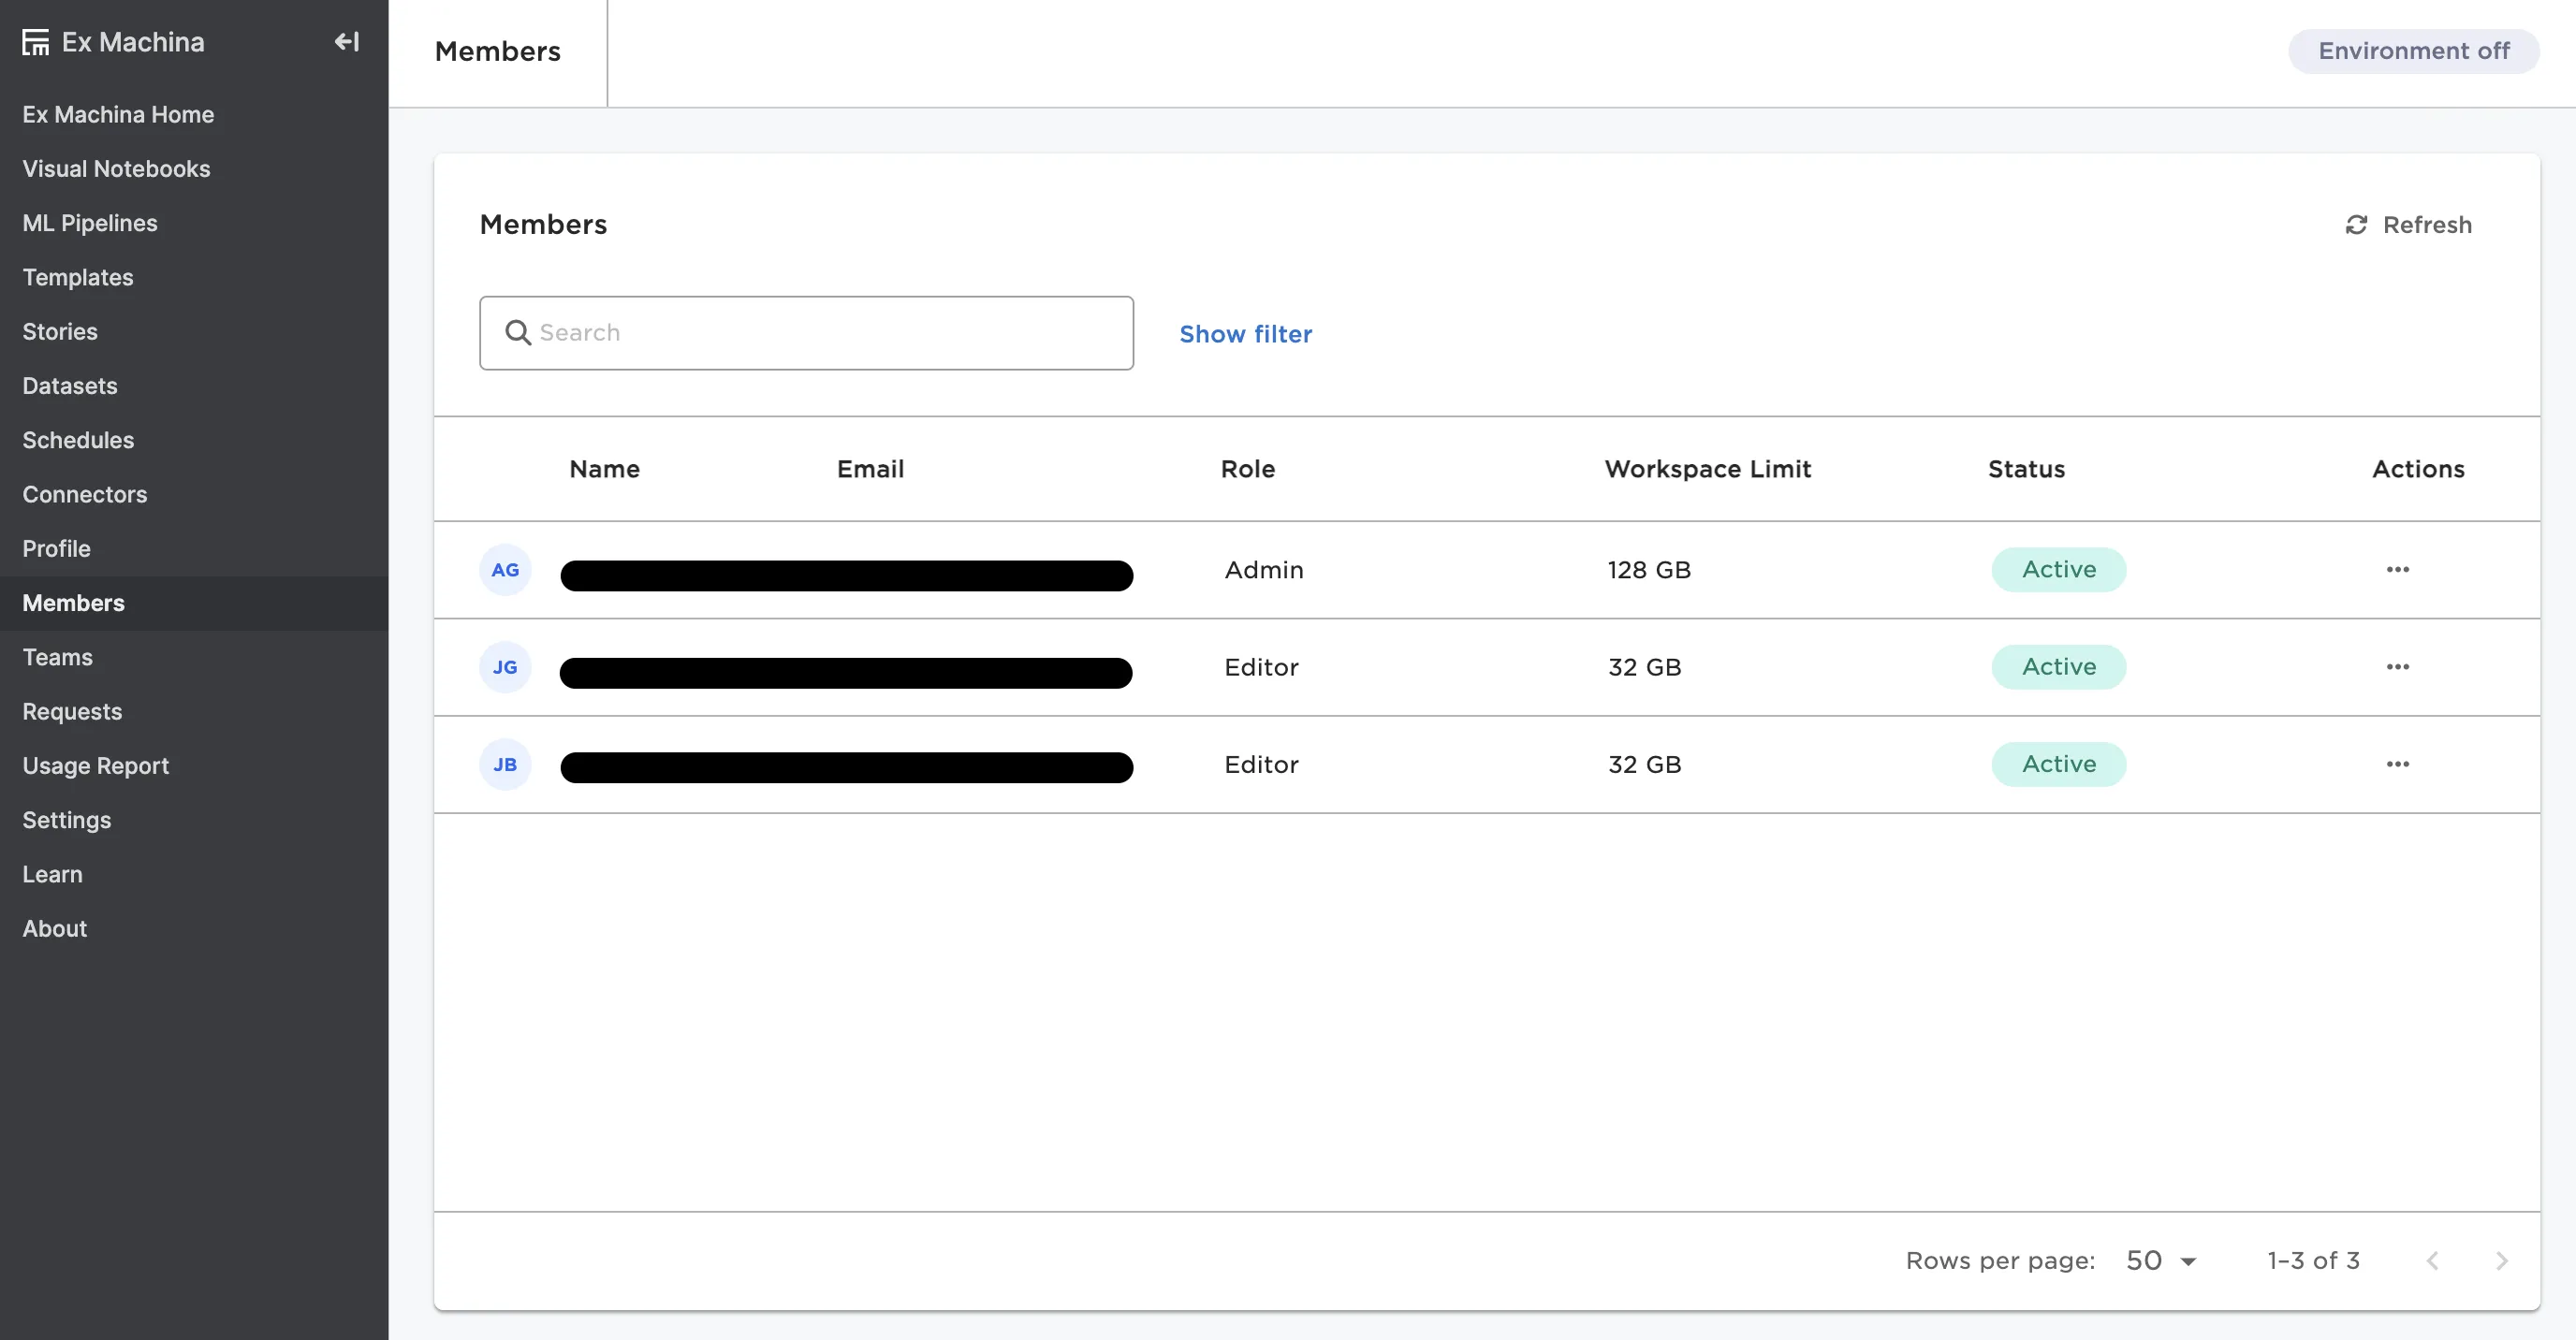
Figure 11: The Members page
Teams
This page shows teams within Visual Notebooks. Select a team to see existing members and add new members. Create new teams by selecting the + Add new button in the top right corner. For more information on creating and managing teams, see the Collaboration section.
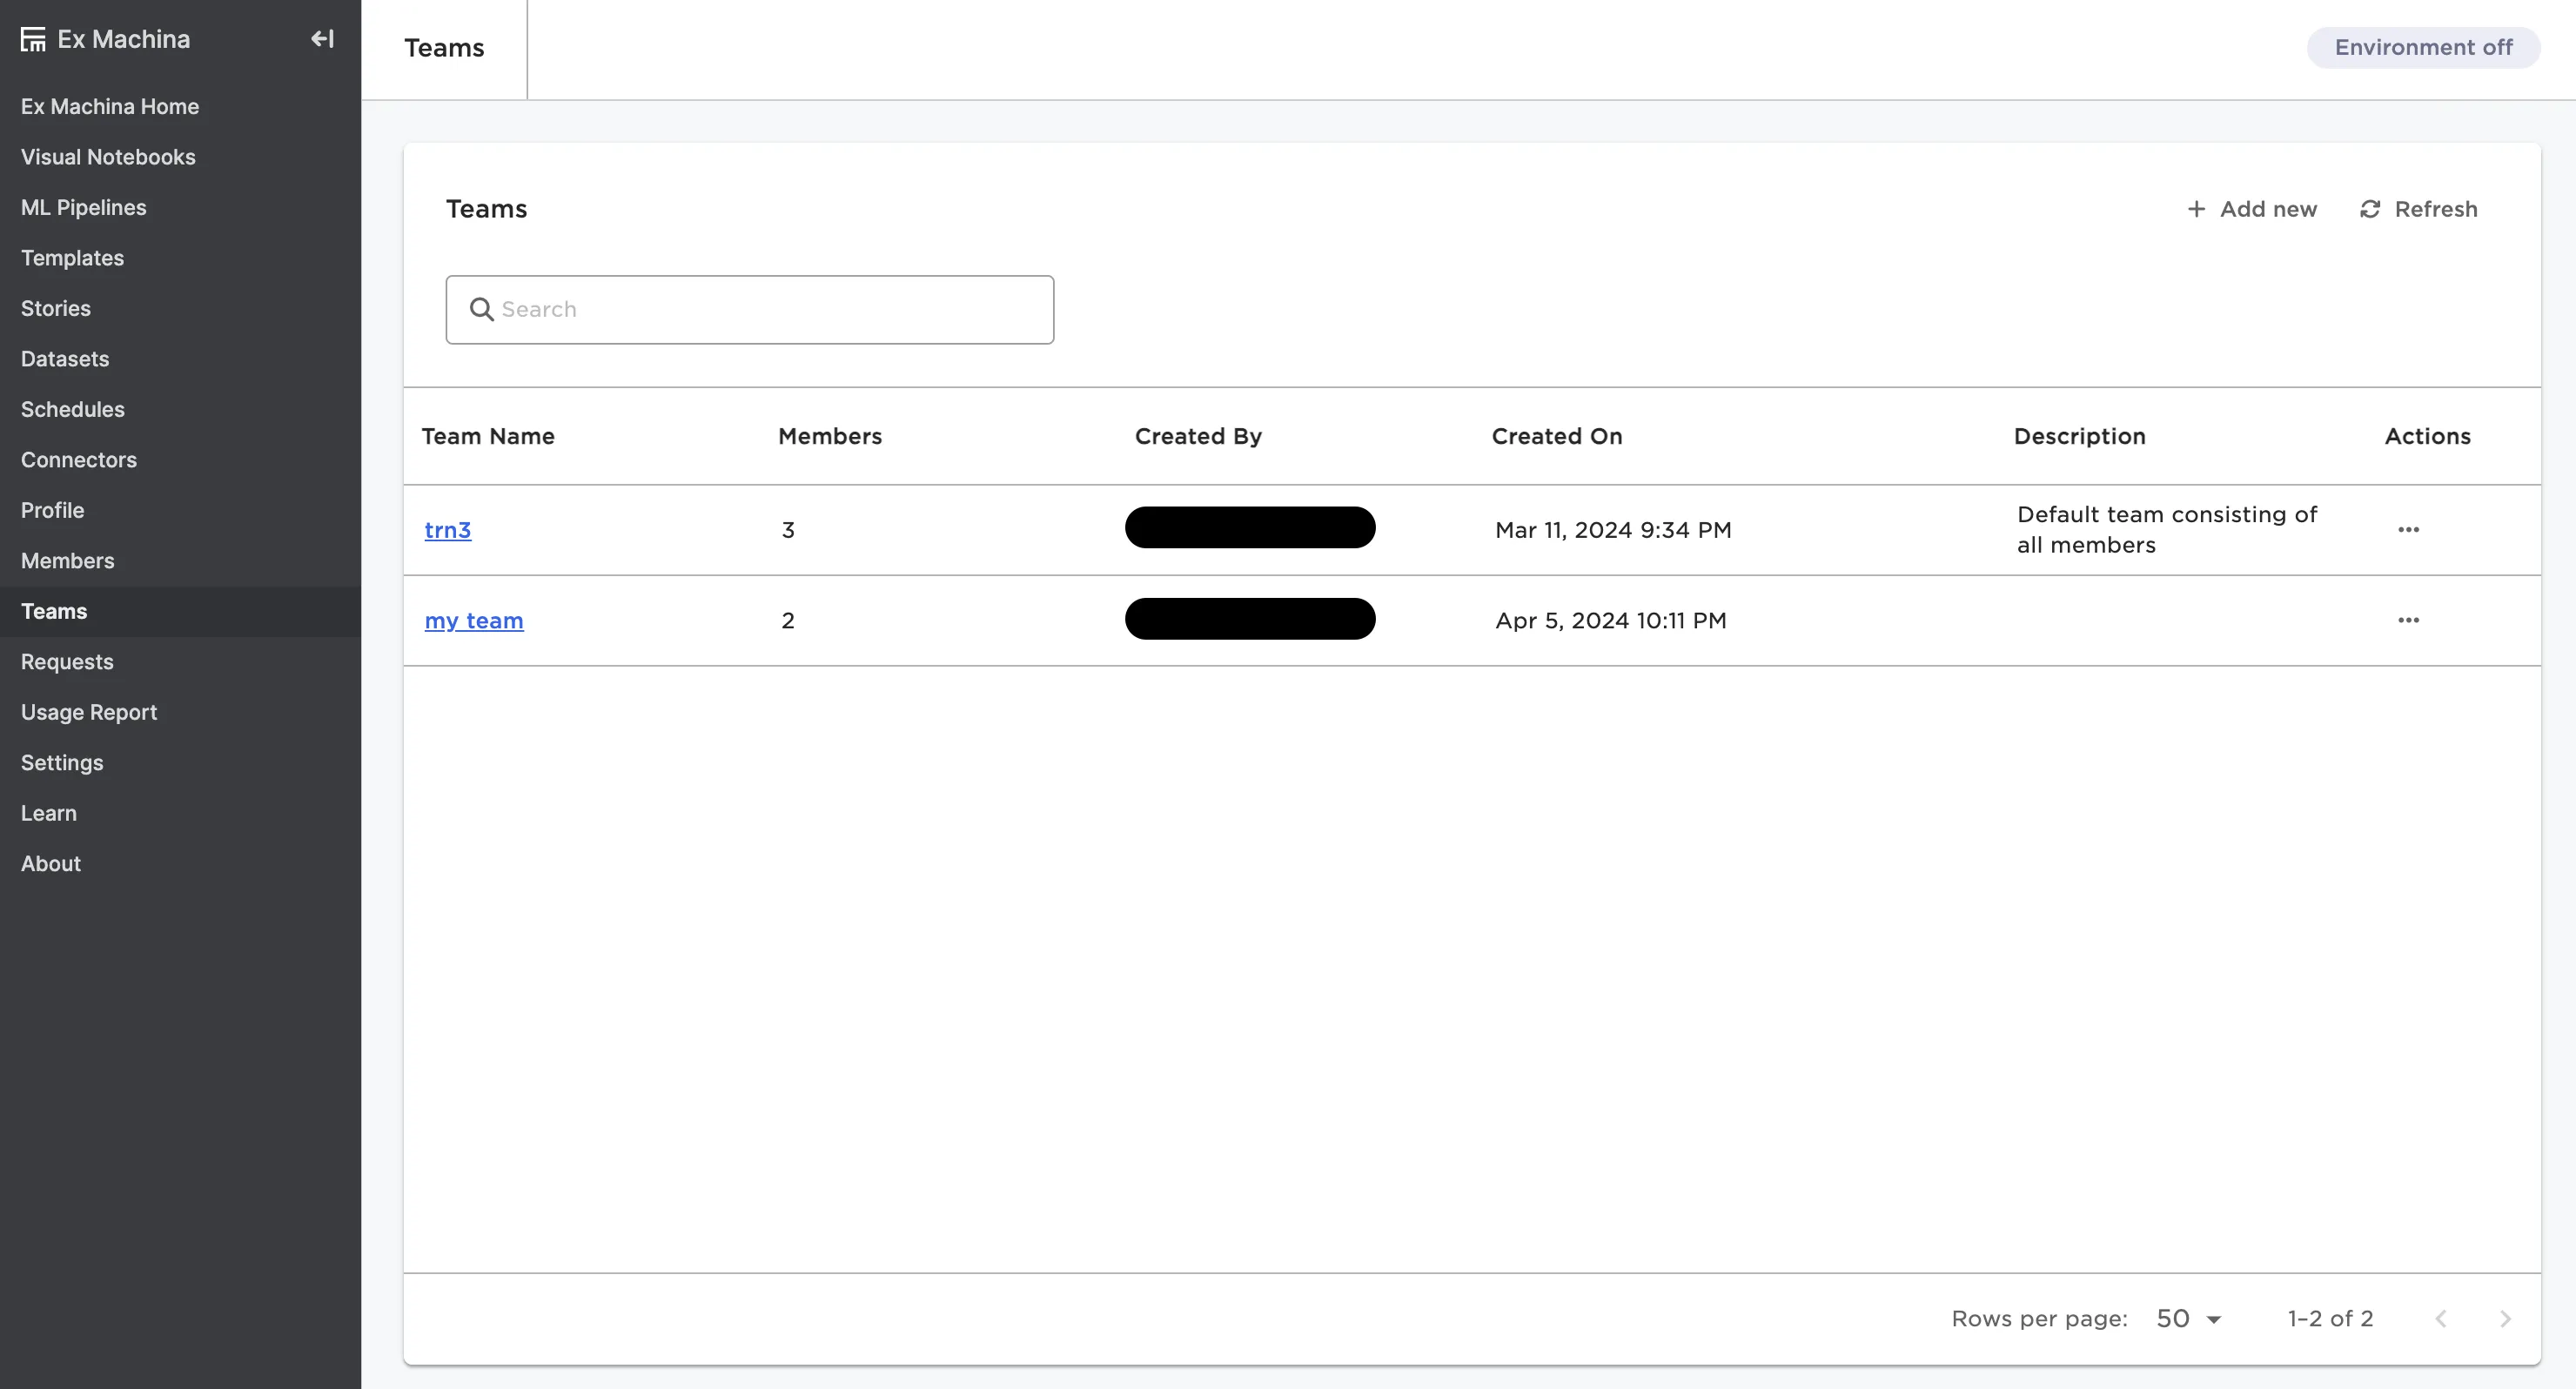
Figure 12: The Teams page
Requests
This page displays all user changes within Visual Notebooks. When an admin changes a user's max workspace size or adjusts their role, the actions shows up as a request. View either open or closed requests.
This page is only available to admin users.
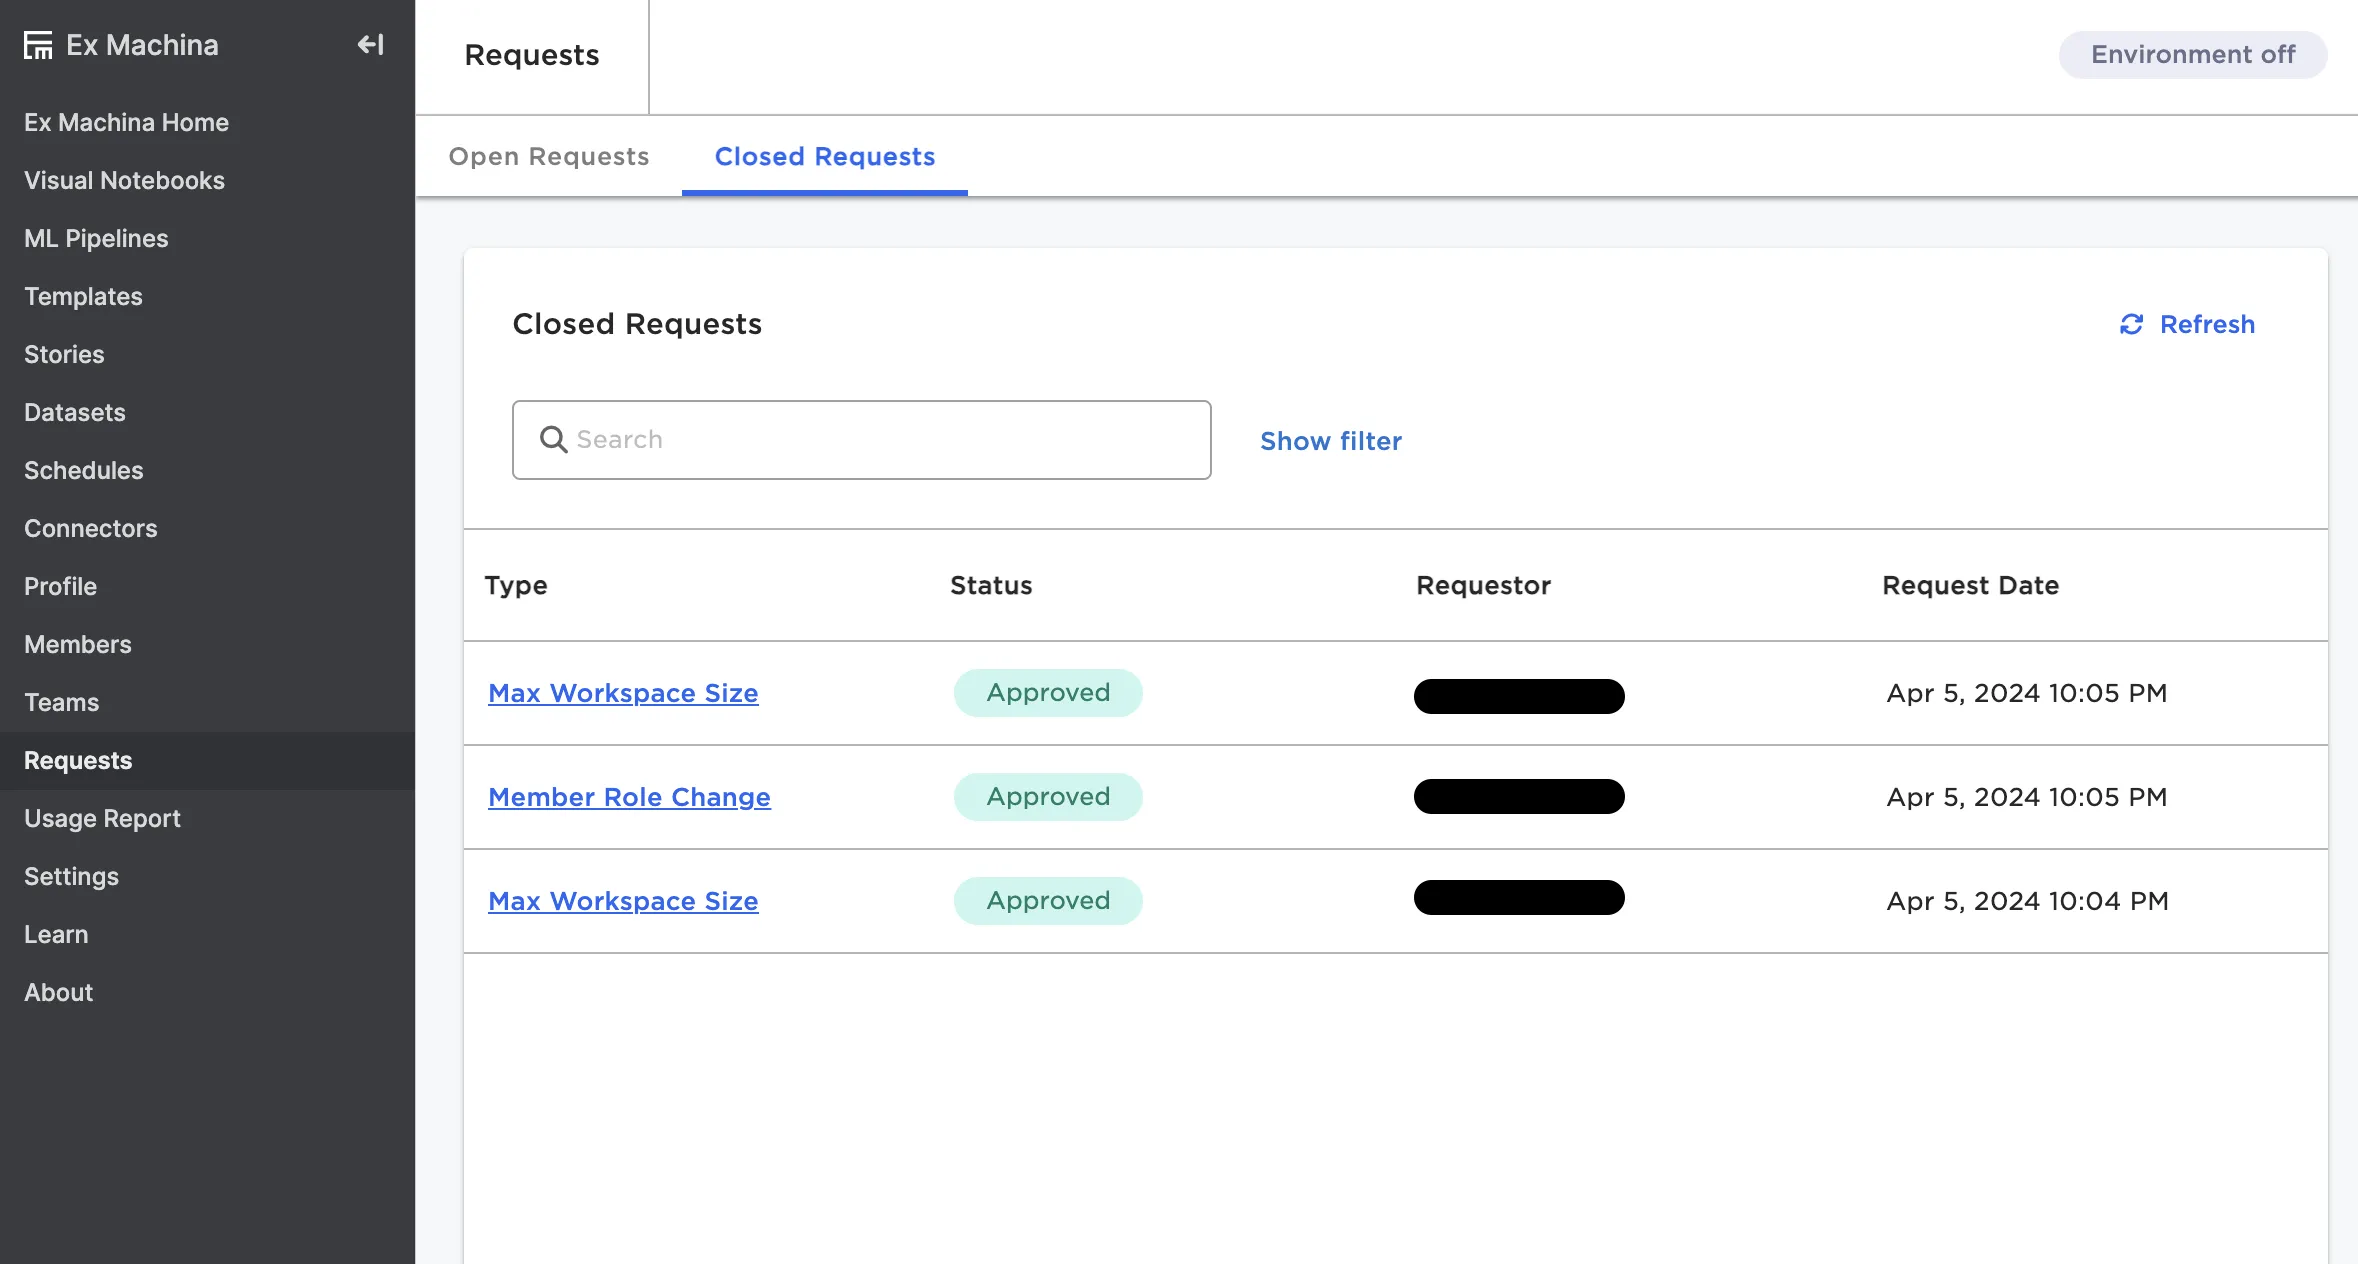
Figure 13: The Requests page
Usage Report
This page provides product usage information on a monthly basis. Select a month to view the usage for that month broken down by each user's individual sessions.
This page is only available to admin users.
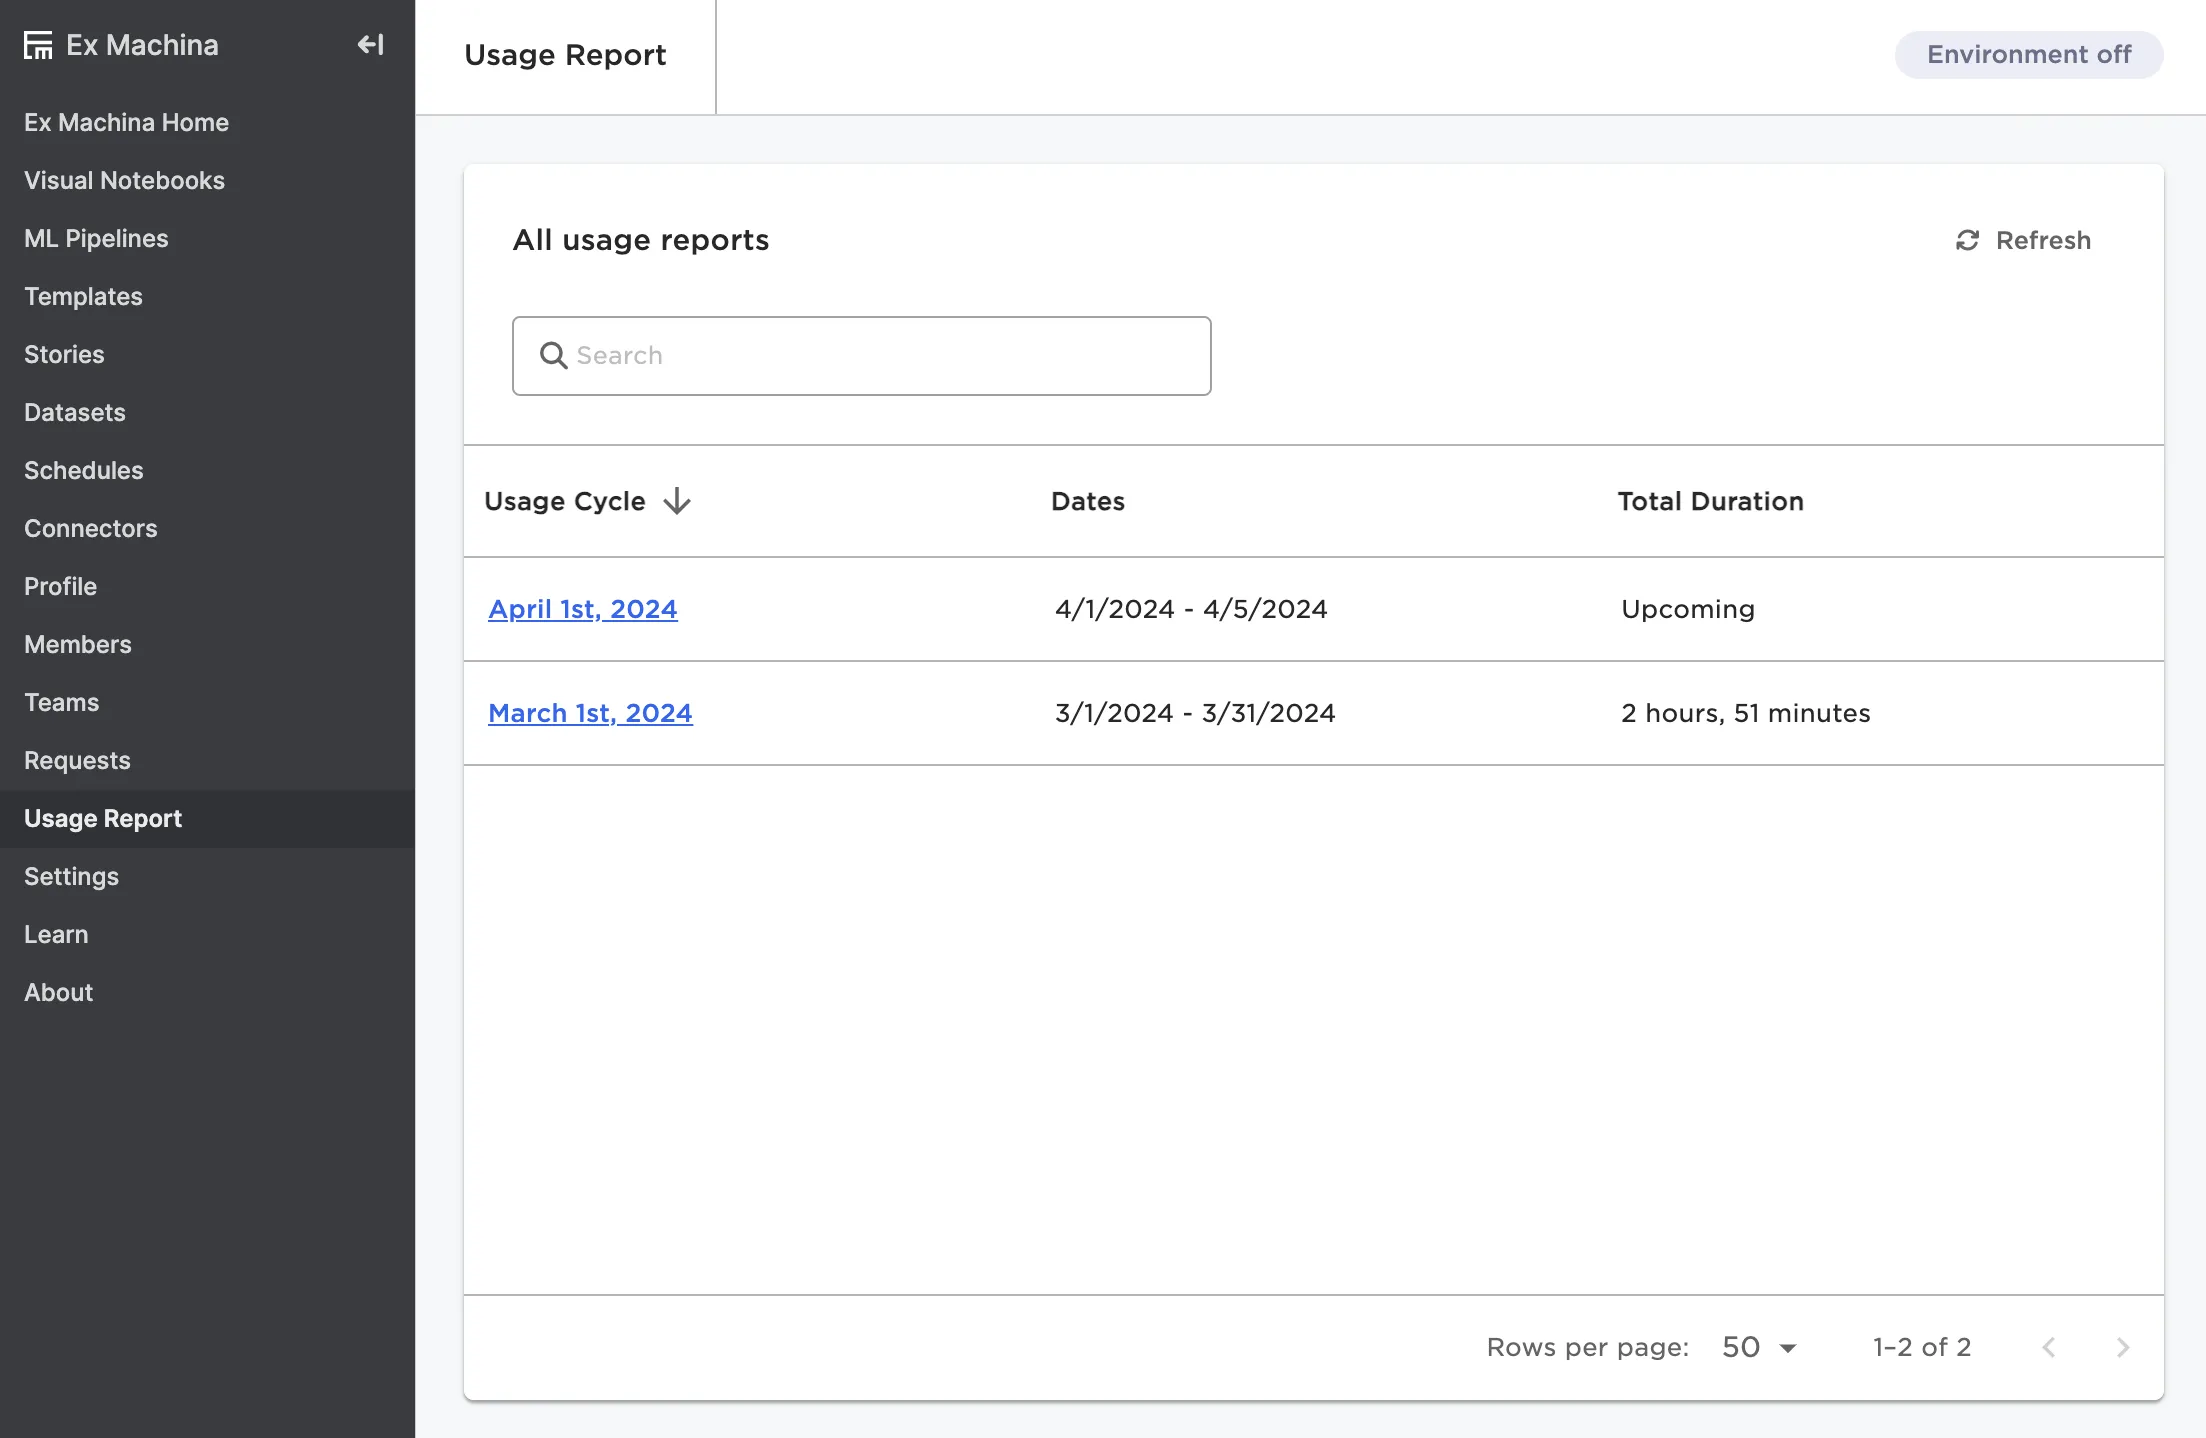
Figure 14: The Usage Report page
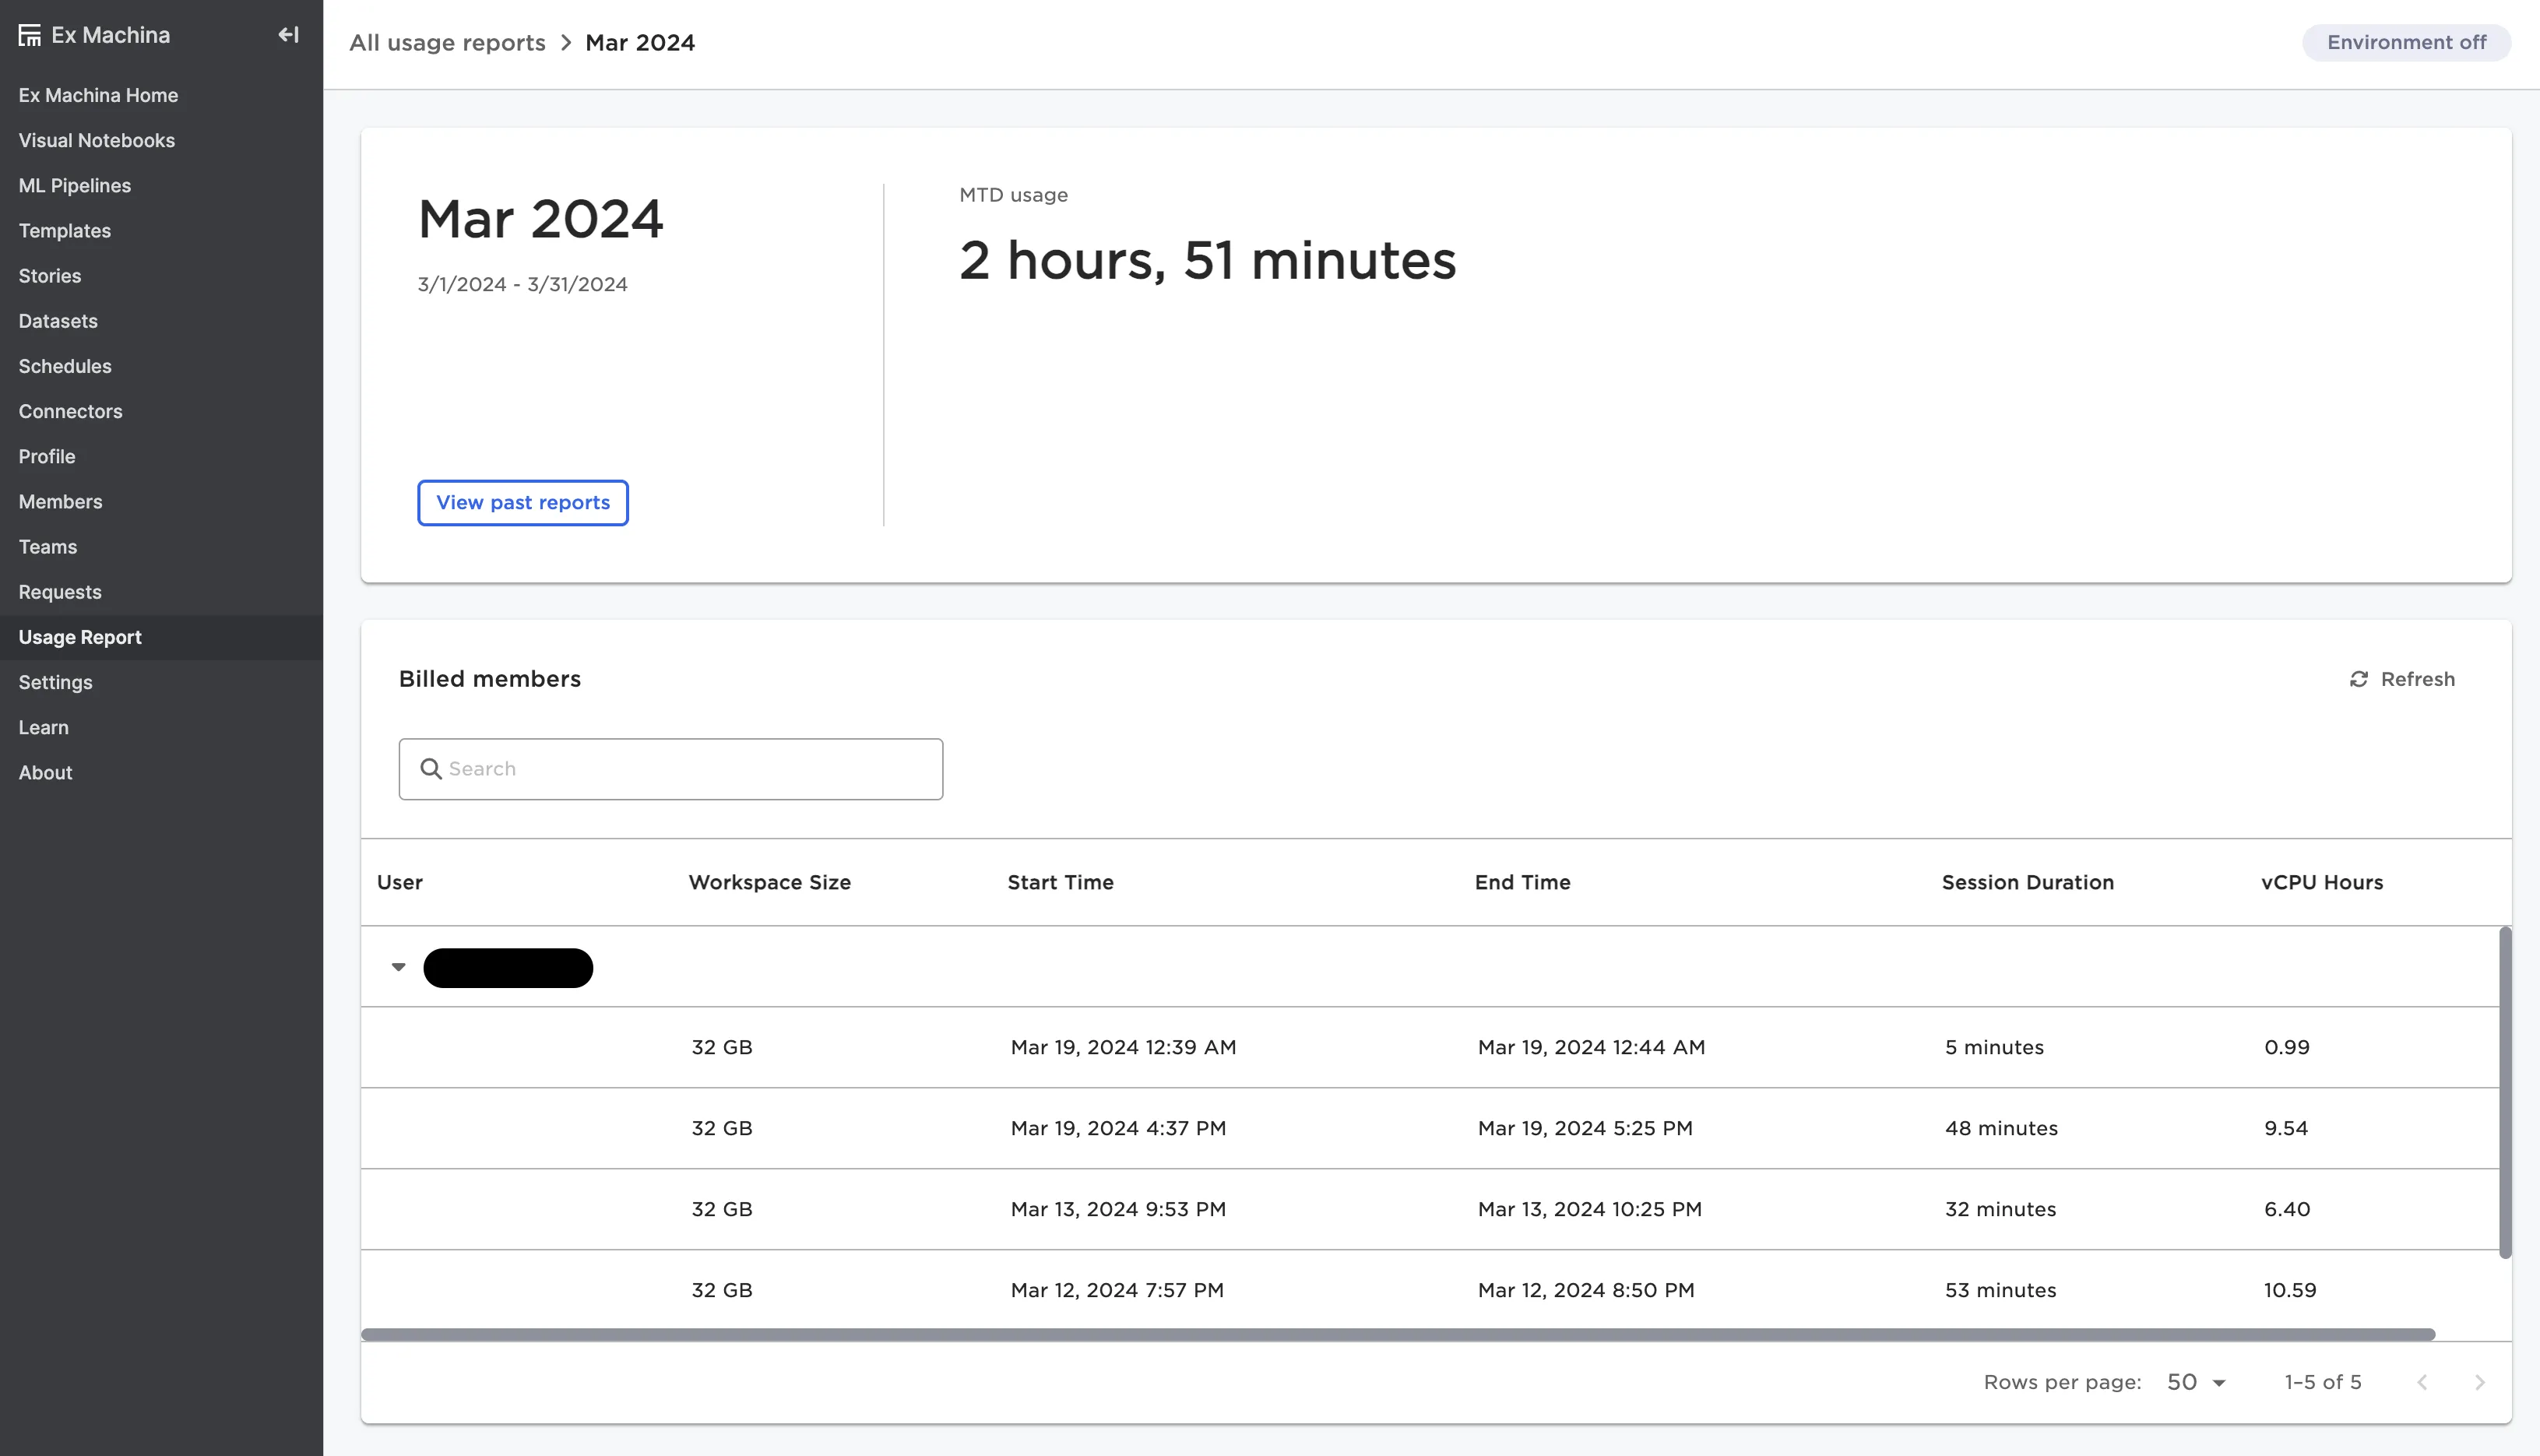
Figure 15: A usage report for a specific month
Settings
This page allows you to adjust the configuration of your workspace. For more information, see the section on the workspace.
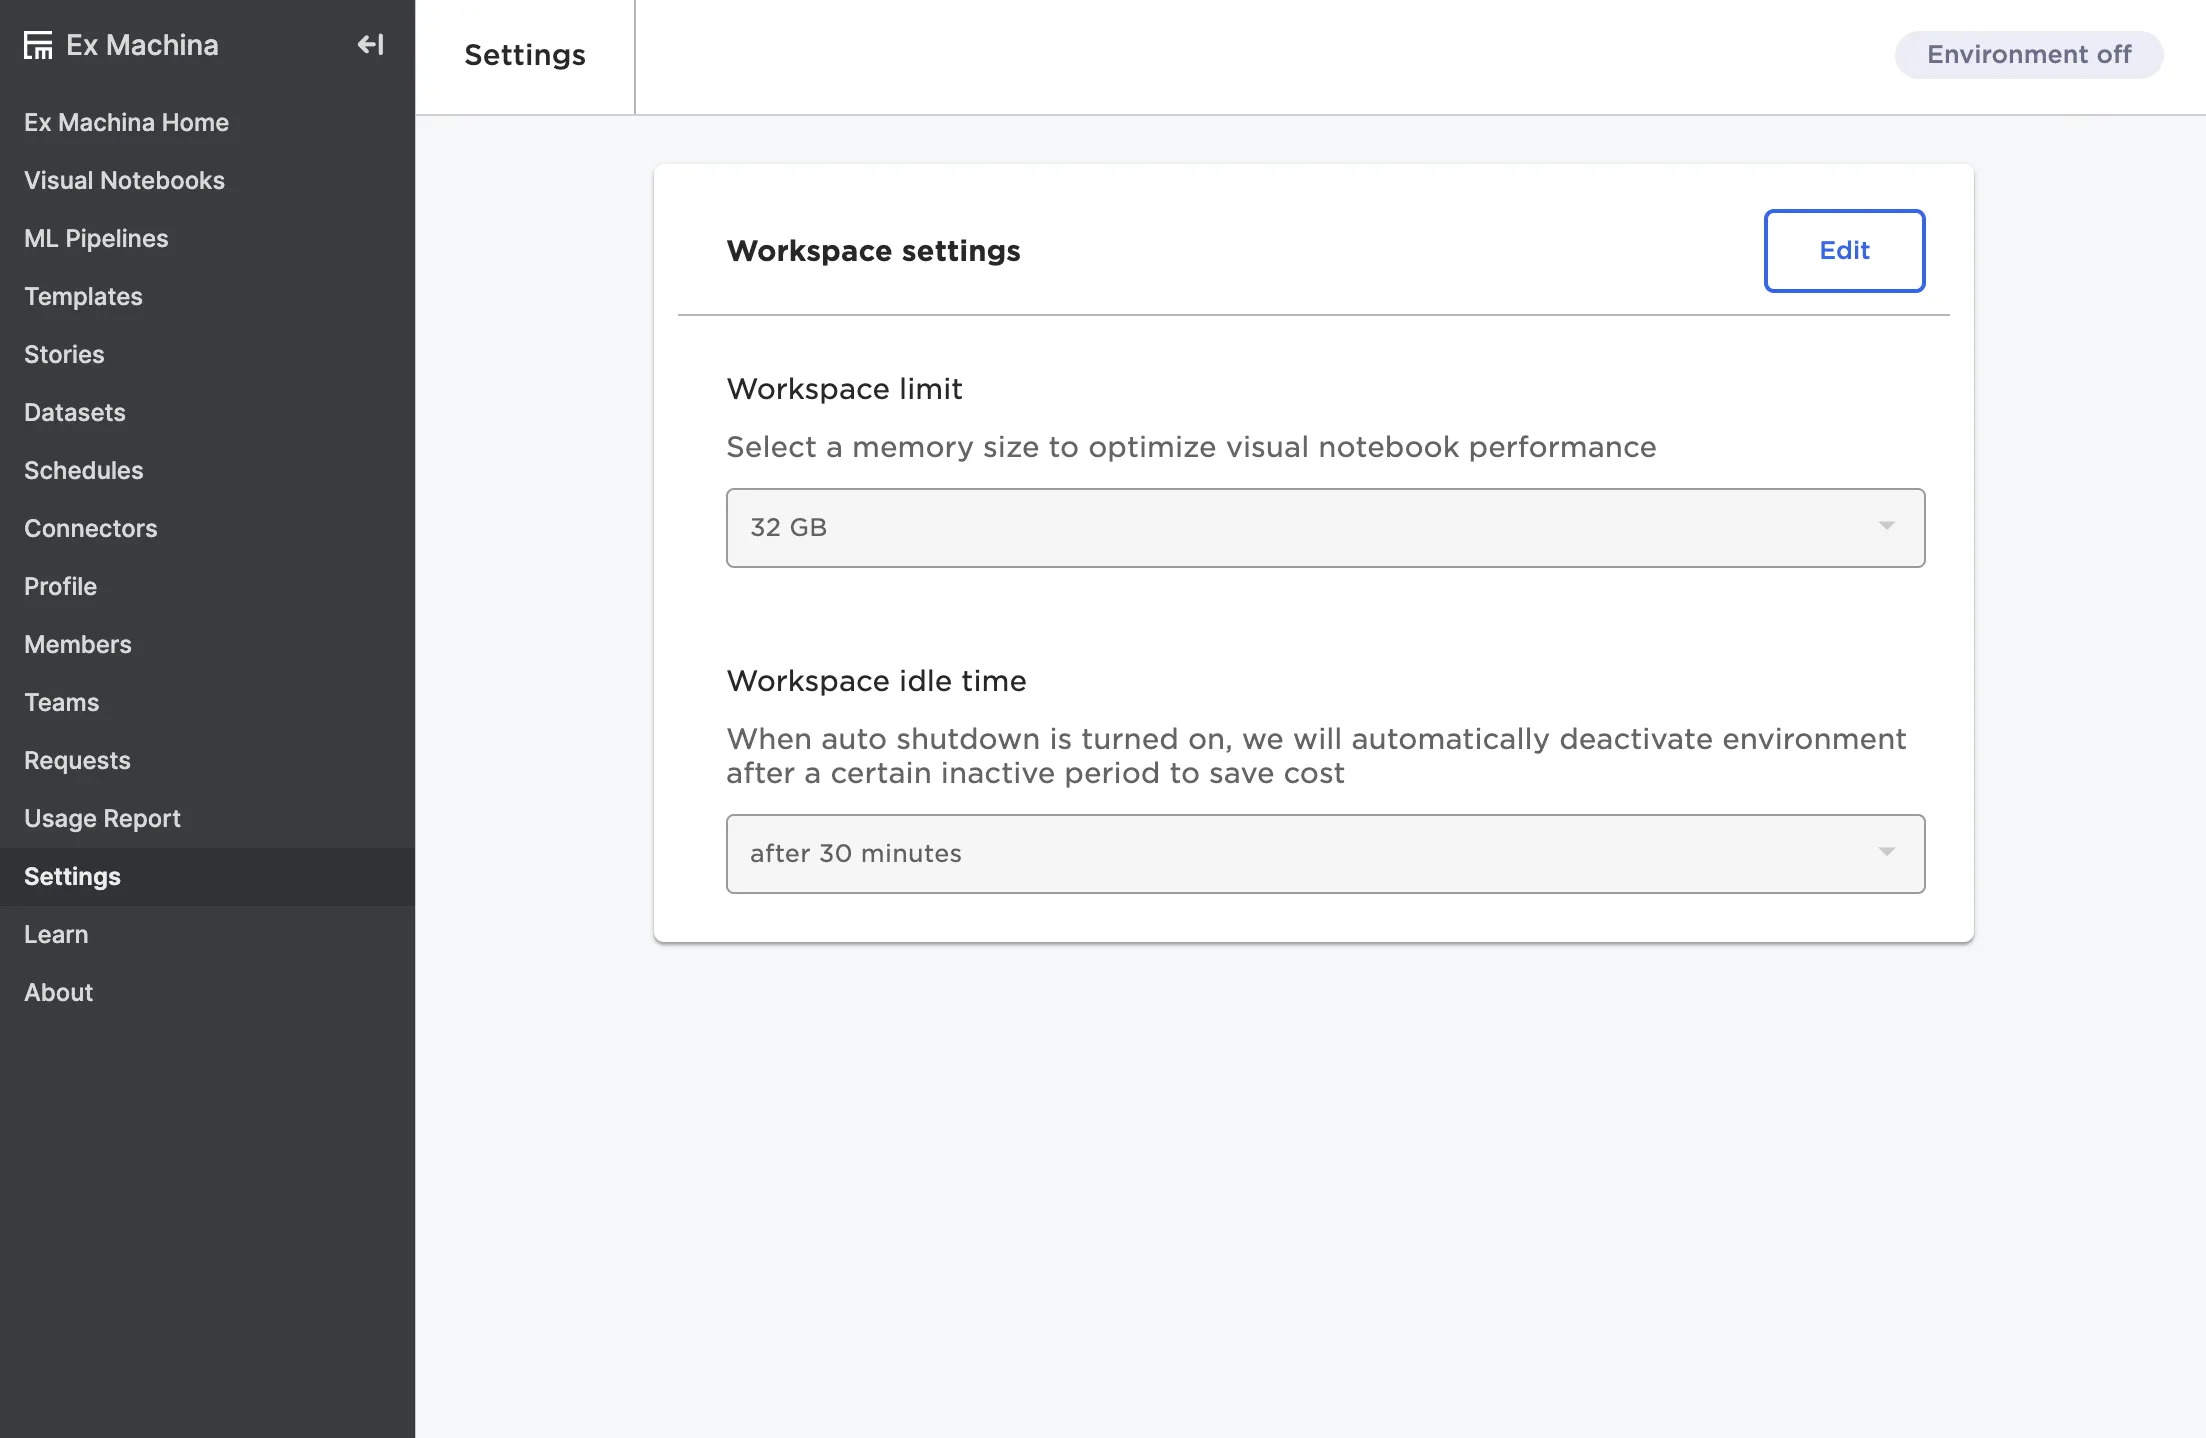
Figure 16: The Settings page
Learn
This page contains all documentation for Visual Notebooks. Read node documentation, explore the user guide, follow along with the quick start tutorial and educational videos, and learn about the product's capabilities.
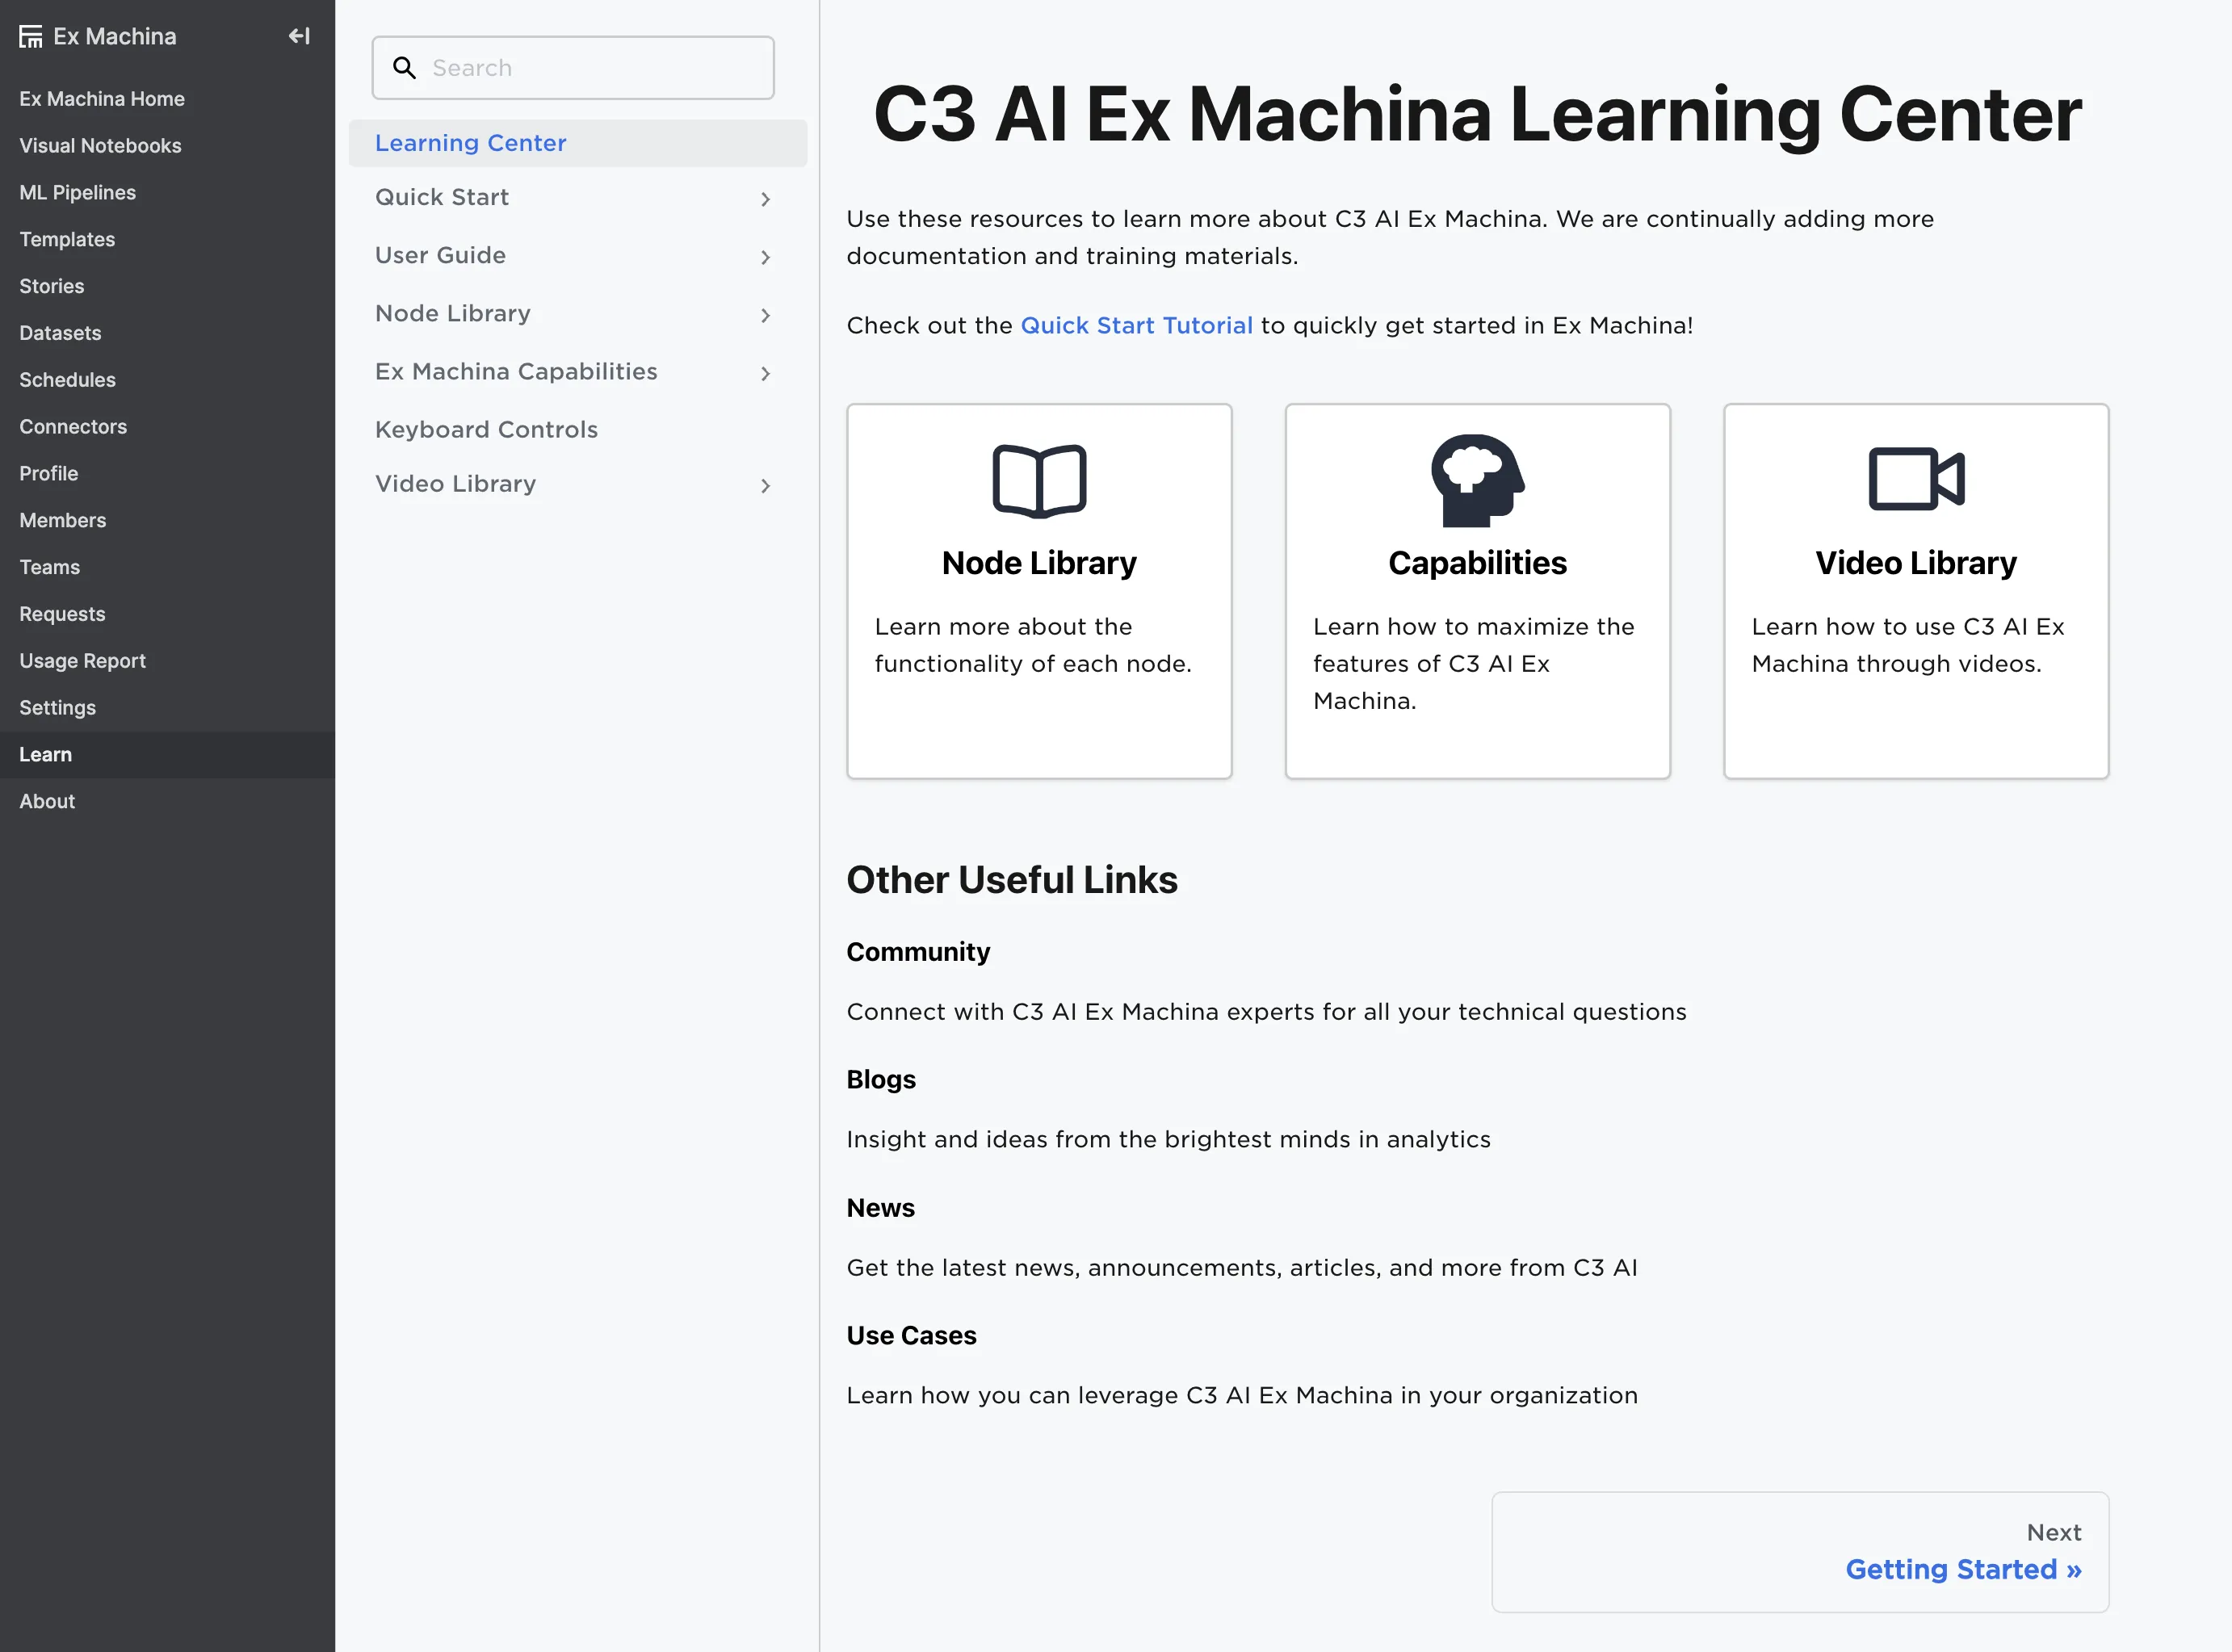
Figure 17: The Learn page
About
This page provides important legal information, including third part notices and licenses, the C3 AI subscription agreement, and product version details.
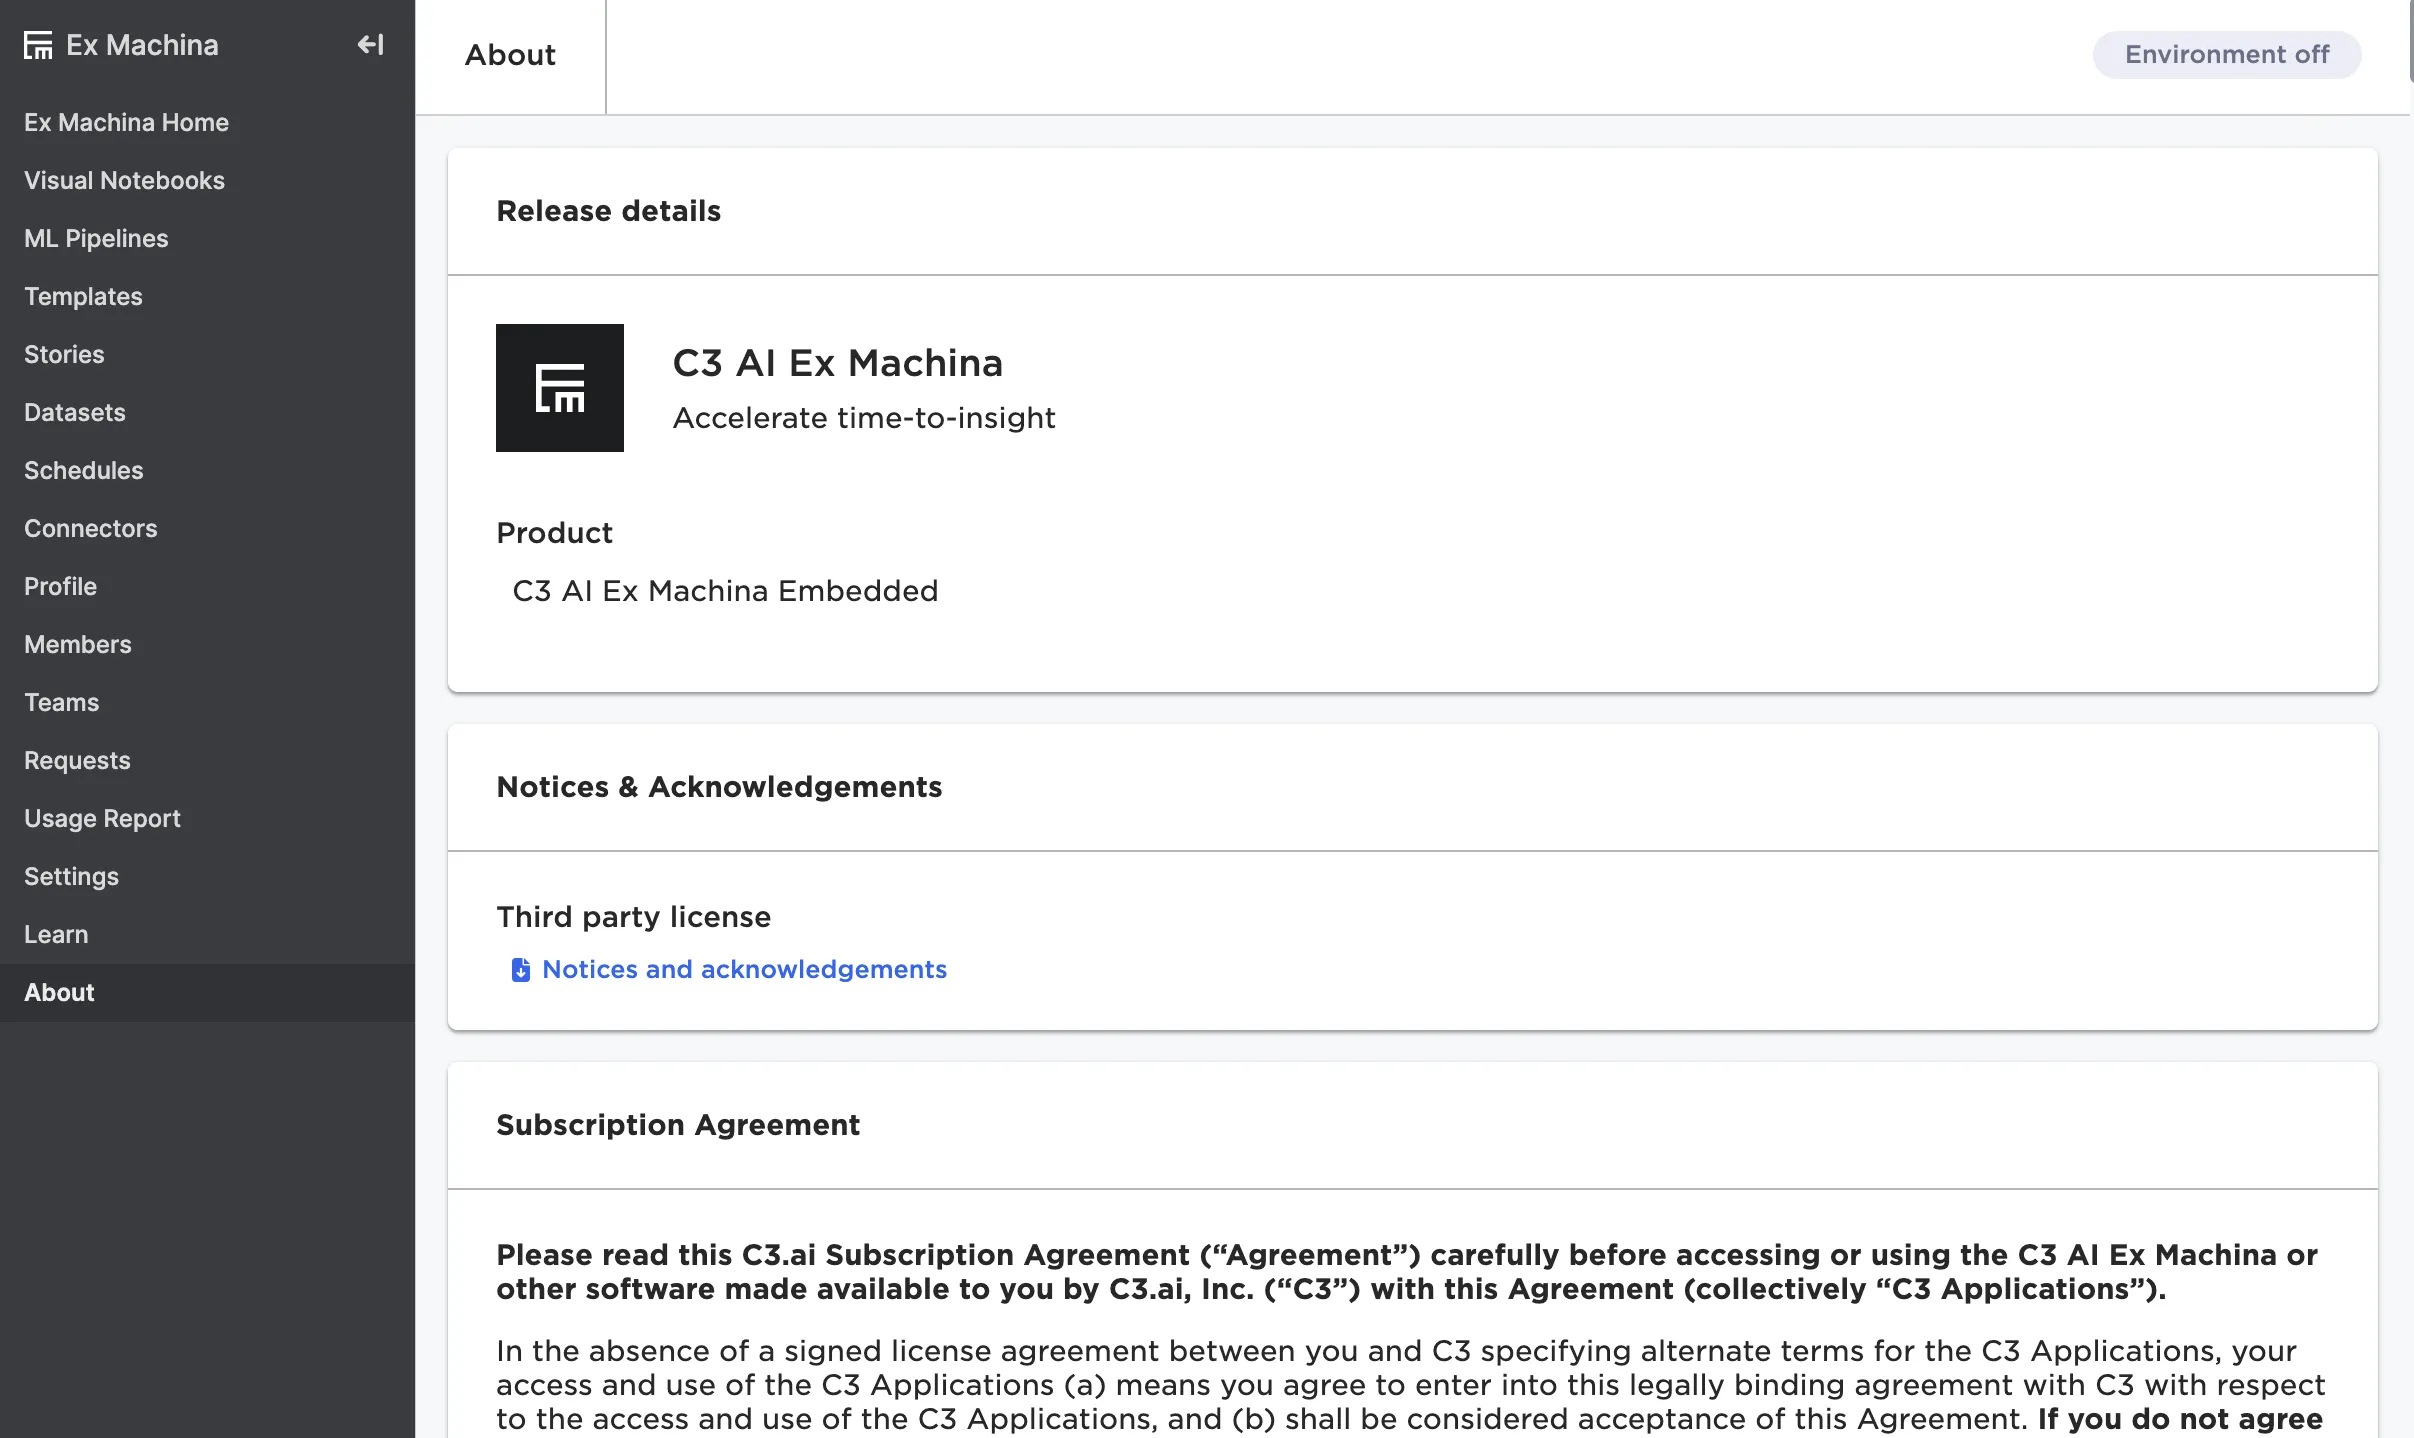
Figure 18: The About page