Tool Workbench
The Tool Workbench is where you configure tool behavior, test functionality, and review execution traces. Use the workbench to define tool logic, validate inputs and outputs, and ensure tools integrate correctly with agents before moving to Store.
Access the Tool Workbench
Access the workbench from the Tool Gallery:
- Navigate to Agents > Gallery > Tools tab.
- Select a draft tool card to open the workbench.
The Tool Workbench displays the tool name, tool type (Python Tool or C3 Action Tool), draft status, and last updated time at the top.
Tool Workbench layout
The workbench displays three panels regardless of tool type:
- Configuration (left): Configure tool settings. Content varies based on whether you created a Python Tool or C3 Action Tool.
- Testing (center): Test your tool with standalone or agent-level tests.
- Trace (right): View detailed execution traces from testing your tool with an agent for debugging.
All panels are collapsible. The Trace panel is collapsed by default.
Configuration panel
Configuration panel content varies based on whether you created a Python Tool or C3 Action Tool.
Python Tool
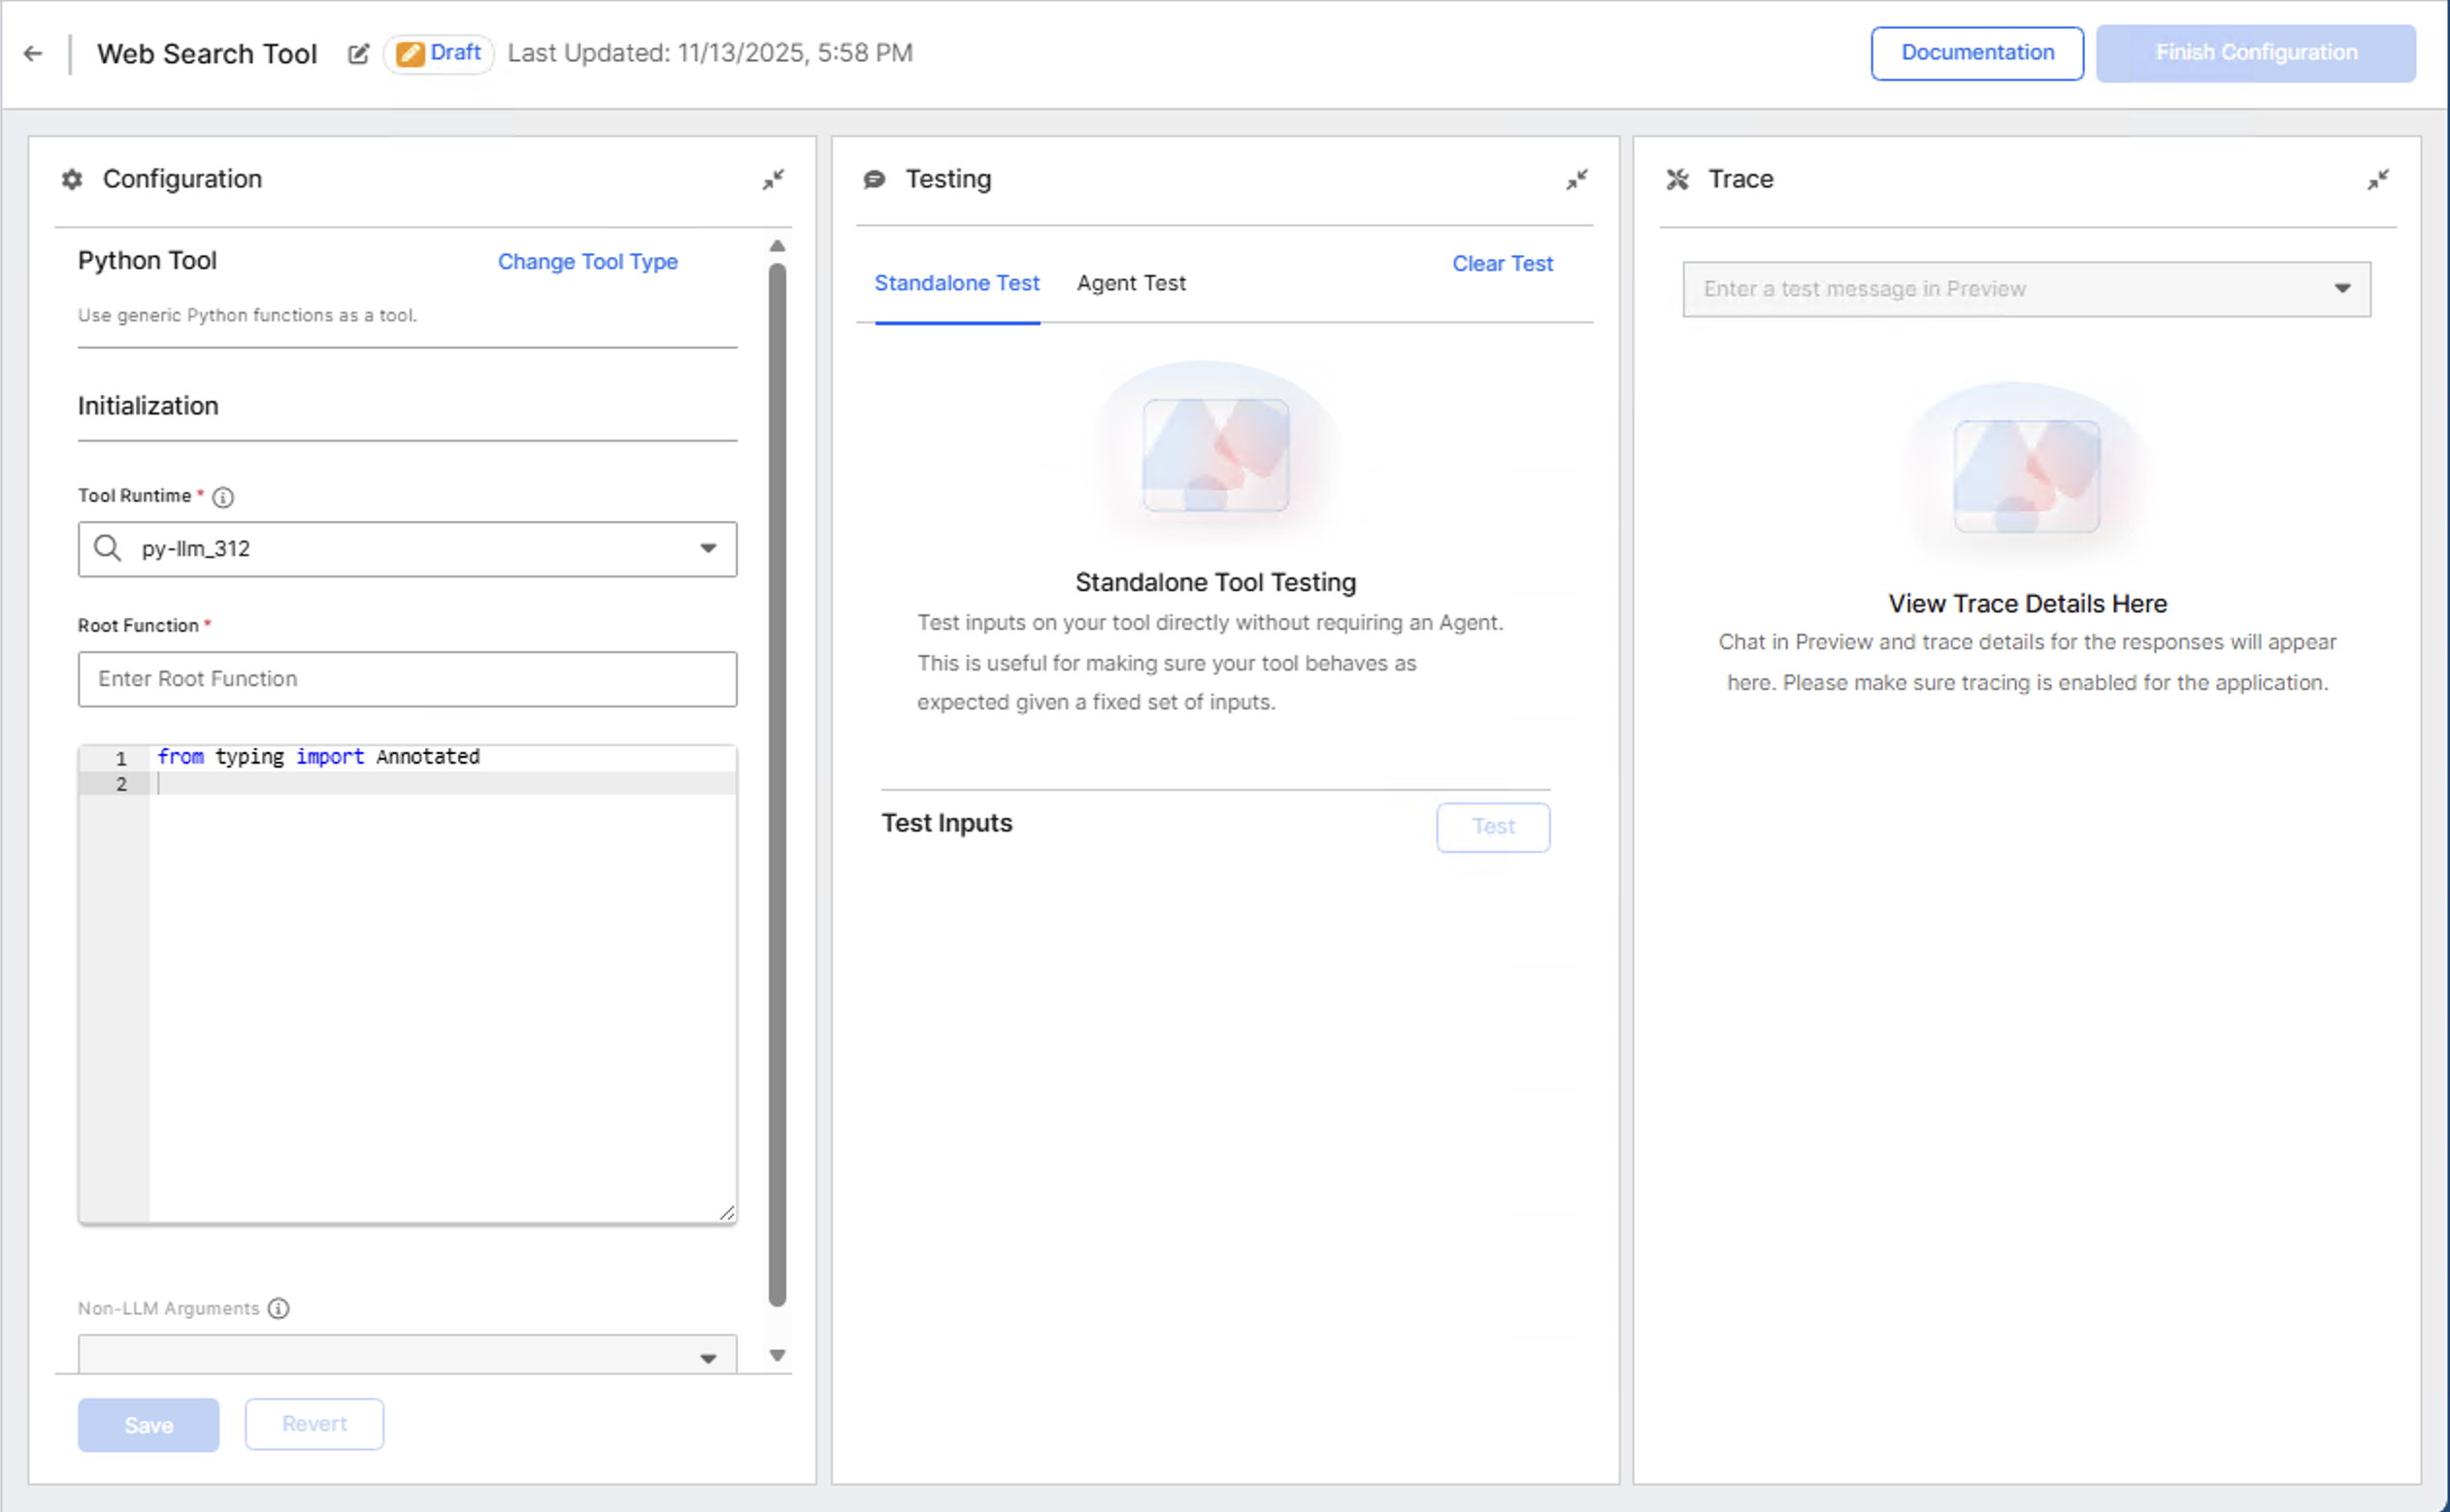
- Tool Runtime dropdown: Select the Python runtime environment (for example, py-llm_312).
- Root Function field: Enter the main callable function name from your Python code.
- Source Code editor: Paste your complete Python implementation. The system extracts LLM description and arguments from your function docstring and type annotations following successful validation.You can modify
- Non-LLM Arguments section: Add injected arguments that the system provides but the LLM cannot see or modify.
For complete Python Tool creation instructions, see Create Python Tools from the UI.
C3 Action Tool
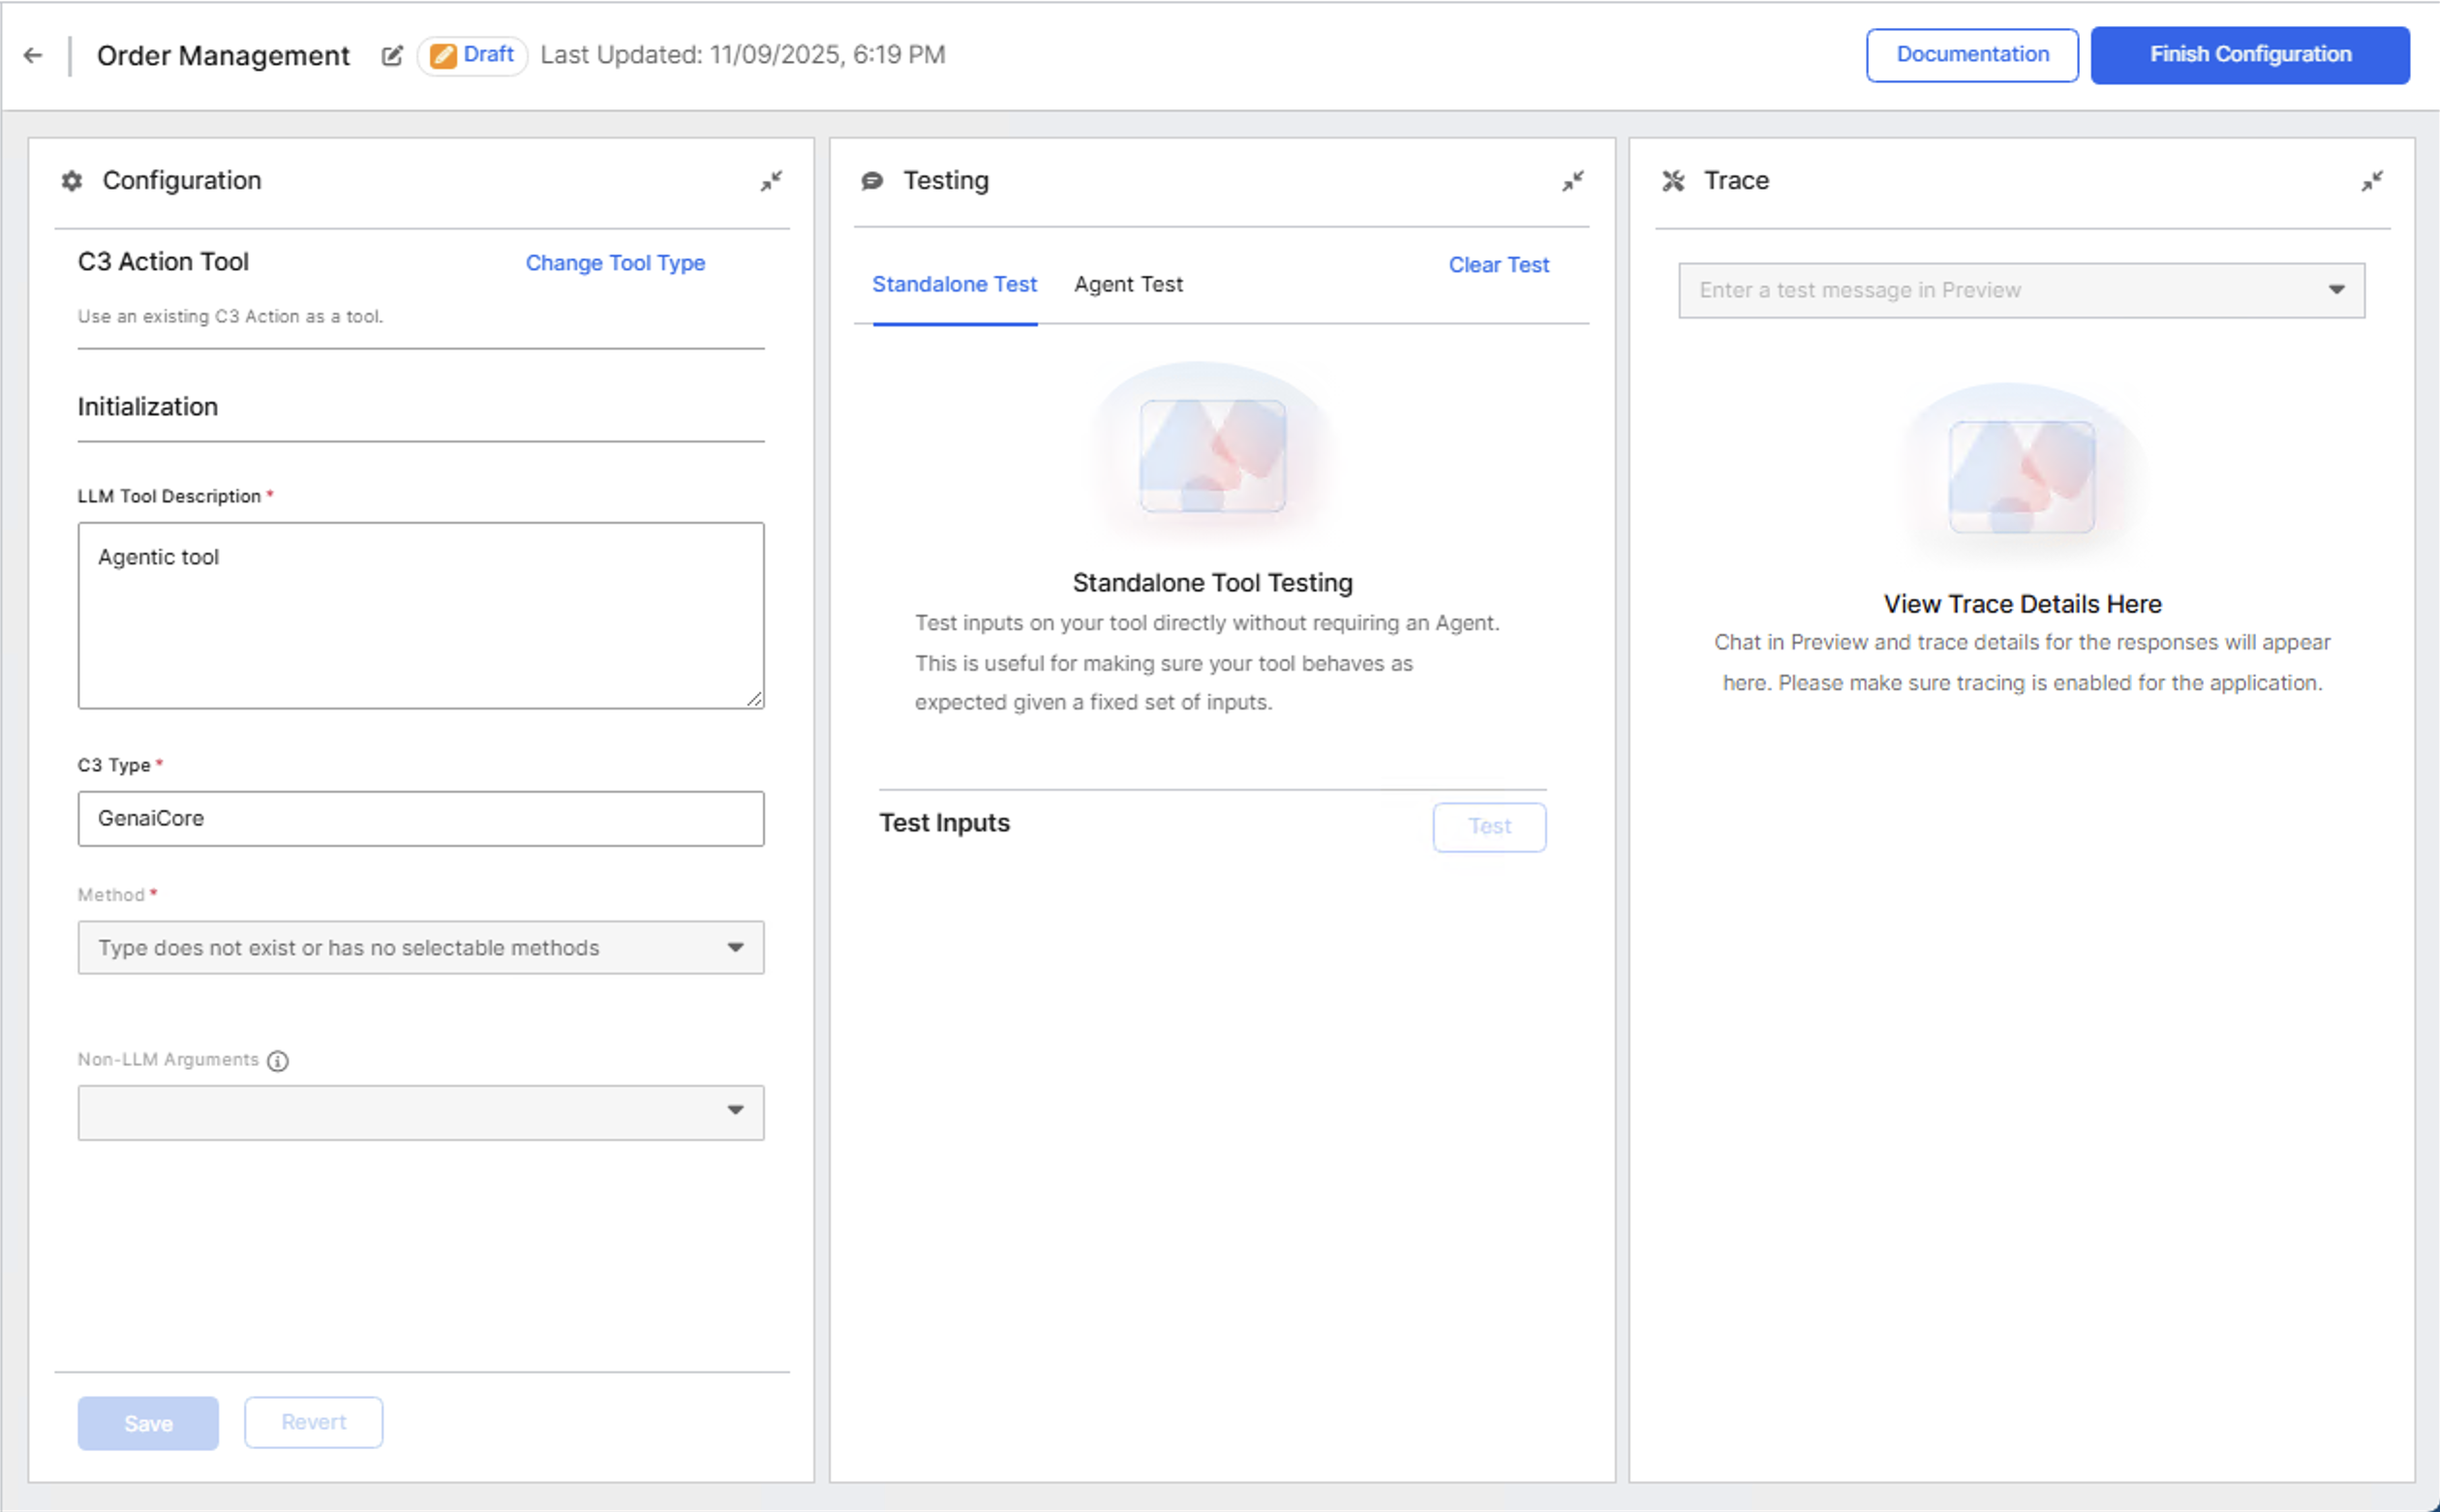
- LLM Tool Description field: Enter text that explains what the tool does for the language model.
- C3 Type field: Enter the C3 Type name that contains the method you want to expose.
- Method dropdown: Select the static or instance method from the Type.
- Non-LLM Arguments: Add injected arguments that the system provides but the LLM cannot see or modify.
For C3 Action Tool details, see Create C3 Action Tools from UI.
Testing panel
The Testing panel provides two test modes:
- Standalone Test tab: Test tool inputs directly without requiring an agent. Enter parameter values and select Test to execute.
- Agent Test tab: Test how the tool performs when called by an agent. Select an agent, enter a message that triggers tool usage, and review the response.
Select Clear Test to reset test inputs and results.
Trace panel
The Trace panel displays detailed execution information when you test your tool with an agent. Traces are not generated for standalone tests.
- Trace selector dropdown: Choose which trace to view when multiple traces exist.
- Tree view: Shows operations in hierarchical order with execution durations.
- Span Detail section: Displays detailed information about the selected operation.
Traces only appear when using the Agent Test tab. Standalone tests do not generate trace information.
For trace interpretation guidance, see Debug using Traces and Spans.
Top actions
The workbench provides action buttons in the top-right corner:
- Documentation: Open a text editor to document your tool's purpose, parameters, and usage. Users can view this documentation in the - Tools Gallery by hovering over the information icon on the tool card.
- Finish Configuration (draft tools only): Move the tool to Store to make it available for agents.
When moving a tool to Store you can select Publish to package to make the deployment available across applications that depend on your package. You must be in development mode to do this.
- Duplicate (store tools only): Create a copy of the tool as a new draft.
Permissions
You can modify, test, and save changes only for draft tools you created. Users with GenaiCore.AgentAdmin or C3.AppAdmin roles can modify any draft tool.
For complete role details, see Agent Lifecycle Management Roles and Permissions