Monitor and Maintain the Data Lakehouse
The Spark Executions page in C3 AI Studio is the primary user interface for monitoring Spark workloads. It tracks every query that ran on a cluster, with filters by status, user, and origin, and a detail drawer for each run. Cluster-lifecycle events and execution logs from a Python session also surface on the same page; the notebook paths at the bottom of this topic show how to opt into logging and run table-maintenance procedures that the user interface does not expose.
Prerequisites
- Access to a SparkCluster and a C3 AI Data Lakehouse-enabled application.
- Familiarity with Spark SQL or PySpark and the Apache Iceberg table format.
- For Spark Connect usage, a Spark cluster that supports Spark 3.4+ (Spark Connect GA in 3.4).
In C3 AI Studio: Spark Executions page
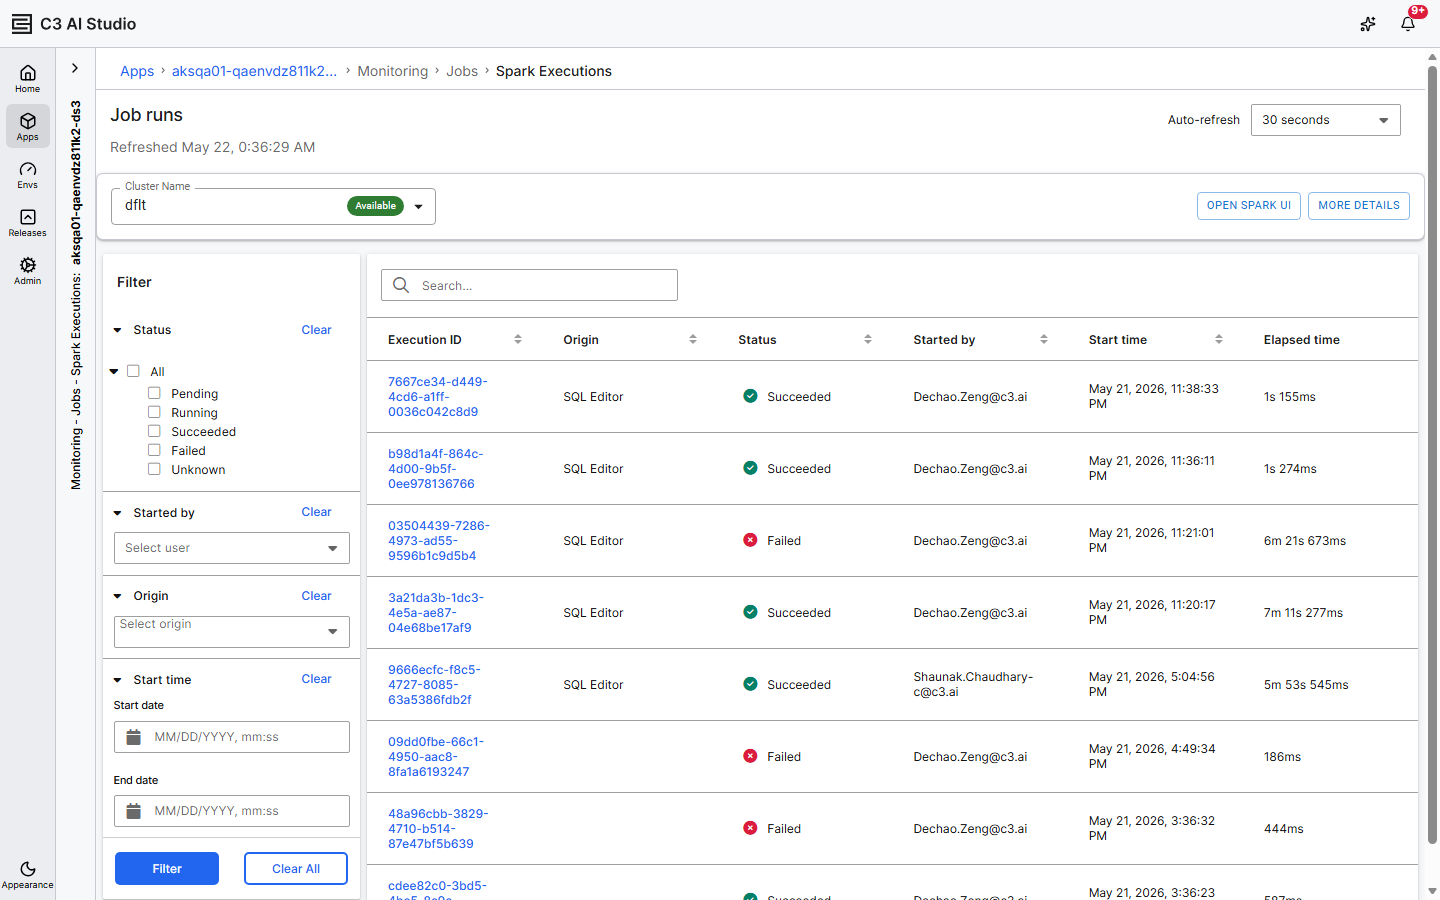
The Spark Executions page is the primary user interface for monitoring Spark workloads in 8.11. Find it under Jobs > Spark Executions in your application's side navigation. The page heading renders as Job runs — the side-nav label is Spark Executions but the in-page title is the more general Job runs.
The page is composed of three areas: a cluster status bar, a filter panel, and a results grid.
Cluster status bar
The bar at the top shows the selected cluster's status and recent lifecycle events.
- Cluster Name: Selector that lists every cluster visible to the user, with each cluster's current status. Common statuses are
Running,Hibernated, andPending; a cluster may also displayUnavailablewhen the backing app is stopped or the cluster cannot be reached. - Auto-refresh: Dropdown that controls how often the page polls for new data. The default is 30 seconds.
- Open Spark UI: Opens the embedded Apache Spark UI for the selected cluster. The button is disabled when the cluster is not Running.
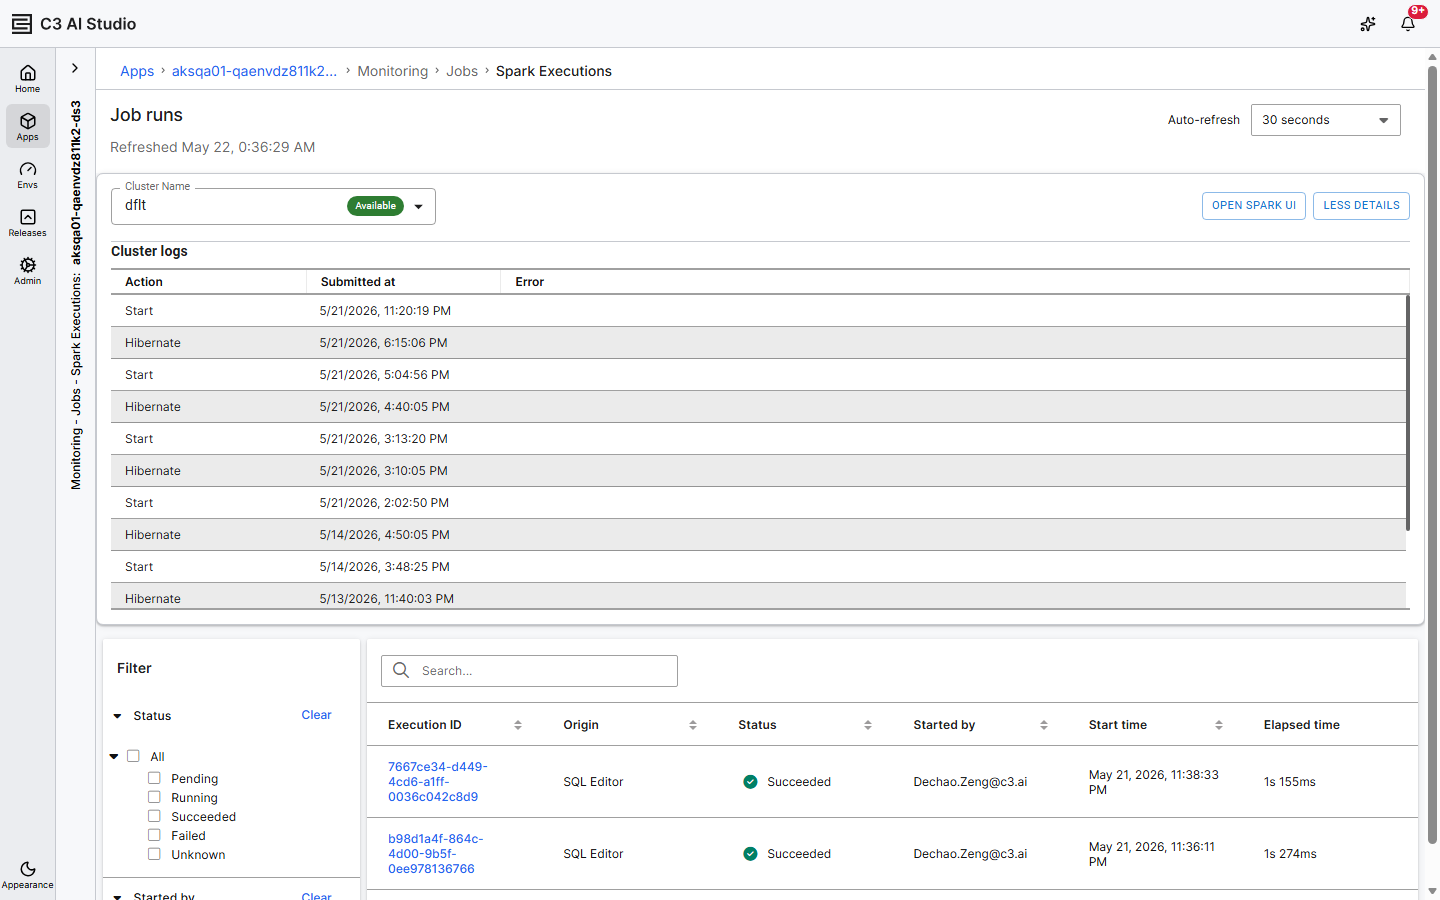
- More Details: Expands a Cluster logs grid showing Hibernate and Start events with timestamps and any error messages. Use this when investigating cold-start delay or a failed restart.
Filter panel
The left-side filter panel narrows the grid to a subset of executions.
- Status: Pending, Running, Succeeded, Failed, Unknown. An All toggle selects every status at once.
- Started by: Filter by the user who submitted the query.
- Origin: Filter by the surface the query came from. The SparkExecutionOrigin enum defines two values in 8.11:
SQL Editor(queries submitted through the SQL Editor) andSource to DataLake(writes from a Data Fusion pipeline's Load to Data Lakehouse step). Runs from a notebook are not currently tagged with an enum value. - Start time: Date range picker for the submission time.
Results grid
| Column | Description |
|---|---|
| Execution ID | Unique identifier; select to open the execution detail drawer. |
| Origin | Where the query came from. The 8.11 enum has two values: SQL Editor and Source to DataLake. |
| Status | Current state. |
| Started by | The user who submitted the query. |
| Start time | Submission time. |
| Elapsed time | Time in the queue plus time on the cluster. |
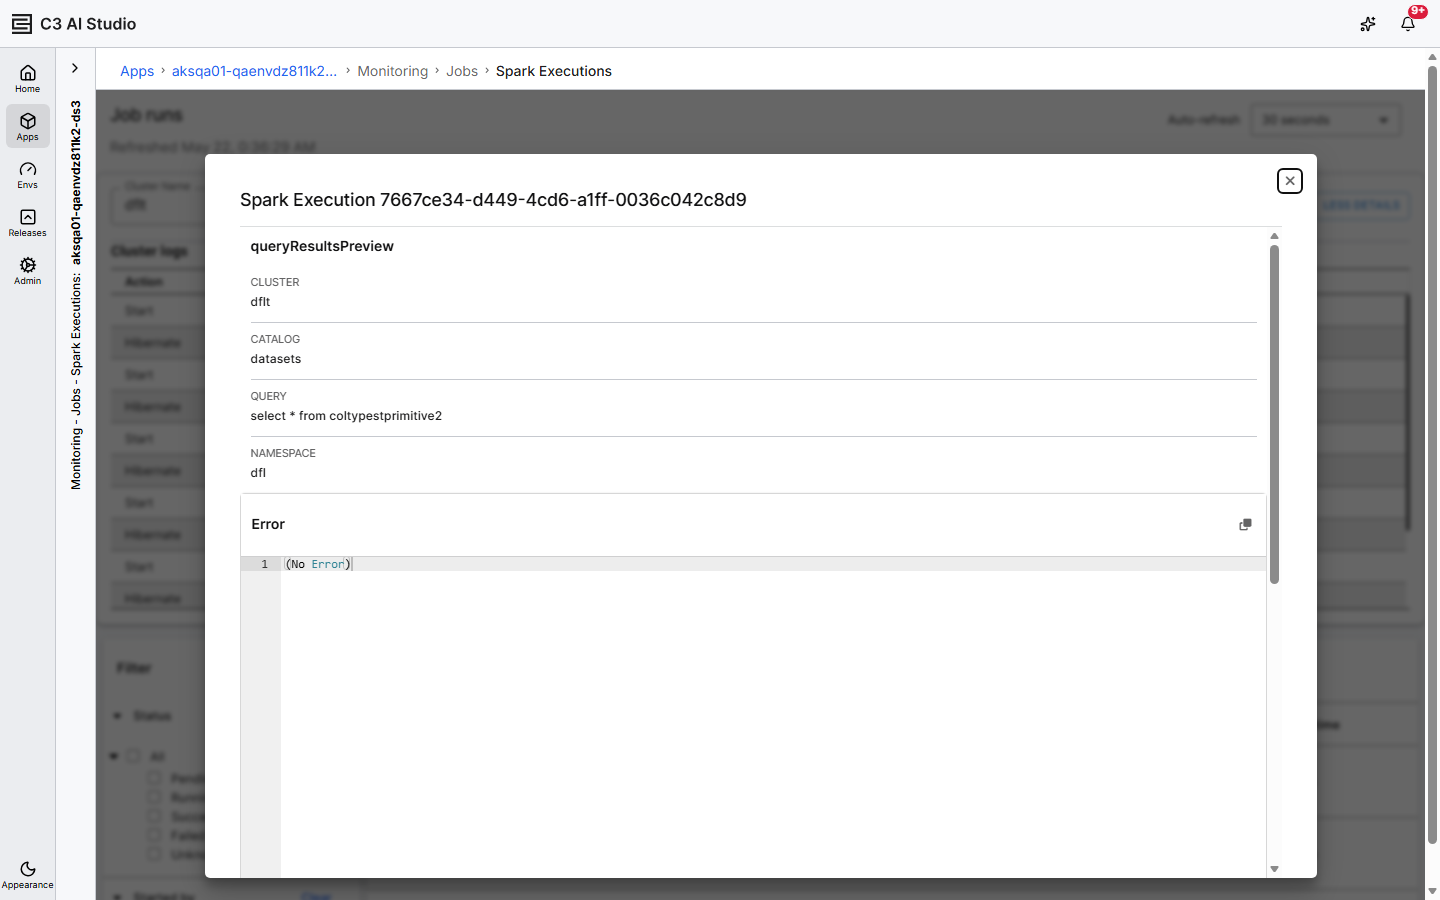
The detail drawer shows the catalog, namespace, query text, and the error message (if any). Use the drawer to copy the query for debugging or to re-run it from the SQL Editor.
First query after idle
When the selected cluster is hibernated and a query arrives, the SQL Editor displays the banner Starting Spark cluster, query response will be available shortly. The query queues until the cluster reaches the Running state. Cold start can take several minutes; subsequent queries against a warm cluster return in seconds.
From a notebook
The Spark Executions page is the primary surface for monitoring. The sections below cover the notebook-only paths: opting into per-session logging, managing the cluster lifecycle, expiring snapshots, and compacting small files. The user interface does not expose these operations directly.
Enable logging on a Data.SparkSession
When initializing a Data.SparkSession, set enableLogging=True to capture execution logs. All operations triggered from that session are logged into the SparkExecution type and appear on the Spark Executions page.
Queries executed directly from the SQL Editor are also fully logged. When you run an SQL query instead of using Jupyter or the Console, these actions also appear in the same log. This provides consistent traceability across every query execution path.
Example. Start a session with logging on and run a small operation:
cluster = c3.SparkCluster.inst()

ss = cluster.dataSparkSession(enableLogging=True)

spark = cluster.sparkConnectSession()ss.read_csv("gcs://c3--datasets/iris.csv").shapeThe call returns (150, 5). To see the logged execution from a notebook:
c3.SparkExecution.fetch()The fetch returns a SparkExecution row for the read; the same row is visible on the Spark Executions page in the user interface.
Manage the cluster lifecycle
Spark clusters move through three runtime states: Running (actively servicing queries), Hibernated (idle, ready to resume on demand), and Terminated (configuration removed). Choose a state with the matching API.
cluster = c3.SparkCluster.inst()
cluster.stop()           # hibernate; preserves config and warm state
cluster.terminate(True)  # drop config; full clean-up
cluster.status             # current state
cluster.idleTimeMillis()   # time since the last activity
For Grafana metrics, the service id is the lookup key:
cluster.serviceId()Paste the returned id into the Spark Grafana dashboard to view detailed cluster metrics.
The platform seeds a cron job, spark-clean-idle-cluster, that can hibernate idle clusters. It is inactive by default; enable it to hibernate idle clusters on a schedule. To inspect the job or change its schedule:
c3.CronJob.forId("spark-clean-idle-cluster")Expire snapshots
Snapshots accumulate as a table evolves. Use snapshot expiration to release the storage held by snapshots older than a retention window.
spec = (
    c3.DataLake.Table.ExpireSnapshotSpec.builder()
    .retentionWindow("1d")
    .minimumSnapshots(1)
    .build()
)
table.expireSnapshots(spec)
For the full snapshot lifecycle, including time-travel reads, tags, and rollback, see C3 Data Lake Snapshot Versioning and Management.
Compact small data files and remove orphans
Data-file compaction (rewrite_data_files) and orphan-file cleanup (remove_orphan_files) are not exposed through C3 AI Studio or the platform Python API in 8.11, and the Iceberg SQL procedures are not C3-supported against federated Lakehouse tables. Control storage growth through snapshot expiration above. For sustained low file counts, contact C3 AI support for the maintenance options available in your environment.