Create Code Coverage Reports in C3 AI Release Management
This topic outlines the steps to create code coverage reports through the builds on C3 AI Release Management.
Code coverage measures the amount of code tested by automated tests. These automated tests are run in a build. After running these tests, the code coverage report highlights aspects of the codebase that might require more thorough testing and instrumentation. Instrumentation tracks which lines of code are run during test execution. The code coverage reports for JavaScript server files and Python files can be generated through Release Management builds.
The C3 Agentic AI Platform currently does not support code coverage for code running in js-node. The platform supports only js-rhino and js-client.
Create a coverage report
Starting with version 8.5, The C3 Agentic AI platform supports code coverage reports in all supported language runtimes.
Although the platform supports Python code coverage in Java Embedded Python (JEP) runtime, interactions between the Python code coverage tool and some third party libraries might cause test failures. C3 AI recommends that you only enable JEP code coverage on a branch that already passes tests and only use the results of the code coverage report.
You can toggle code-coverage reports by setting the following Branch or Build Config keys as shown in Register, Update, and Delete a Group of Branches:
- enablePythonCoverage
- enableJepCoverage
- enableC3UiCoverage
- enableJsServerCoverage
The default values for these config keys are false, and you must opt in by setting these config values to true in order to generate coverage reports individually for their desired runtimes.
Each package should have its own CodeCoverageInstrumentationSpec which specifies the files that are excluded from instrumentation. You can create a JSON file in the metadata/CodeCoverageInstrumentationSpec folder in the package to add the files that should be excluded from instrumentation. The contents of the JSON file should look like as follows:
{
  "id": "spec1",
  "excludePaths": [".*/test/.*", ".*/metadata/.*", ".*/ui/.*"]
}| Field | Description |
|---|---|
id | The unique ID for the spec. |
excludePaths | Within an array, enter a regex expression for files that should be excluded from instrumentation. The ".*/test/.*", ".*/metadata/*", ".*/ui/.*" means that the files in the test, metadata, and ui folder are excluded from instrumentation. |
Consider excluding files in a test folder since the tests themselves should not be instrumented. Even files that help with running the test may cause heavy decreases in performance and possibly test failures if they are instrumented. Furthermore, any UI files should be excluded since they should be instrumented during UI bundling in a separate process.
Note: If you're using the UI Framework, the excludePaths configuration will not be applied to UI files. UI files (.tsx and .ts extensions) are handled separately and will always be processed for coverage regardless of the excludePaths setting.
To create code coverage:
- Add the files that should be excluded from instrumentation by updating related files in the
metadata/CodeCoverageInstrumentationSpecfolder in the package. - Set desired code-coverage configs in your branch group config or build config.
- Create a build through C3 AI Release Management.
See also Trigger a Build Manually in C3 AI Release Management.
Example exclusion JSON file
The excludePaths field in the CodeCoverageInstrumentationSpec must include a path relative to the src directory of your root package.
For example, if you have a file /baseCodeAnalyzer/src/metrics/deprecation/DeprecatedTypeUsage.js-node.js, and would like to exclude it from instrumentation in the baseCodeAnalyzer package, you should set up your exclusion file like so:
{
  "id": "baseCodeAnalyzer",
  "excludePaths": [".*/metrics/deprecation/DeprecatedTypeUsage.js-node.js"]
}
The .* in the file path is necessary because the path is relative to baseCodeAnalyzer/src.
Ignore js-node files in coverage reports
When using custom runtimes that execute JavaScript in js-node without the Type System loaded, it is recommended to exclude these files from instrumentation. This exclusion helps ensure accurate results and avoids performance degradation caused by unnecessary instrumentation.
To exclude specific js-node files, you can add their paths to the excludePaths field in the CodeCoverageInstrumentationSpec. For example, if you have two JavaScript files—one running in js-node and the other in js-rhino—and you want to exclude only the js-node file, the configuration should look like this:
{
  "id": "customRuntimeExample",
  "excludePaths": [".*/nodeRuntimeFile.js-node.js"]
}
In this example, the file nodeRuntimeFile.js-node.js is excluded from instrumentation, ensuring that only the file executed in js-rhino is covered.
Download coverage reports
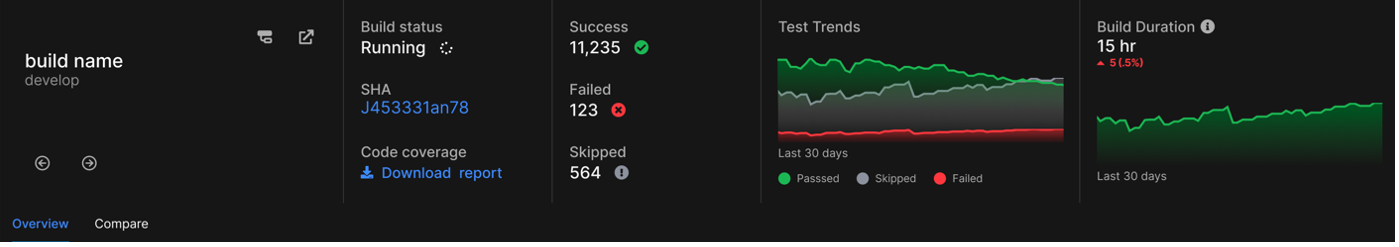
After the build is complete, the reports can be downloaded in a ZIP by navigating to the C3 AI Release Management build page and clicking Download report under "Code coverage" in the second tile. A status such as "Report unavailable" or "Generating report" might mean the build is not finished.
 |
|---|
| Download report from build page |
In the unzipped folder, there should be one JSON file named coverage-summary.json that lists each of the files in the package and their respective coverage as numbers for lines concerning functions, statements, and branches. The coverage-summary.json file content can look like the following:
{
"total": {
"lines": {
"total": 463,
"covered": 389,
"skipped": 0,
"pct": 84.01
},
"statements": {
"total": 464,
"covered": 389,
"skipped": 0,
"pct": 83.83
},
"functions": {
"total": 22,
"covered": 20,
"skipped": 0,
"pct": 90.9
},
"branches": {
"total": 52,
"covered": 43,
"skipped": 0,
"pct": 82.69
},
"branchesTrue": {
"total": 0,
"covered": 0,
"skipped": 0,
"pct": 100
}
},
"testPackage/src/testFile.js": {
"lines": {
"total": 11,
"covered": 10,
"skipped": 0,
"pct": 90.9
},
"functions": {
"total": 3,
"covered": 3,
"skipped": 0,
"pct": 100
},
"statements": {
"total": 11,
"covered": 10,
"skipped": 0,
"pct": 90.9
},
"branches": {
"total": 6,
"covered": 4,
"skipped": 0,
"pct": 66.66
}
},
"testPackage/src/testFile.py": {
"lines": {
"total": 29,
"covered": 16,
"skipped": 0,
"pct": 55.17
},
"functions": {
"total": 0,
"covered": 0,
"skipped": 0,
"pct": 100
},
"statements": {
"total": 29,
"covered": 16,
"skipped": 0,
"pct": 55.17
},
"branches": {
"total": 0,
"covered": 0,
"skipped": 0,
"pct": 100
}
}
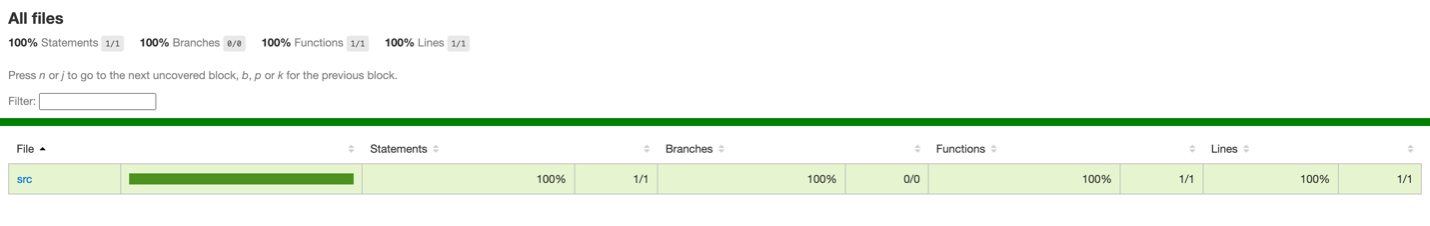
}Alternatively, open the "index.html" file inside the "lcov-report" folder in the web browser.
 |
|---|
| Index file opened as a web page for coverage report |
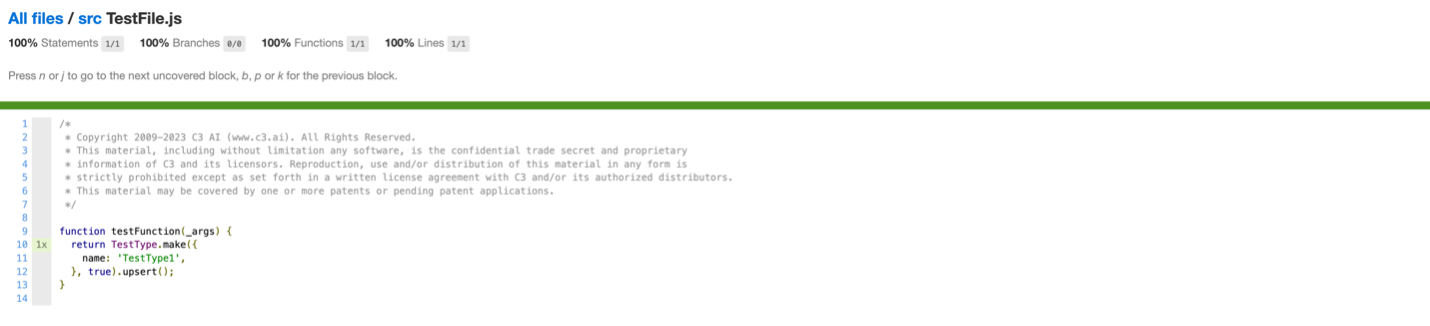
From this page, one can navigate to different folders, sub-folders, and individual files. The page shows which parts were examined during testing and indicates the number of times the line of code ran during the entire test execution for the package.
 |
|---|
| Individual file page of coverage report |