My Usage
Each agent in C3 Intelligence, the AI assistant that writes and runs the code for one type of task, uses an AI model, and the model's work is measured in tokens. A token is a unit of text that a model reads or writes. You can see your token use in two places. The Resources popover in the header shows the tokens that the conversation you are in has used so far. The Usage & Consumption page shows your token use and compute time across conversations over the last 7, 30, or 90 days.
The popover and the page read their figures from the agent service, OpenHands, which runs each agent in a sandbox, an isolated computing environment. The service records the tokens of every agent sandbox. The popover adds up one conversation, and the page adds up a time window, so use the popover for the conversation you are in and the page for your use over time.
Open the Usage and Consumption page
Select Usage & Consumption, the bar chart icon in the sidebar footer:
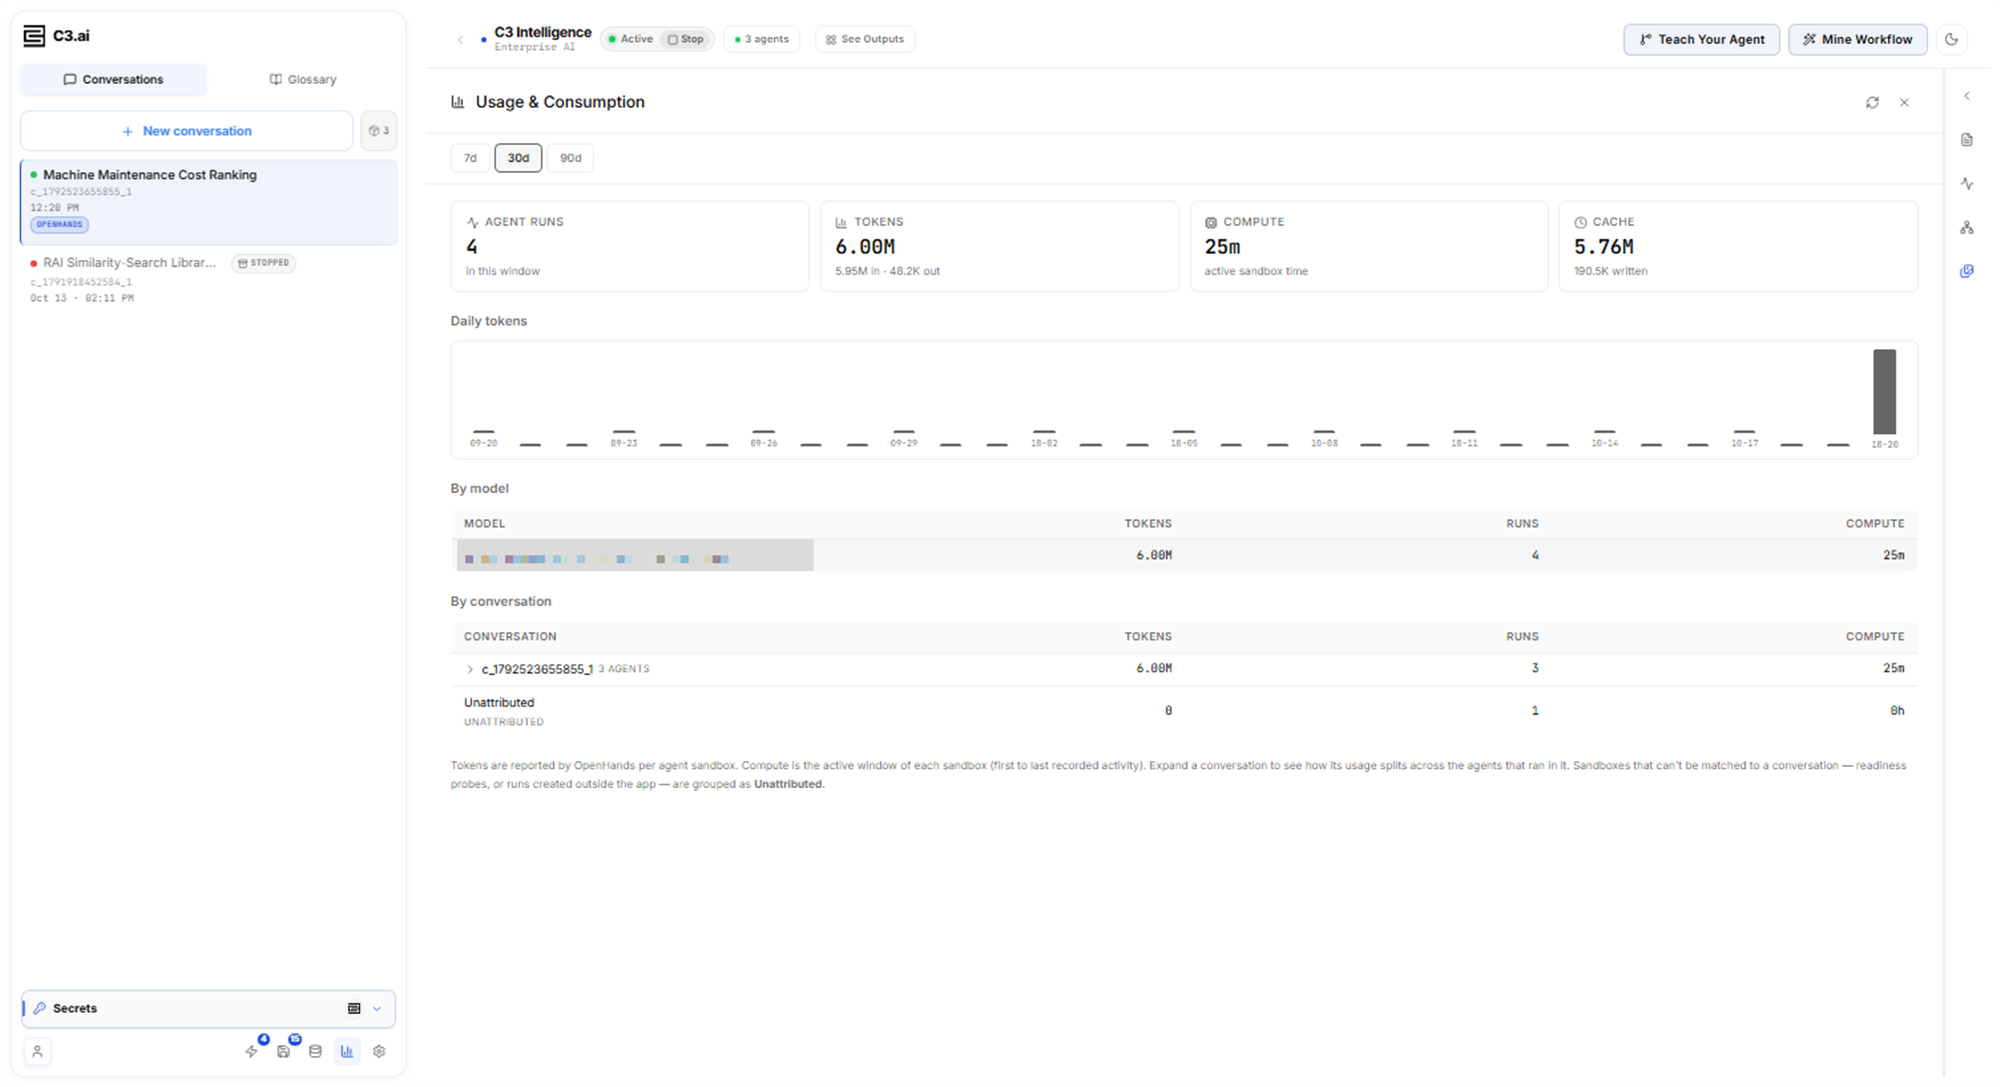
The page shows your own usage only.
Time range
Select 7d, 30d, or 90d to set the window to the last 7, 30, or 90 days. The page counts each agent sandbox whose start falls inside the window. Select Refresh to read the figures again.
An administrator can also see two tabs, My usage and All users. All users shows the usage of every user in the organization, with an extra By user table. Other users do not see the tabs.
Totals
The page shows four totals:
- AGENT RUNS: the agent sandboxes that started in the window, where one run is one agent sandbox.
- TOKENS: the tokens the models read and wrote. The line under it splits them into in, the tokens read, and out, the tokens written.
- COMPUTE: the active sandbox time, measured for each sandbox from its first to its last recorded activity. Under one minute shows as <1m.
- CACHE: tokens the models read again from a cache instead of processing them in full. The line under it gives the tokens written to the cache.
CACHE counts cache tokens on their own, apart from the TOKENS total.
Daily tokens
The Daily tokens chart shows, for each day in the window, the tokens of the sandboxes that started that day.
Breakdown tables
Two tables split the totals, each with TOKENS, RUNS, and COMPUTE columns:
- By model: one row for each AI model the agents used.
- By conversation: one row for each conversation, labeled with its conversation ID. Expand a row to see how its usage splits across the agents that ran in it.
C3 Intelligence matches each sandbox to the conversation that started it. Sandboxes it cannot match form the Unattributed row. A note on the page names two sources of such sandboxes: readiness probes, which are the service's own checks, and runs created outside the app.
Messages on the page
In these cases, you see a message instead of figures:
- No usage in this window: no agent sandbox started in the window. Select a longer range.
- Couldn't read this usage report. Try refreshing.: the reply had no figures to show. Select Refresh.
- The configured agent backend doesn't report usage.: your deployment runs its agents on a backend that gives this page no usage figures.
A banner over the totals means the figures are incomplete, for example because some records could not be read. The banner text names the cause, and the totals are then a lower bound.
The Resources popover
The agent count in the conversation header, such as 3 agents, opens the Resources popover for the conversation you are in:
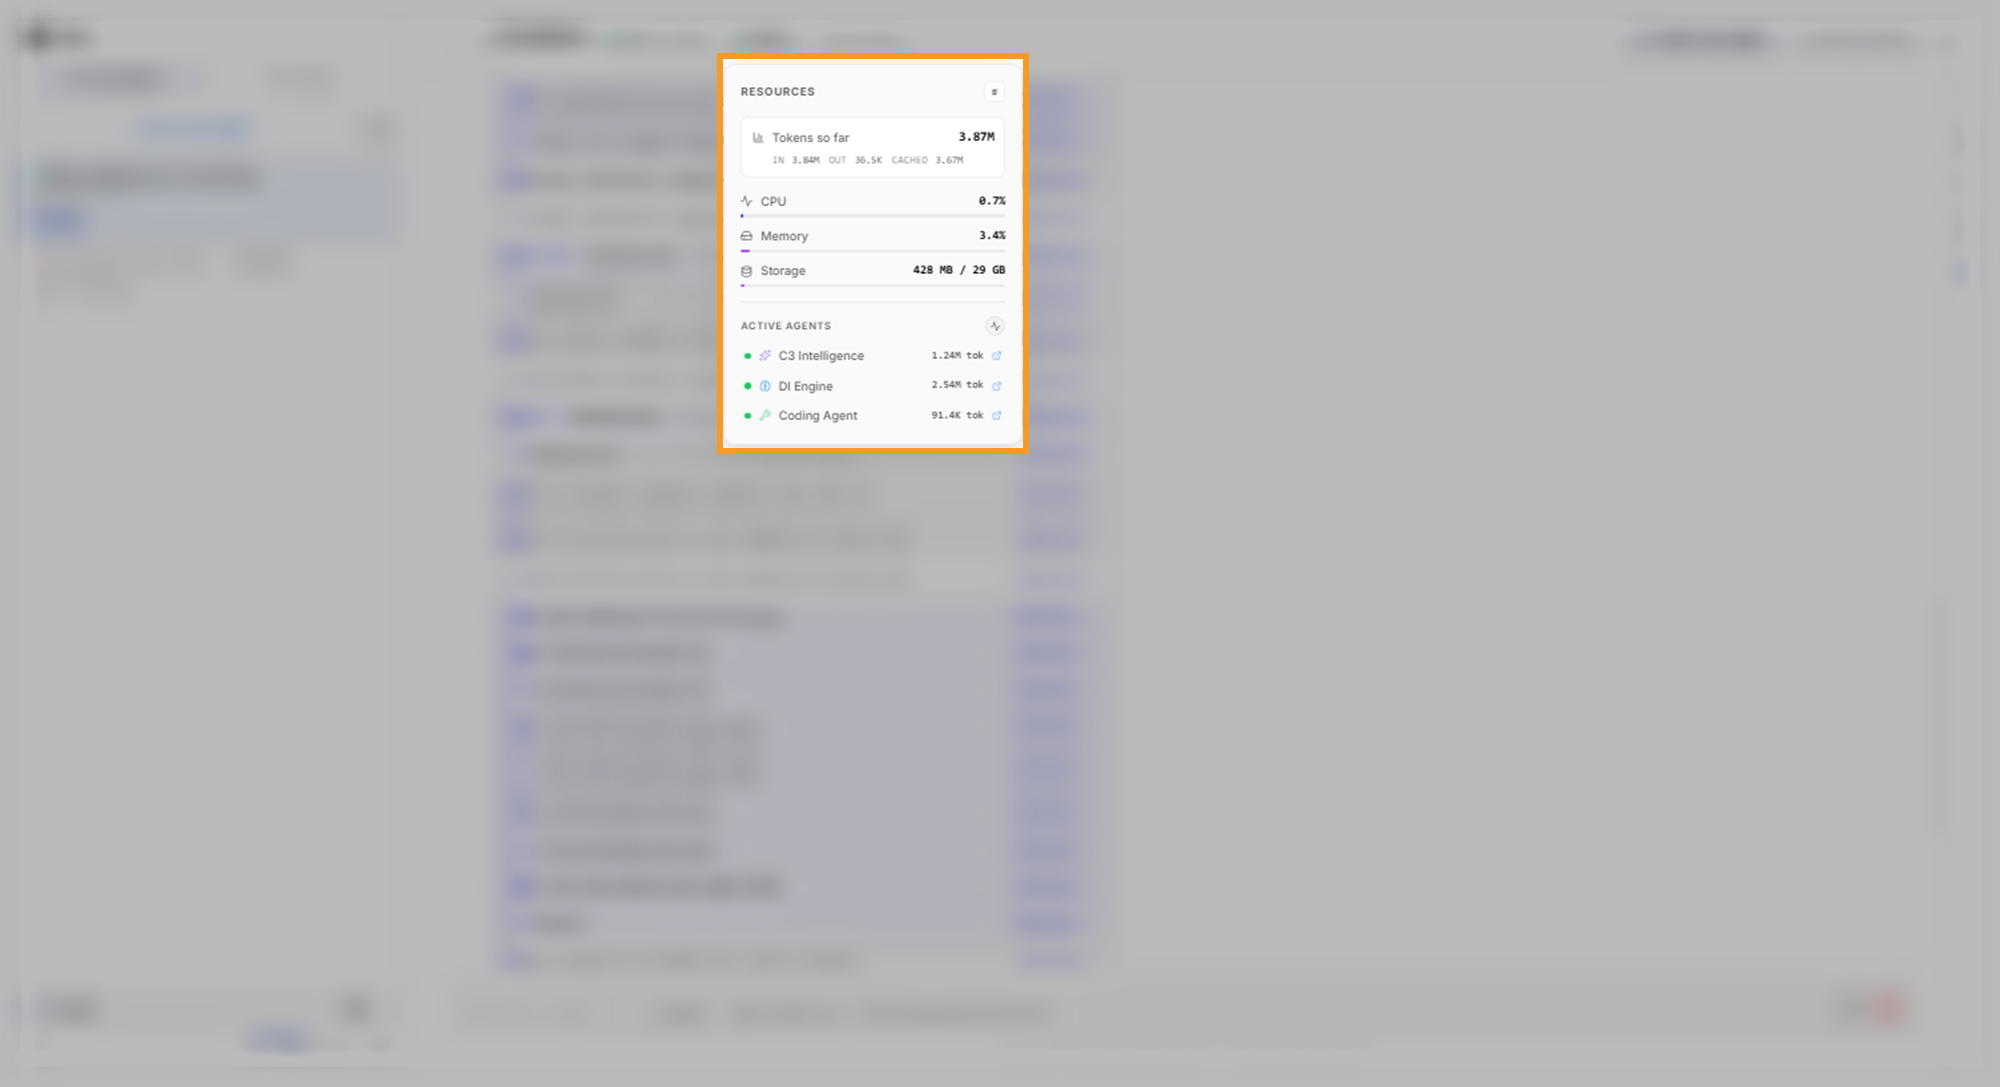
The popover has these regions:
- # or %: switches CPU and Memory between raw values and percentages.
- Tokens so far: the tokens of every agent sandbox in this conversation, since the conversation started, with IN and OUT under it, plus CACHED when the models read from a cache. The popover reads it again every 20 seconds while it is open.
- CPU, Memory, and Storage: what the conversation's sandboxes use at this moment. CPU and memory change with every reading, every few seconds.
- ACTIVE AGENTS: each agent in the conversation with its own tokens. An agent whose sandbox has stopped shows Stopped. When your deployment shows links to the agent service, each agent opens its own sandbox there.
Tokens so far is a lower bound when the popover shows Partial — some agent sandboxes couldn't be read.
To learn what makes a conversation use more tokens, such as the number of agents it brings in, see Conversation Features.
How the popover and the page differ
The popover and the page read the agent service in different ways, so their figures can differ:
- The popover reads the sandboxes that C3 Intelligence recorded for this conversation, and adds their tokens over the whole life of the conversation.
- The page asks the agent service for every one of your sandboxes that started in the window. It then groups them by the conversation C3 Intelligence matches them to.
For the tokens of the conversation you are in, read the popover. For your use across conversations and days, read the page.