Monitor Usage and Cost
Once a team is chatting with agents regularly, you can't answer "how much is this costing us, and is it working well?" just by asking around. Monitor is the team-wide dashboard that answers it: tokens, spend, and performance across every agent, application, and user, aggregated live so the numbers are always current.
Monitor is the administrator's view across everyone. For your own activity, My Usage is a simpler page open to any user.
Read the dashboard
Open Monitor from the left navigation. Monitor sits in the Operate section, but it is an administrator page: Agentix.AgentAdmin or a platform administrator gates it.
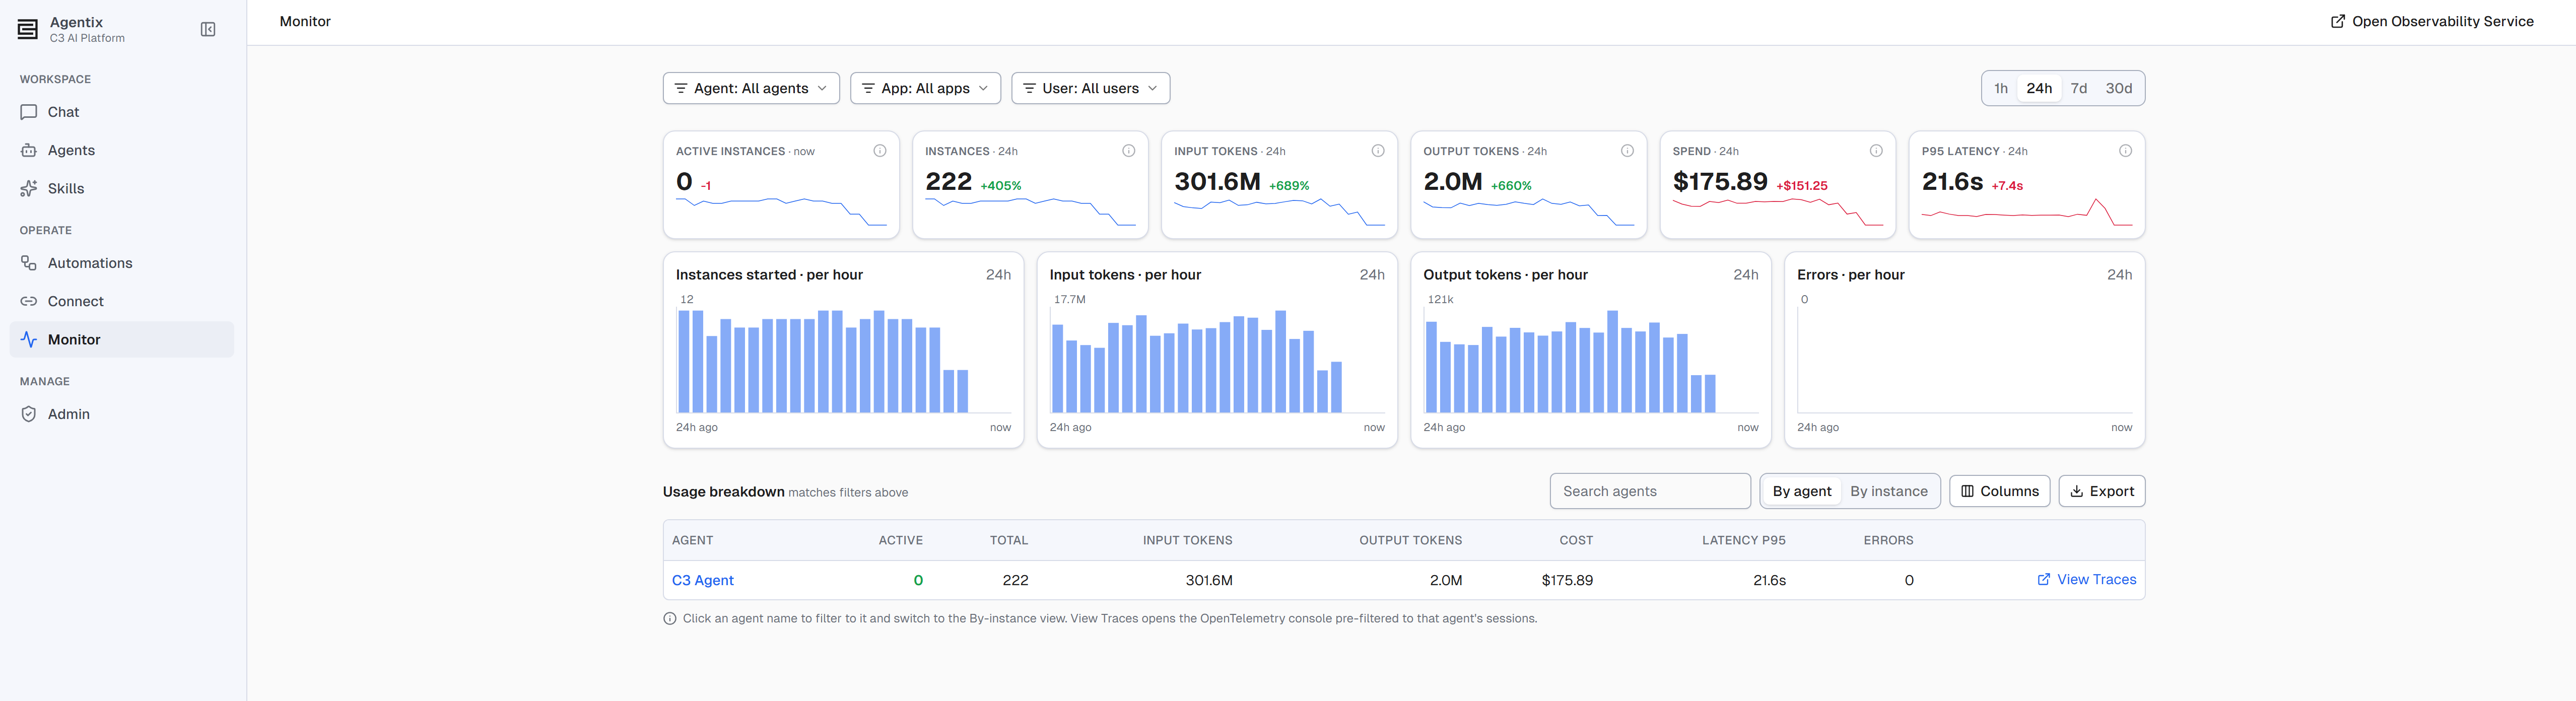
- Filter and scope the whole page by agent, app, or user, over a window of 1h / 24h / 7d / 30d. Narrowing to one agent or one window is usually the fastest way to confirm a hunch; Clear resets every filter at once.
- Six KPIs sit across the top: active instances, instances, input tokens, output tokens, spend, and P95 latency. Each shows a delta against the prior window and a sparkline. Active instances is the one exception: a live, point-in-time count, labeled "now," not the selected window. Its delta reflects how that count has moved, not a trend over the window like the other five. Spend and P95 latency always use the same warning color, whichever way they moved, so a fall draws your eye as much as a rise.
- Trend charts show instances started, input tokens, output tokens, and errors as time series. The bucket size adapts to the window you've picked — five-minute buckets at 1h, hourly at 24h, daily at 7d and 30d. That lets you tell whether a KPI's current value is a blip or part of a pattern. Hover a bar for its exact value and timestamp.
Break usage down
A spend trend can climb faster than usage explains. Filter Monitor by application to find the one agent behind most of the increase. Then switch the breakdown table to By instance to see which user's sessions are driving it. A tool call retrying repeatedly against a flaky endpoint, burning tokens on every retry, is a common cause.
A breakdown table splits the same window into rows, in either of two views:
- By agent: one row per agent — how many of its instances are currently active, its total instances, tokens, cost, P95 latency, and errors over the window. Select an agent's name to filter the page to it and jump straight to By instance.
- By instance: one row per agent × user pairing — user, agent, the apps it ran against, whether it's currently Active or Idle, and the same tokens/cost/latency/errors columns.
A search box filters within whichever view is active. Columns lets you show or hide any column except each view's identity columns — Agent in the By-agent view; User and Agent together in the By-instance view. It remembers your choice per view. Export downloads a CSV of the current view's rows, for the current filters, search, and window. It always includes every column for that view, regardless of which ones you've hidden.
Drill into a single run
Every aggregate on Monitor comes from individual agent runs, and you can open the underlying traces directly. Select Open Observability Service on Monitor, or a breakdown row's View Traces link, to jump to the tracing console. Both scope it to the same time window you're viewing on Monitor. From there, narrow to the specific agent, user, or session you want.
A trace is the complete record of one agent run, one chat session, end to end. From the trace list, one row per session shows its duration, cost, and token counts. Opening a trace walks you through its full span tree:
- The session span: the run as a whole.
- Every LLM call it made, with the model used, tokens consumed, and cost.
- Every tool call, including an error status when an action failed or was denied, which is often the fastest way to find why a run failed.
- Skill-read spans, showing which skills the agent loaded during the run.
Instead of reading the tree yourself, ask Chat with trace, a built-in assistant that can summarize a run or explain why it failed.
A trace records the shape and cost of a run — what it called, how long it took, what it cost — but not the conversation itself. It doesn't capture prompt or response text. To see what people said in a session, go to Quick Start.
How far back you can look, on both Monitor and a trace, depends on the tracing backend's retention window, not on anything on this page.
Permissions
One role gates every capability on this page:
| Action | Role required |
|---|---|
| View Monitor, break usage down, export, and drill into a trace | Agentix.AgentAdmin or higher |
For the full role ladder, see Roles and Permissions.