Monitor Pipeline Execution
Unstructured Data Integration (UDI) exposes per-file processing status through two surfaces on the Data Fusion canvas: the View Run Status modal, which shows live job and queue metrics, and the Configure Runtime Parameters dialog, which lists individual files. Use the modal for at-a-glance progress and the dialog when you need to act on specific files.
The Data Integration > Monitor page shows monitoring for Structured DI pipelines only. It doesn't display UDI runs. For UDI status, open one of the two source-collection surfaces above or visit the Monitor > Workload Management > Jobs > Batch page.
View the run status
To watch a run from inside the canvas, open the source collection's Open menu (⋯) kebab and select View run status. The kebab has three actions:
- Sync source files: Runs the same sync the runtime dialog fires when it opens. Useful for triggering a background sync from the canvas without opening the dialog.
- View run status: Opens the modal described below.
- Delete: Removes the source collection and its downstream nodes.
The View Run Status modal opens with the collection name in the header.
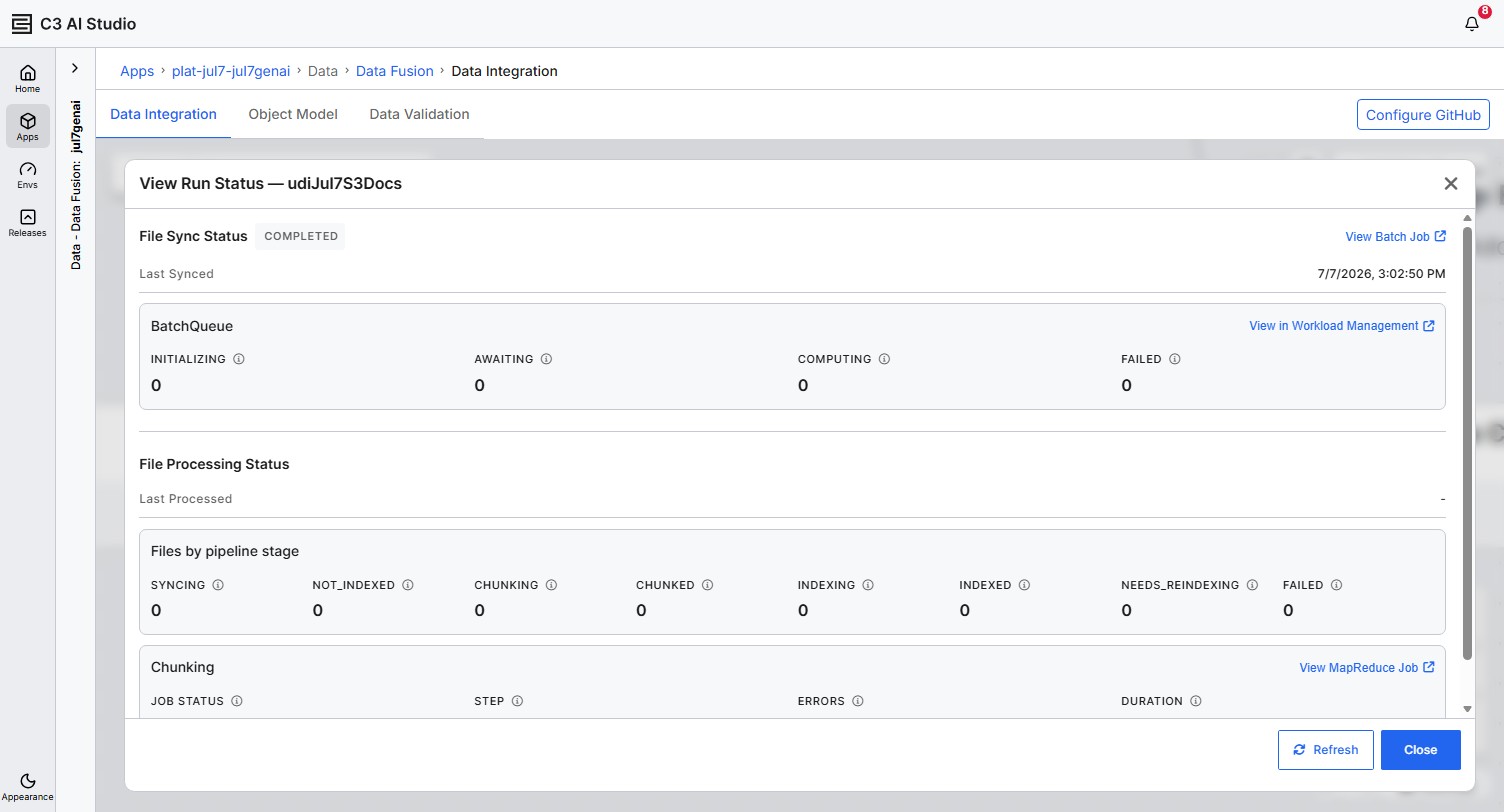
The modal has two sections by default. Active-job cards appear only while a run is in progress.
File Sync Status
Reports the inbox-to-collection sync. It shows:
- A status badge —
IDLE,RUNNING,COMPLETED,FAILED,UNKNOWN, or the underlying batch-job status. - A Last Synced timestamp.
- A View Batch Job link that opens Monitor > Workload Management > Jobs > Batch.
- A BatchQueue card with four counters — INITIALIZING, AWAITING, COMPUTING, FAILED — plus a View in Workload Management link. These counters apply to the sync batch job. Per-file processing progress appears in the Files by pipeline stage and Chunking / Indexing cards below.
File Processing Status
Reports per-file pipeline progress. It shows:
- A Last Processed timestamp. Populates when at least one file has reached
INDEXEDorFAILED; shows-before then. - A Files by pipeline stage card with one tile per status:
SYNCING,NOT_INDEXED,CHUNKING,CHUNKED,INDEXING,INDEXED,NEEDS_REINDEXING,FAILED. Hover any tile for a tooltip.
Each tile counts the files currently in that stage. A file moving forward to the next stage decrements one tile and increments the next. Files that fail settle in FAILED and stay there until you resolve the failure and re-run.
Active-run cards
Once the pipeline has run at least once, the modal adds two cards with live job metrics. The cards persist between runs and always show the most recent job:
- A Chunking card for the chunking job, with Job Status, Step, Errors, and Duration tiles plus a View MapReduce Job link.
- An Indexing card with the same tiles and link for the indexing job.
The Step value reflects the job's lifecycle phase — initial, map, reduce, and complete. Job Status values include running and succeeded.
Refresh and close
Select Refresh to re-query without leaving the modal. Select Close or the × to close.
The modal does not auto-refresh. For long runs, click Refresh periodically. For full job logs and thrown exceptions, follow the View Batch Job or View MapReduce Job link.
Open the file table
On the canvas, select the green Execute button on the source collection node. The Configure Runtime Parameters dialog opens with the file table visible. The file table has the following columns:
- File Path: The file's path within the source collection.
- Processing Status: The current state of the file.
- Size: The file size at the source.
- Last Modified: When the file last changed at the source.
- Content Encoding: The encoding the platform detected.
Processing status values
| Status | Description |
|---|---|
Not Indexed | The file is known to the collection but no embeddings exist in the vector store yet. This is the initial state for files surfaced by the first sync. |
Syncing | The platform is refreshing file metadata from the source bucket or inbox. Appears with a spinner icon. The dialog auto-syncs every time you open it, so files briefly show this status before settling. |
Chunking | The Chunker is splitting the file into chunks. |
Chunked | The Chunker finished and chunks are queued for embedding. |
Indexing | The Embedder is writing vectors to the vector store. |
Indexed | Embeddings are written to the vector store and the file is ready for retrieval. |
Needs Re-indexing | The file was previously processed but the pipeline configuration changed. The existing chunks are stale. Re-run the pipeline to refresh. |
Failed | One or more steps encountered an error. Inspect the batch job log in Monitor > Workload Management > Jobs > Batch for details. |
Processing | The file was re-added to the index through the UI. The platform hasn't yet determined whether it needs re-chunking, re-tagging, or both. |
Removing | The file is being removed from the index. |
Needs Removal | The file's source no longer exists, but its embeddings remain in the vector store. |
Archived | The file's source no longer exists and its embeddings are no longer in the vector store. |
Deleted | A user deleted the file. Deleted files cannot be indexed. |
The View Run Status modal renders these statuses in uppercase snake_case (NOT_INDEXED, SYNCING, CHUNKING, and so on). The dialog and the modal report the same underlying state.
Sync time depends on the source connector and the number of files. The dialog auto-syncs when you open it, which can take from a few seconds to over a minute on a busy environment. Wait for the spinner to clear before changing the file selection.
Filter and search files
The column header filter triggers (Size, Last Modified, Processing Status, Content Encoding) open per-column filter pickers. Use them to narrow the table to the subset you want.
To find a specific file by path, scroll the table. Large collections paginate. The default page size is 15.
Troubleshoot "Not Indexed" after a successful run
A file can end in Not Indexed even when the batch job completes without error. Common causes include:
- The document was empty or unreadable. Tiny PDFs, password-protected files, and files with no extractable text fall into this group.
- The Chunker produced zero chunks. This happens when Text Parsing, Image Parsing, and Table Parsing are all cleared, or when the document content is below the chunker's minimum size.
- The Embedder is misconfigured and returned no vectors. Verify the Embedding Model dropdown is not still set to
default (CONFIGURE ME).
To debug, open the file's source in the inbox and confirm it contains meaningful text. Adjust the Chunker preset and re-execute.
Troubleshoot "Failed"
A Failed status means a processing step raised an exception. Common causes include:
- The LLM client is unavailable or rate-limited.
- The vector store is unreachable.
- The Mew3 parser doesn't support the file format.
- The file size is above the platform's per-file limit.
Open the batch job in Monitor > Workload Management > Jobs > Batch to see the underlying error. Filter by Started by = your user.
Find the batch job for a UDI run
Every UDI run submits a batch job. Navigate to Monitor > Workload Management > Jobs > Batch. The page shows:
- A Job runs header with the last-refresh timestamp and an Auto-refresh dropdown (default
30 seconds). - A summary panel with four counters: Initial, Running, Completed Jobs, and Failed Jobs (the last two over the past seven days).
- A Filter sidebar with Job Type, Status, Started by, and Start time controls.
- A job table with these columns: Run ID, Status, Job Type, Started by, Start time, and Elapsed time.
Select the Run ID link to drill into the job's per-batch detail, including any thrown exceptions.
Save the pipeline configuration
After you verify the pipeline produces the results you want, save the configuration so the same pipeline runs on future syncs.
- Select Sync Source Collection to bring new files into the collection.
- Re-execute on All files for a full refresh, or on Select files for incremental adds.
To rebuild app dependencies when the pipeline references newly created entity Types, run the platform's Rebuild App Dependencies action.