MCP Monitor
The Monitor page displays all tool and prompt invocations your MCP server receives. Use it to verify that tools execute correctly, identify slow or failing calls, and review the arguments and results of each invocation.
Select MCP > Monitor in the left sidebar. Before any invocations appear, you must have an active connection from your IDE.
To get started, see MCP Access.
Tools tab
The Tools tab shows the invocation history for all tool calls. Each row displays the tool name, status (OK or Error), duration in seconds, the user who triggered it, and a timestamp.
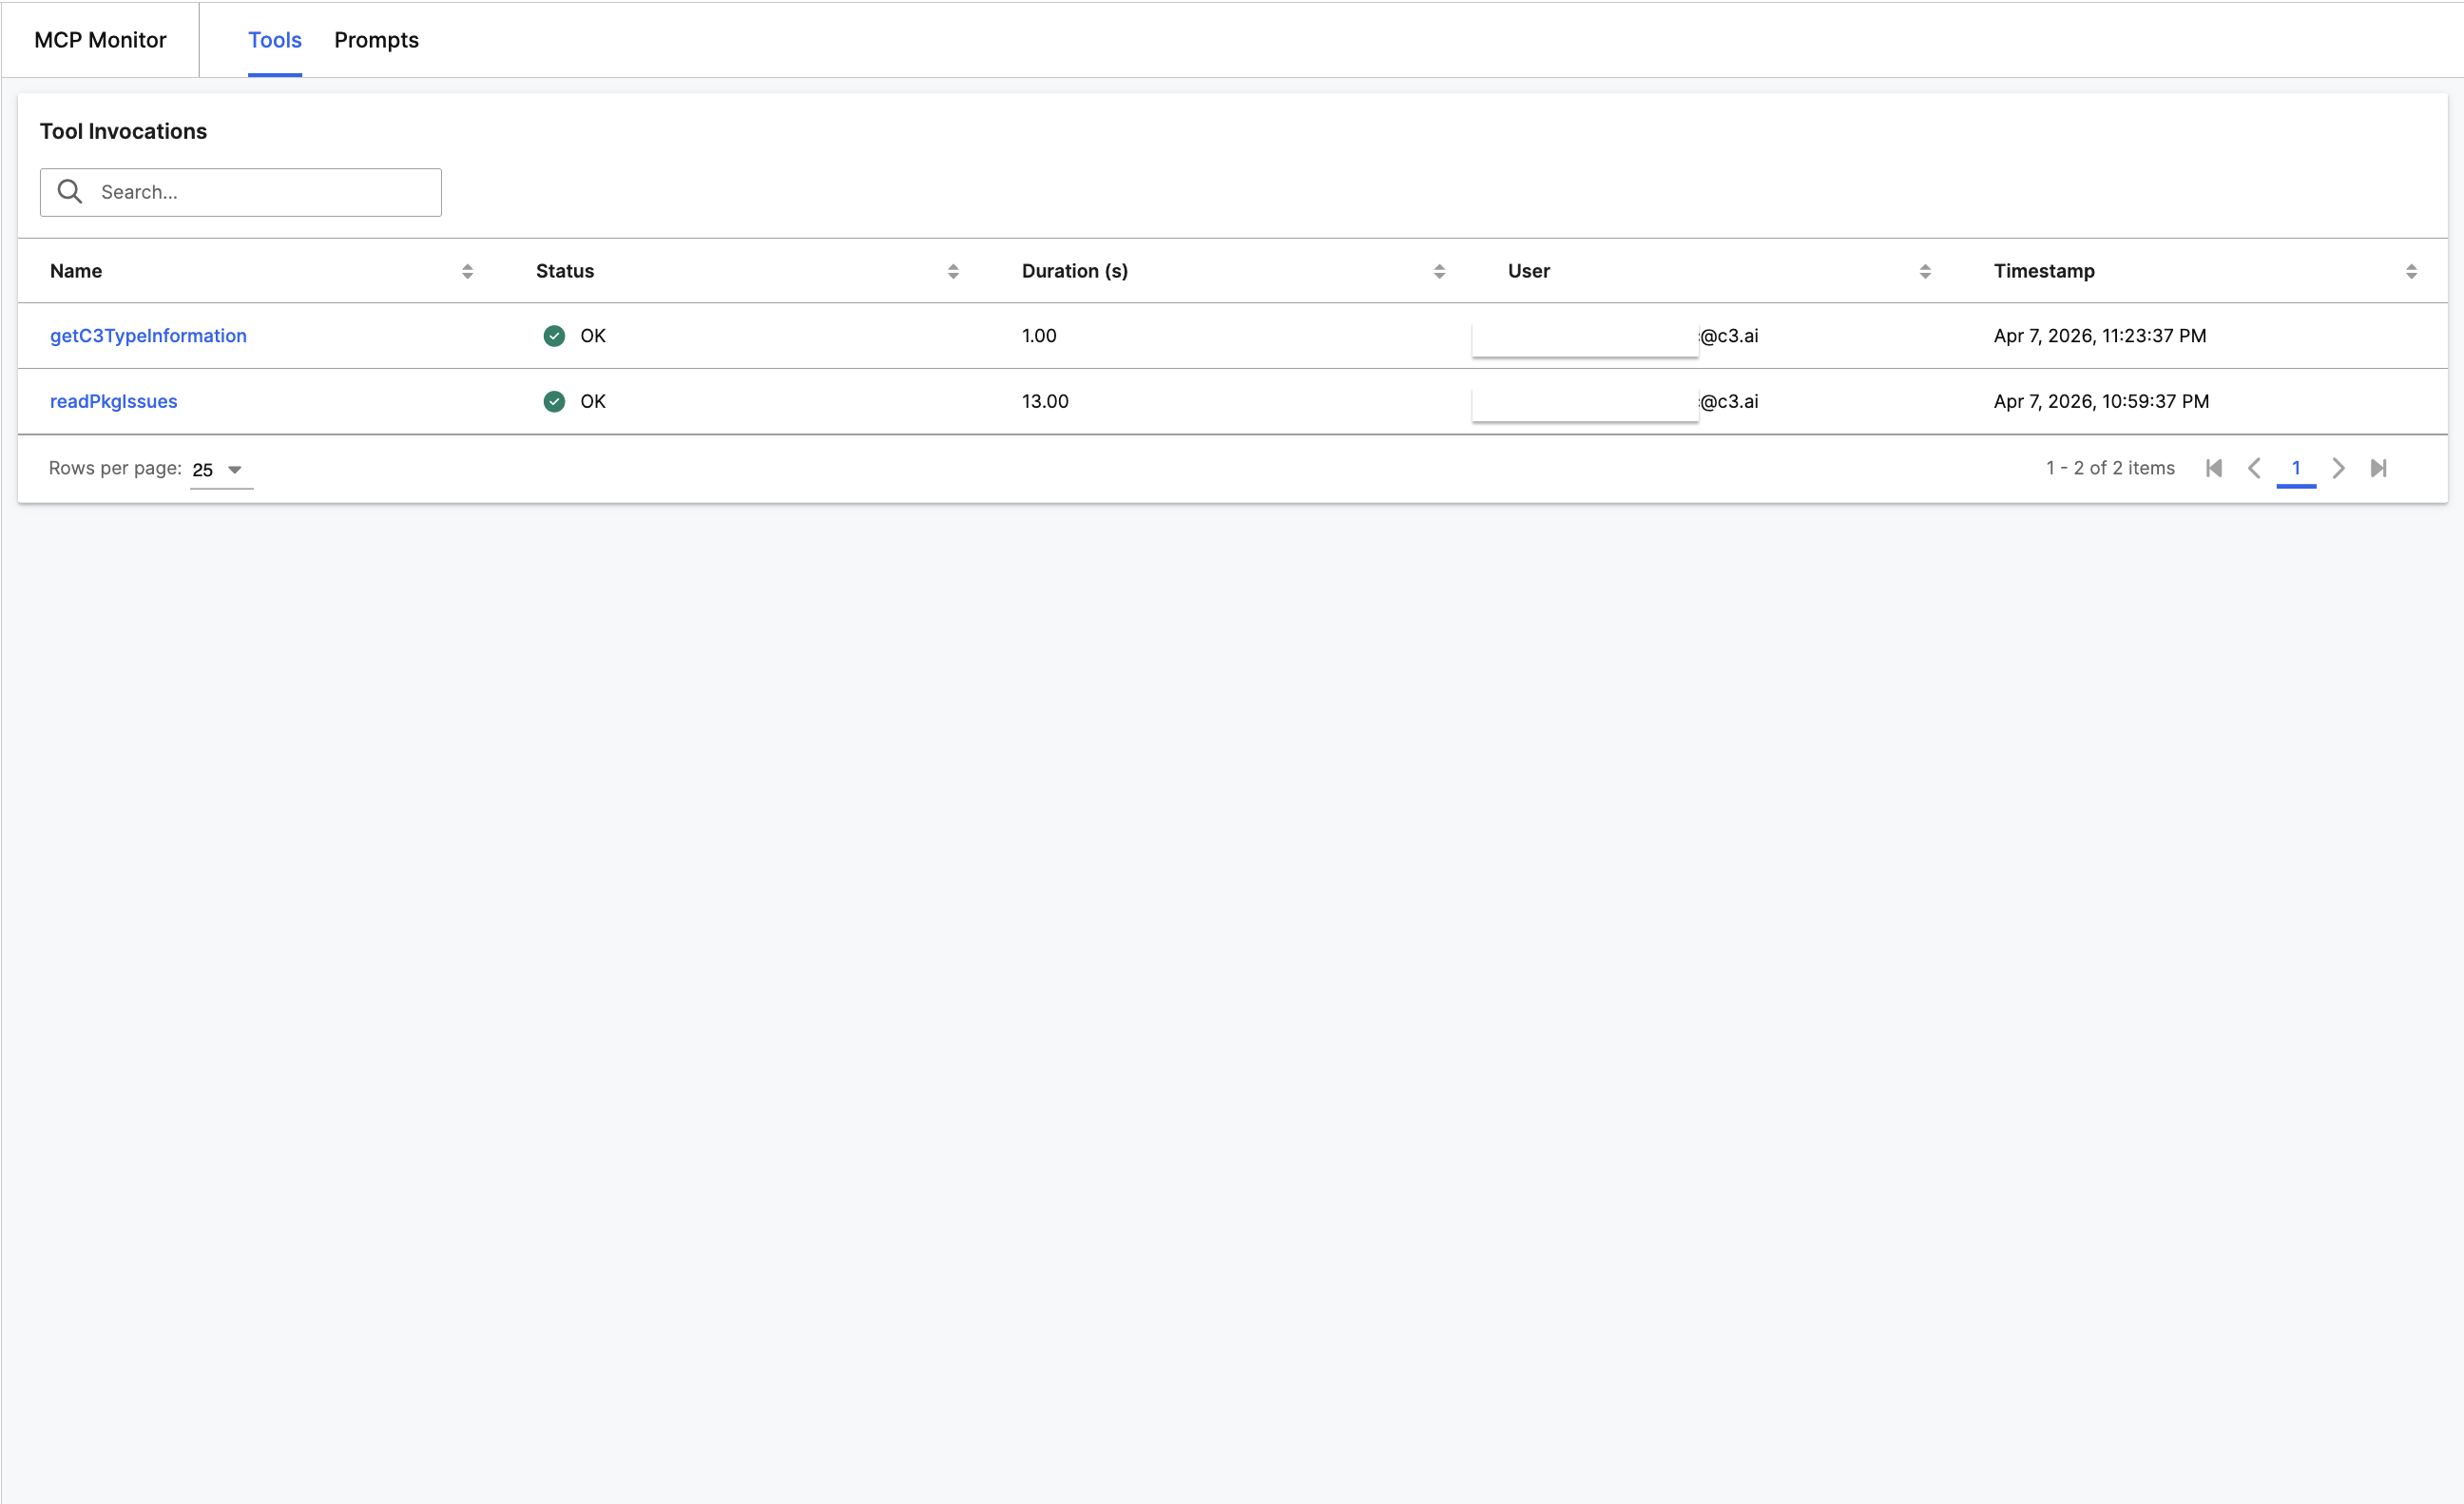
Admin users see invocations from all users. Non-admin users see only their own.
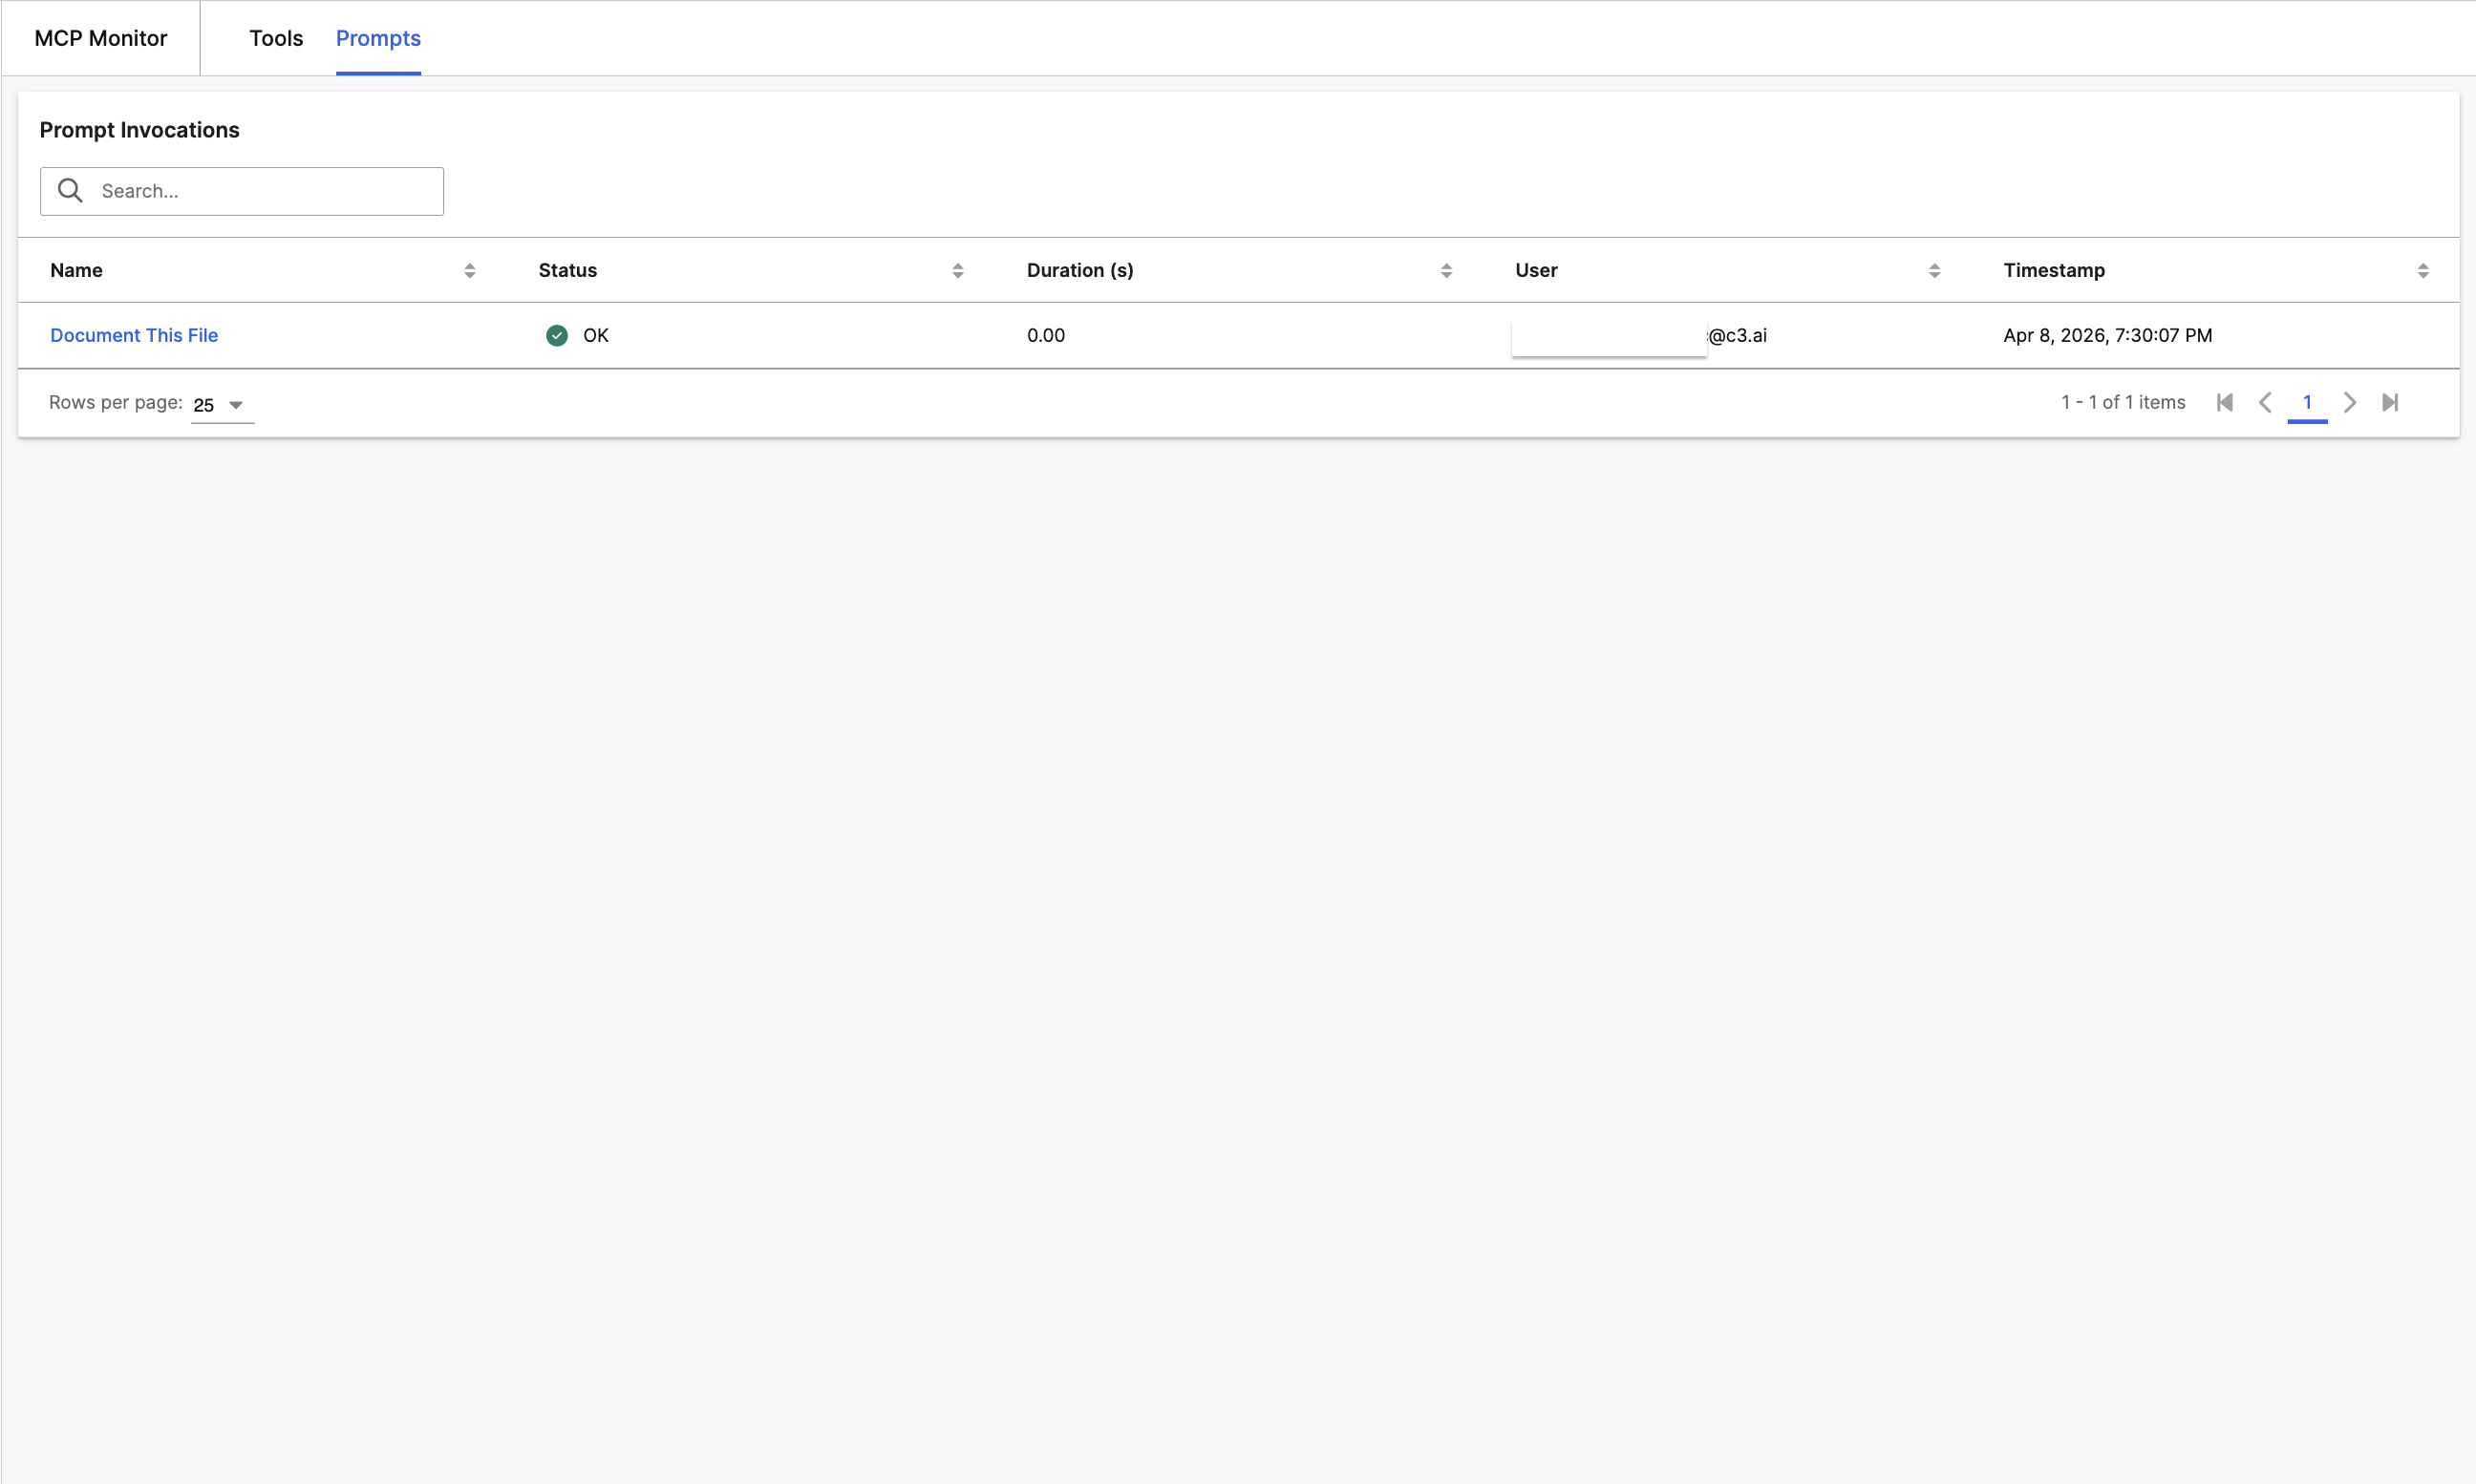
Prompts tab
The Prompts tab shows the invocation history for all prompt calls. The layout matches the Tools tab with the same columns and filtering.
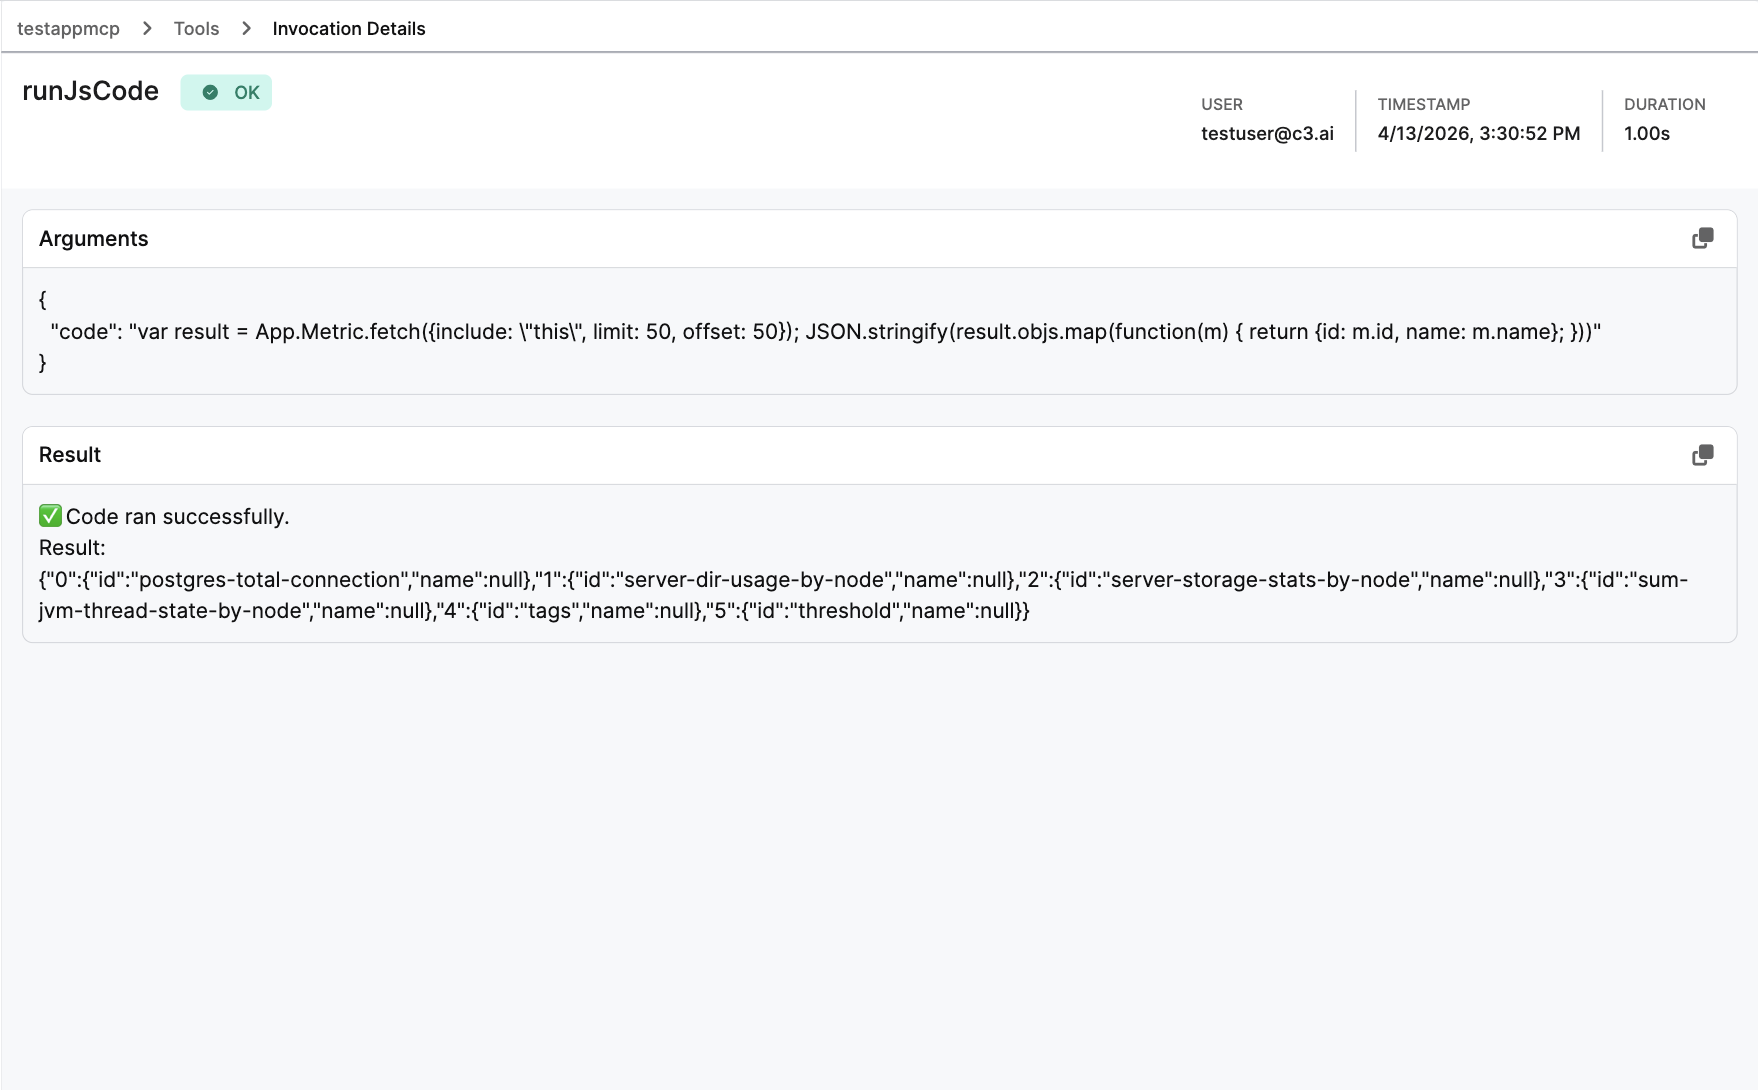
Invocation details
Select any row to open its detail page. The breadcrumb at the top shows the navigation path (for example, MCP Monitor > Tools > Invocation Details).
The detail page displays:
- Status: OK or Error, displayed next to the tool or prompt name.
- User: The account that triggered the invocation.
- Timestamp: When your application received the call.
- Duration: Total execution time.
- Arguments: The input parameters as JSON. Use the copy button to grab the payload for debugging.
- Result: The output the tool or prompt returned as text.
- Error (failed invocations only): The full stack trace.
Invocation records
Your application automatically stores each invocation as a Mcp.Invocation.Record instance. Three subtypes exist:
- Mcp.Invocation.ToolRecord for tool executions
- Mcp.Invocation.PromptRecord for prompt executions
Records capture the tool or prompt name, timing, status, arguments, result, the invoking user, and any error details. Your application scrubs sensitive data before storing it.