Monitor Your Data Pipeline
After you run a Structured Data Integration (SDI) pipeline, check that its data arrived. The Data Monitoring page in C3 AI Studio shows data volume and failed loads. You check the volume for the last seven days and find a source collection in the Source Collections grid. Then you open the collection to see the status of every file it loaded. If you build pipelines in code, you can run the same checks from the C3 AI Console. The File states section lists every state a file can show. The Data Monitoring page covers structured pipelines only. For Unstructured Data Integration (UDI) pipelines, see the Monitor an Unstructured Data Integration pipeline section.
A source collection is the set of files or messages that a pipeline reads from one source system. Each file or message in a source collection is a source object. A row is one line or entry read from a source object. The pipeline's transform maps the rows to records, and a record is an instance of the target entity Type that the pipeline creates or updates.
Prerequisites
Before you open the page, you need:
- An SDI pipeline that has run at least once. To build and run one, see Configure File Sources. For how a run works, see Data Integration End-to-End Workflow. Until a pipeline runs, the chart shows "No volume data available".
- Access to the application in C3 AI Studio with a developer or administrator role. The Data Monitoring item appears only for these roles. For the roles, see Data Integration Roles and Permissions.
Open the Data Monitoring page
Open the page from your application in C3 AI Studio:
- In C3 AI Studio, open your application.
- In the navigation pane, select Data > Data Monitoring.
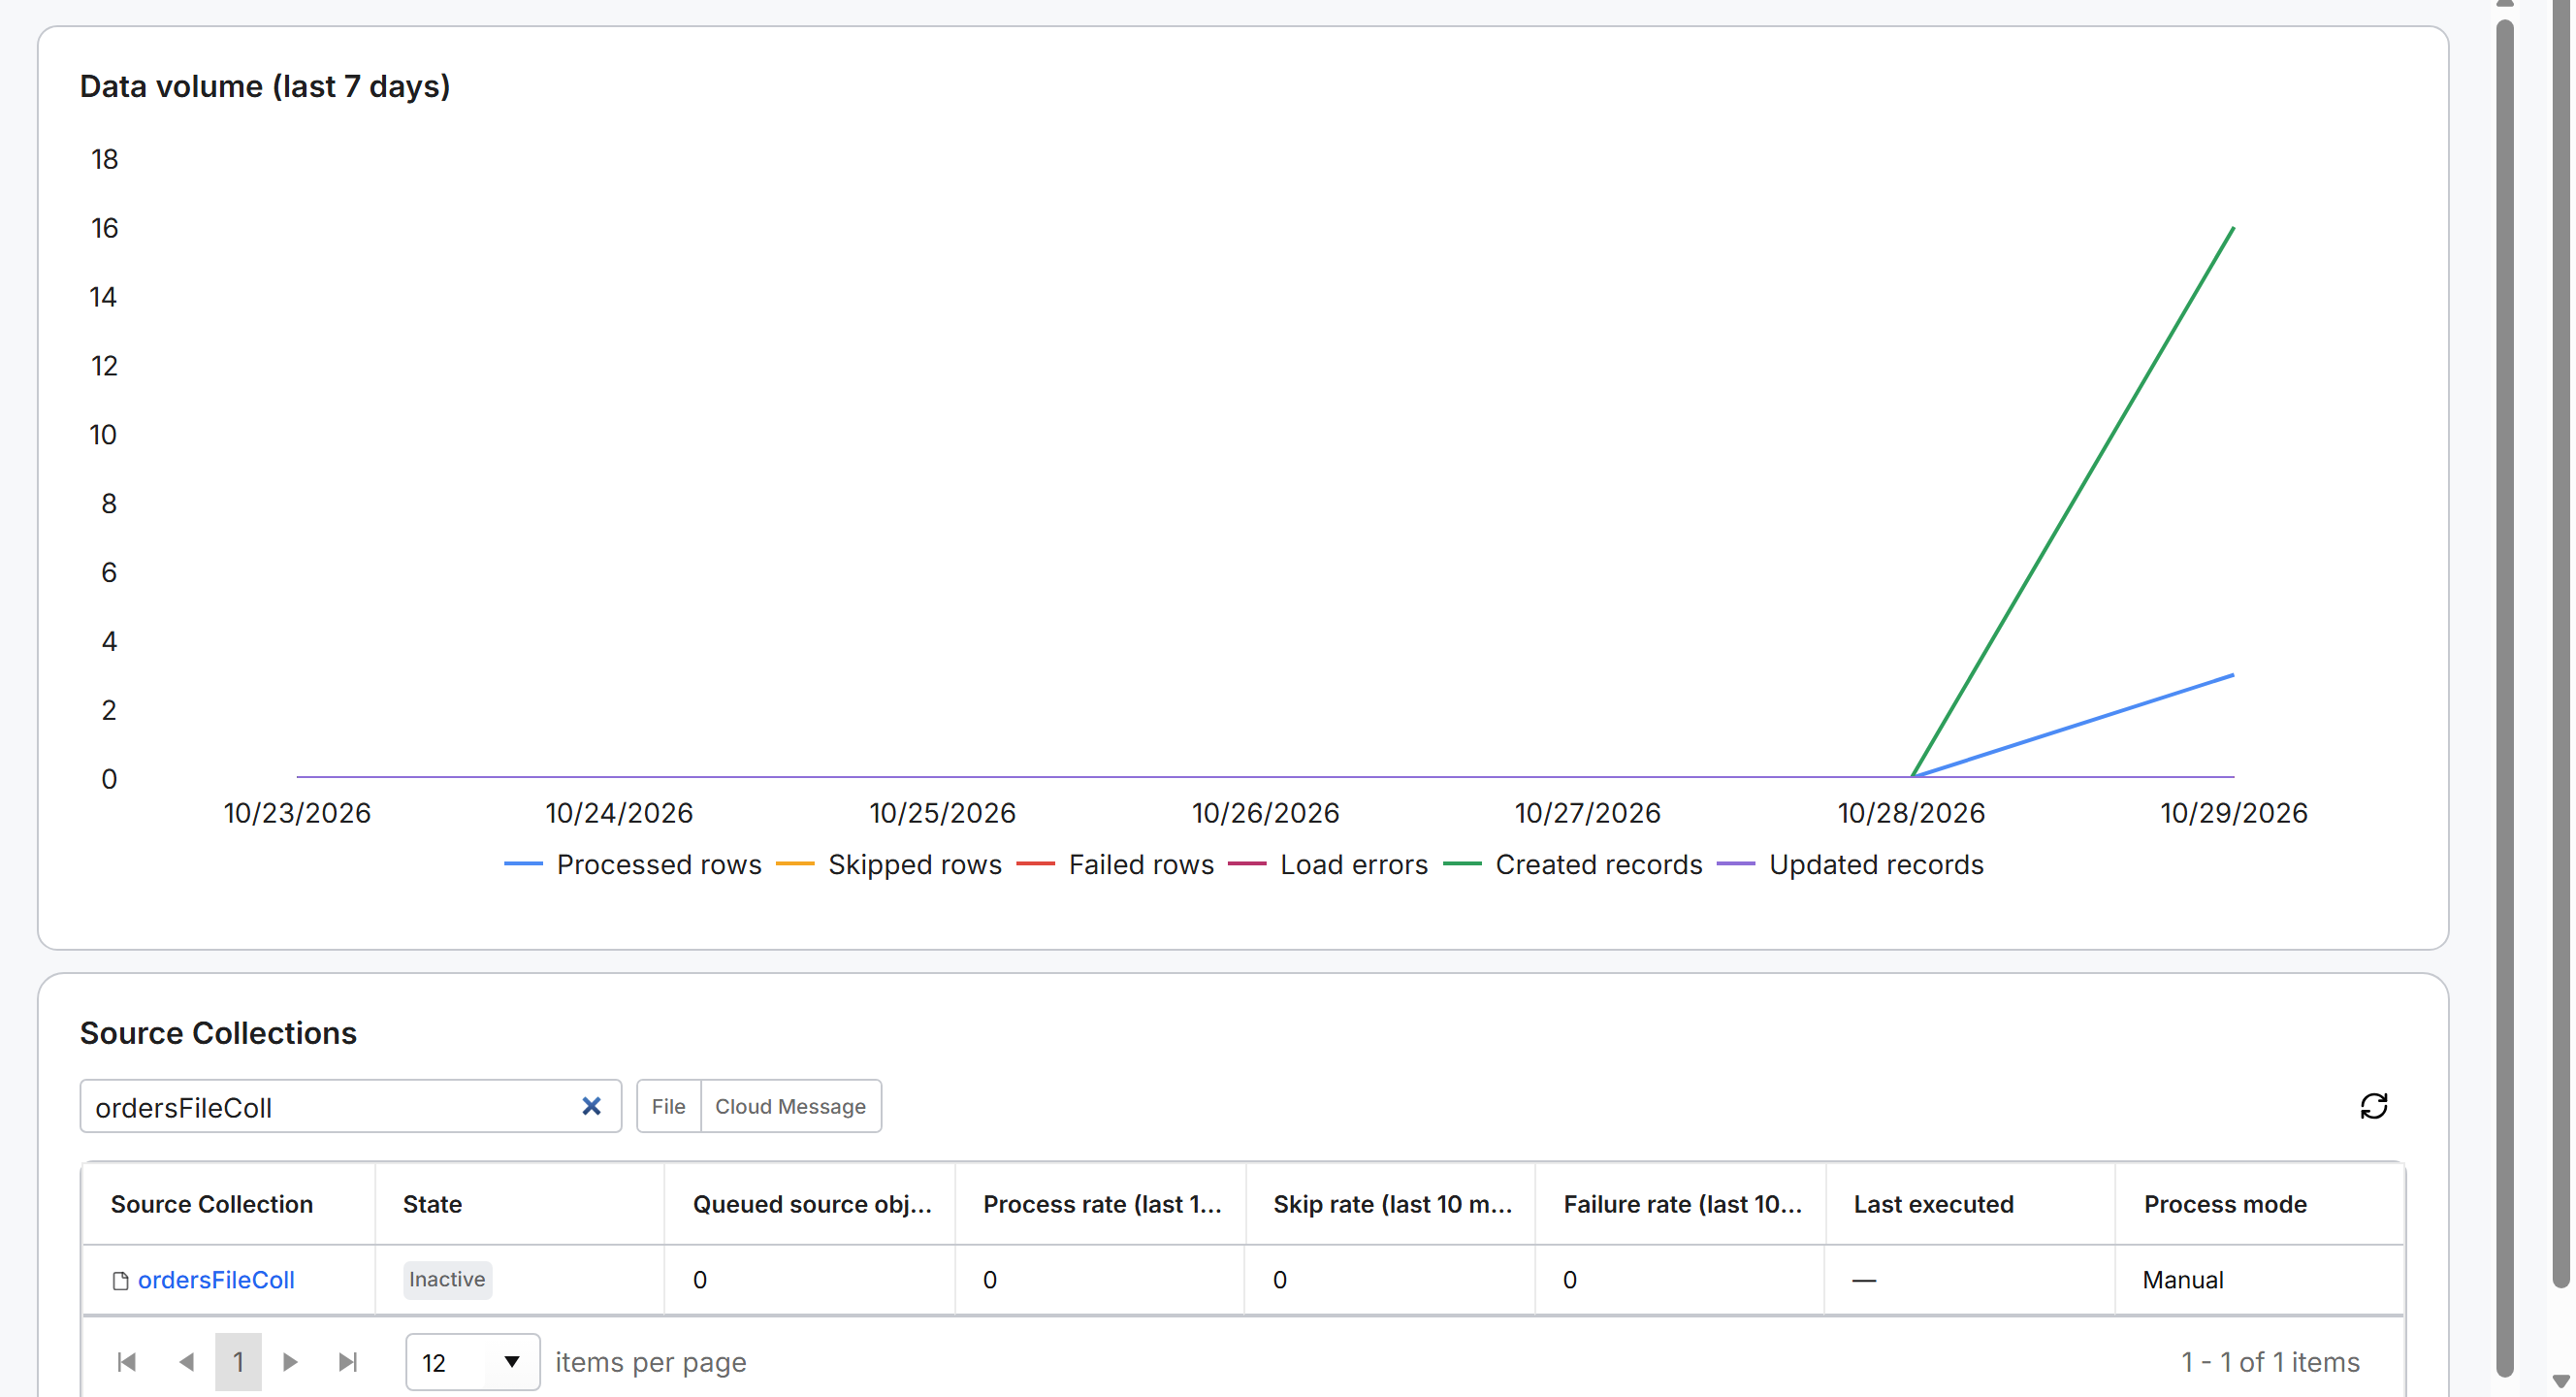
The Data Monitoring page opens with the Data volume (last 7 days) chart and the Source Collections grid.
Check data volume
Use the Data volume (last 7 days) chart to see how much data your source collections loaded each day. The chart covers all source collections in the application and plots one line for each series:
| Series | What it counts |
|---|---|
| Processed rows | Rows that passed the transform and loaded into the application. |
| Skipped rows | Rows that the transform skipped because they did not meet its filter condition. |
| Failed rows | Rows that failed processing. |
| Load errors | Source objects that failed to load or were rejected. |
| Created records | Records that the load created. |
| Updated records | Records that the load updated. |
A rise in Failed rows or Load errors tells you to check the affected source collection in the grid.
Review source collections
The Source Collections grid lists file, cloud message, and API source collections with their state and recent throughput. SQL source collections do not appear in the grid. Check SQL source collections from the Console, as described in Check a run from the Console. Narrow the grid with these controls:
- Search: enter part of a collection name.
- Category: select File or Cloud Message to show only collections of that category.
- Refresh: select the refresh button to load the latest data. The page loads data only when you open it or select refresh.
Each row in the grid shows one source collection:
| Column | Description |
|---|---|
| Source Collection | The collection name. Select it to open the collection's page. |
| State | The current state of the collection, for example Inactive. |
| Queued source objects | The number of source objects waiting to load. |
| Process rate (last 10 min) | Rows processed per second, averaged over the last 10 minutes. |
| Skip rate (last 10 min) | Rows skipped per second, averaged over the last 10 minutes. |
| Failure rate (last 10 min) | Rows failed per second, averaged over the last 10 minutes. |
| Last executed | When the collection last ran, for example just now. |
| Process mode | How the collection runs, for example Manual. |
A failure rate that rises across refreshes shows a collection that has started to fail.
Investigate failed files
Open a source collection to find the files that did not load and the errors they recorded. For a file source collection:
On the Data Monitoring page, select the collection name in the Source Collections grid.
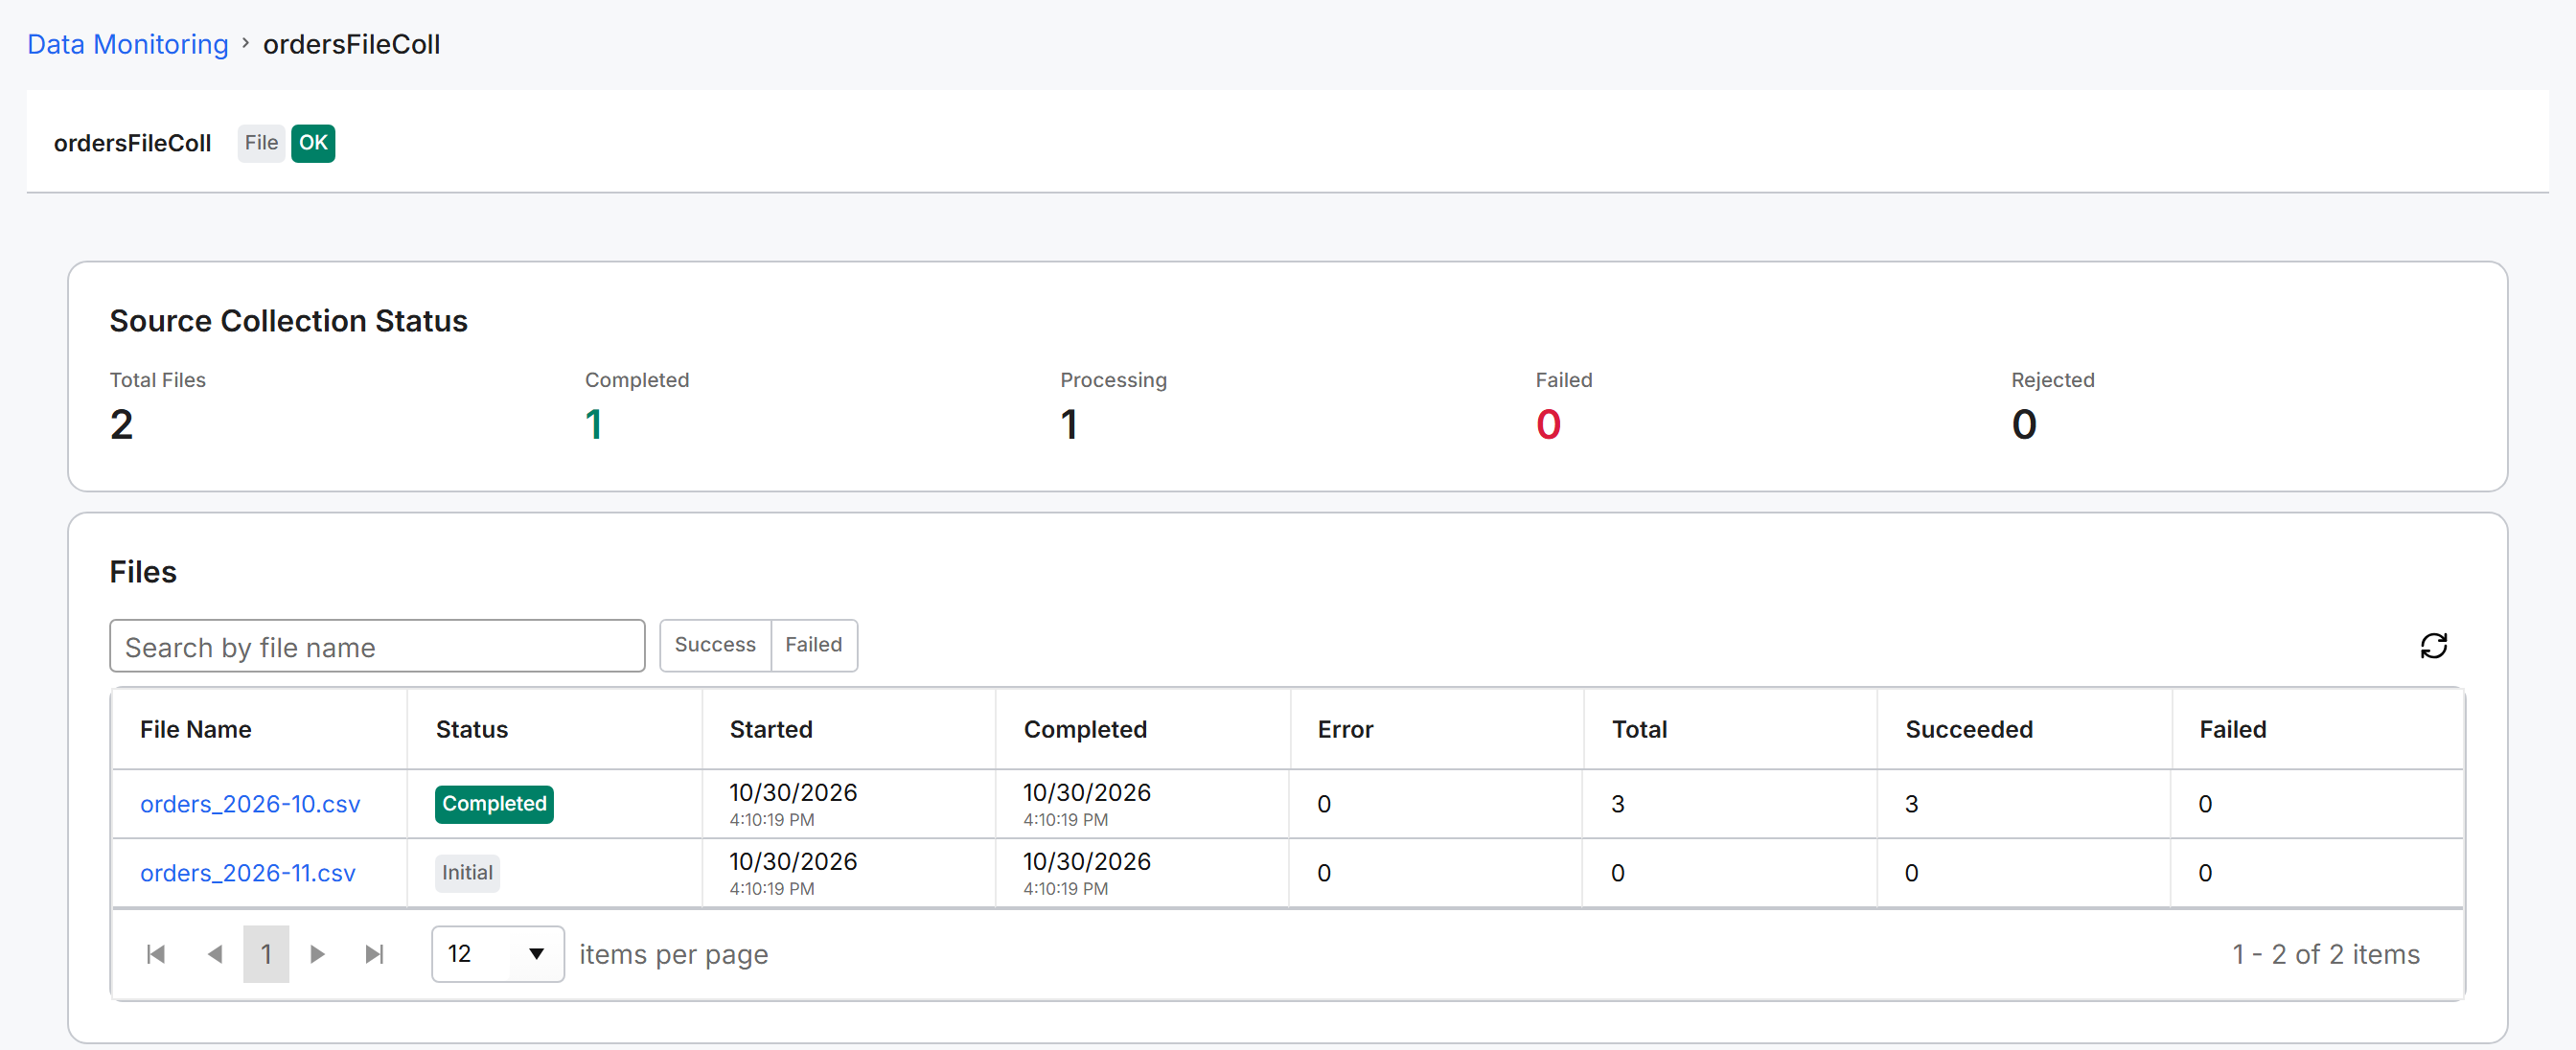
The collection's page opens. Check the collection's state, for example OK.
In Source Collection Status, check the Failed and Rejected counts.
The tiles count the collection's files: Total Files, Completed, Processing, Failed, and Rejected. A count greater than zero in Failed or Rejected means that some files did not load.
In the Files grid, select Failed to list only the files that failed. Rejected files do not appear under Failed. To find rejected files, clear the filter and check the Status column.
Each row shows File Name, Status, Started, Completed, Error, Total, Succeeded, and Failed. To find one file, enter its name in Search by file name.
Select a file name. A panel opens with the file's counts and two tabs, Status Rollup and Errors. Select Errors to read the errors that the file recorded. To open the details as a full page, select View Details.
Fix the cause of the error:
- Correct the transform in Data Fusion where you built the pipeline.
- Fix the source data.
- Update the source system credentials. For credentials, see Authenticate File Sources, Authenticate Database Sources, or Authenticate Streaming Sources.
Run the failed files again. A new run processes only new or changed files, so it does not pick up a failed file. By default the platform also moves each processed file, including a failed one, out of the inbox to the archive. Retry the failed files in one of two ways:
On the Data Fusion canvas, select Execute pipeline on the source collection node. In the Configure Runtime Parameters dialog, choose Select files, filter Processing Status to Failed, select the failed files, and select Execute.
In the Console, process the collection's failed files. Replace
ordersFileCollwith the name of your source collection:JavaScriptSourceFile.processAll(DataIntegSpec.make({ filter: "sourceCollectionName=='ordersFileColl' && status.state=='failed'" }));To retry rejected files, use
status.state=='rejected'in the filter instead.
If a file still fails, or never leaves Initial, find its symptom in the Fix common problems table of Configure a Source Collection.
Return to the collection's page, select the refresh button in Files, and check the Status of the files from the new run.
The Data Monitoring page shows load results and does not reprocess data. To load data again, run the pipeline.
File states
The Status column in the Files grid shows the state of each file (source object). A state starts at Initial and ends at Completed, Failed, Rejected, or Stopped:
| State | Meaning |
|---|---|
| Initial | The C3 Agentic AI Platform has found the file and has not checked it yet. |
| Validated | The metadata of the file has been validated. |
| Chunked | The file has been split into chunks that load separately. |
| Scheduled | The file is in the data load queue. |
| Processing | The file is loading. |
| Completed | The file loaded successfully. |
| Failing | Some content has failed and the rest is still processing. |
| Failed | Some or all content did not load. Open the file's details to read the errors. |
| Rejecting | The file is being rejected because of a parsing error or a metadata issue. |
| Rejected | The content had an unexpected format or schema. Open the file's details to read the errors. |
| Stopping | Loading was cancelled and the platform is cleaning up the load's metadata. |
| Stopped | Loading was cancelled and the cleanup is complete. |
Check a run from the Console
If you build pipelines in code, you can check the same results from the Console. Replace ordersFileColl with the name of your source collection, then run these checks:
Check the processing queues.
SourceQueue.countAll()returns the counts of the source queue, includingpending,failed, andunreviewedFailed.InvalidationQueue.countAll()returns one entry for each queue, such asSourceQueue,BatchQueue, andMapReduceQueue.List the latest pipeline statuses. Each DataIntegStatus record names one stage of a run, such as
SOURCE,SOURCE:CHUNK,TRANSFORM, orTARGET, with its state:JavaScriptc3Grid(DataIntegStatus.fetch({ order: 'descending(meta.created)', limit: 20 }));Find the failed SourceStatus records of your collection:
JavaScriptc3Grid(SourceStatus.fetch({ filter: "state=='failed' && sourceCollectionName=='ordersFileColl'" }));Read the record errors on TargetStatus. A record that fails to load into the target entity Type reports its error in
TargetStatus.errors, with the field errors and the source row. The source status record of the same file shows the failed state, and itsfirstErrorcan be empty. Read the latest failed target status:JavaScriptvar ts = TargetStatus.fetch({ filter: "state=='failed'", order: 'descending(meta.created)', limit: 1 }).objs[0]; ts.errors[0].error.message; // for example "Required field Order.region not set."To see every stage of one run, call the rollups on the file's root status record. Replace
<status ID>with the ID of a step 3 result whosetypeIdentisSOURCE. The step 3 results can also list chunk records, whosetypeIdentisSOURCE:CHUNK, and the rollups fail with an error on a chunk record ID.SourceStatus.make({ id: '<status ID>' }).all()returns the status, andallChunks(),allTransforms(), andallTargets()return the chunk, transform, and target statuses.
If a file does not load at all, check for these three causes:
The file has no
SourceFilerecord: the platform has not synced it yet. RunSourceFile.syncAll(null)to sync the files of every file source collection.The file stays at
initial: it was synced without being processed. Process the collection's waiting files:JavaScriptSourceFile.processAll(DataIntegSpec.make({ filter: "sourceCollectionName=='ordersFileColl' && status.state=='initial'" }));The file stays at
processing: check theSourceQueueentry thatInvalidationQueue.countAll()returns. If the entry'spausedvalue istrue, the queue holds the work. If nobody paused the queue on purpose, runSourceQueue.resume().
The errors field of a status record holds only the first 100 errors. To read every error of a file, call allErrors() on its root status record, for example SourceStatus.make({ id: '<status ID>' }).allErrors().
A file source collection also keeps the source objects that failed, together with their errors. To list them, call failedSources() on the collection:
c3Grid(FileSourceCollection.forName('ordersFileColl').failedSources().collect());Each result names the failed source, its error, and the target Type or transform where the error occurred. The platform keeps these records unless the collection's doNotArchiveFailedSources option is set. To delete them, call deleteAllFailedSources(true) on the collection.
Status records accumulate with each run, and the platform does not delete them. Count the source status records of one collection with fetchCount:
SourceStatus.fetchCount({ filter: "sourceCollectionName=='ordersFileColl'" });To remove status records, call DataIntegStatus.removeAll({}, true). This call removes the status records of every source collection in the application, not only one. Reset Run State in Data Fusion runs this call and also clears the source queue with SourceQueue.clear(), which drops pending work for every collection. Remove the records only when you no longer need the history of earlier runs.
To remove the status records of one collection only, filter on the status IDs, which start with the collection name:
DataIntegStatus.removeAll({
  filter: "startsWith(id, 'ordersFileColl_') || startsWith(rootSourceStatus.id, 'ordersFileColl_')"
}, true);
The filter also matches any collection whose name starts with the same text, such as ordersFileColl_eu. DataIntegStatus has no sourceCollectionName field, so a filter on that field fails.
Get notified about failures
Data Fusion does not send a notification when a source collection fails to load. Check the Data Monitoring page, or run the Console checks above, after each scheduled run. To be notified about problems in the data that a pipeline loads, deploy a data validation rule with Send notifications to selected recipients turned on, as described in Validate Your Data Pipeline.
Monitor an Unstructured Data Integration pipeline
The Data Monitoring page lists structured source collections only. Unstructured Data Integration (UDI) collections don't appear in the grid. To monitor a UDI pipeline, use the Data Fusion canvas or select Monitoring > Jobs > Batch. For details, see Monitor Pipeline Execution.