Model Serving
Once you've published an ML pipeline, you can use the trained model within that pipeline on new data. For more information about publishing an ML pipeline, view the topic on ML pipelines.
Once published, pipelines act similar to nodes in Visual Notebooks. From a visual notebook, switch to the Assets tab and expand the section for ML pipelines.
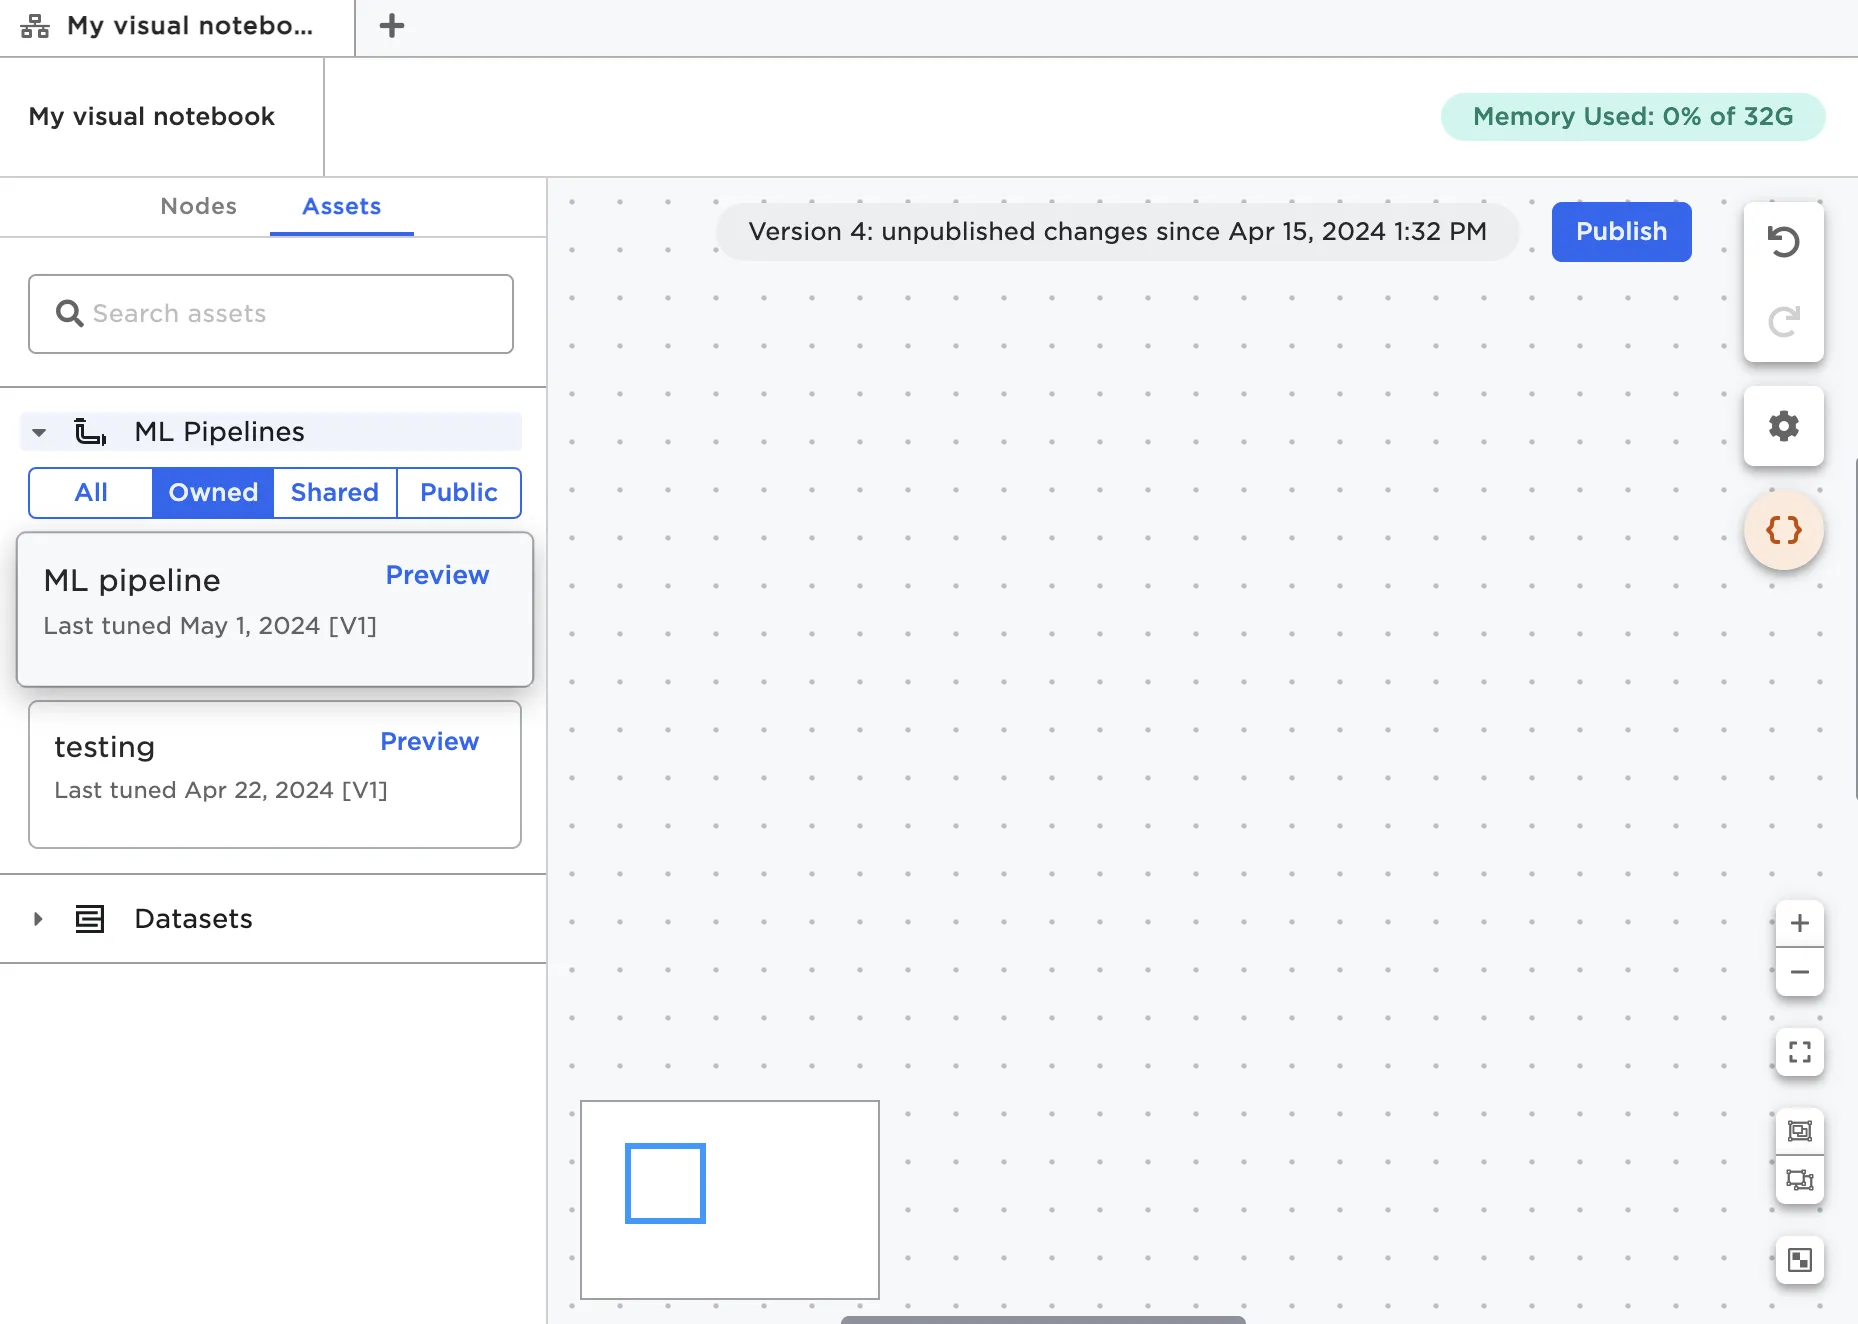
Figure 1: Published ML pipelines in the Assets tab
Drag the pipeline onto the canvas in the same way you would a node. Learn more about using ML pipelines on the canvas in the ML pipeline node documentation.
Common workflow
Once trained, you can use ML pipelines on any data source that shares the same schema as the training data. In a production scenario, you might connect the trained pipeline to the latest data stored in a cloud storage system, then automatically feed that new data through the trained pipeline to generate predictions. Follow along with the example below to implement something similar in your own Visual Notebooks projects.
Create a parameter that returns the range of dates that you'd like to use when pulling data. In Figure 2 below, the parameter returns the date three months from the current date.
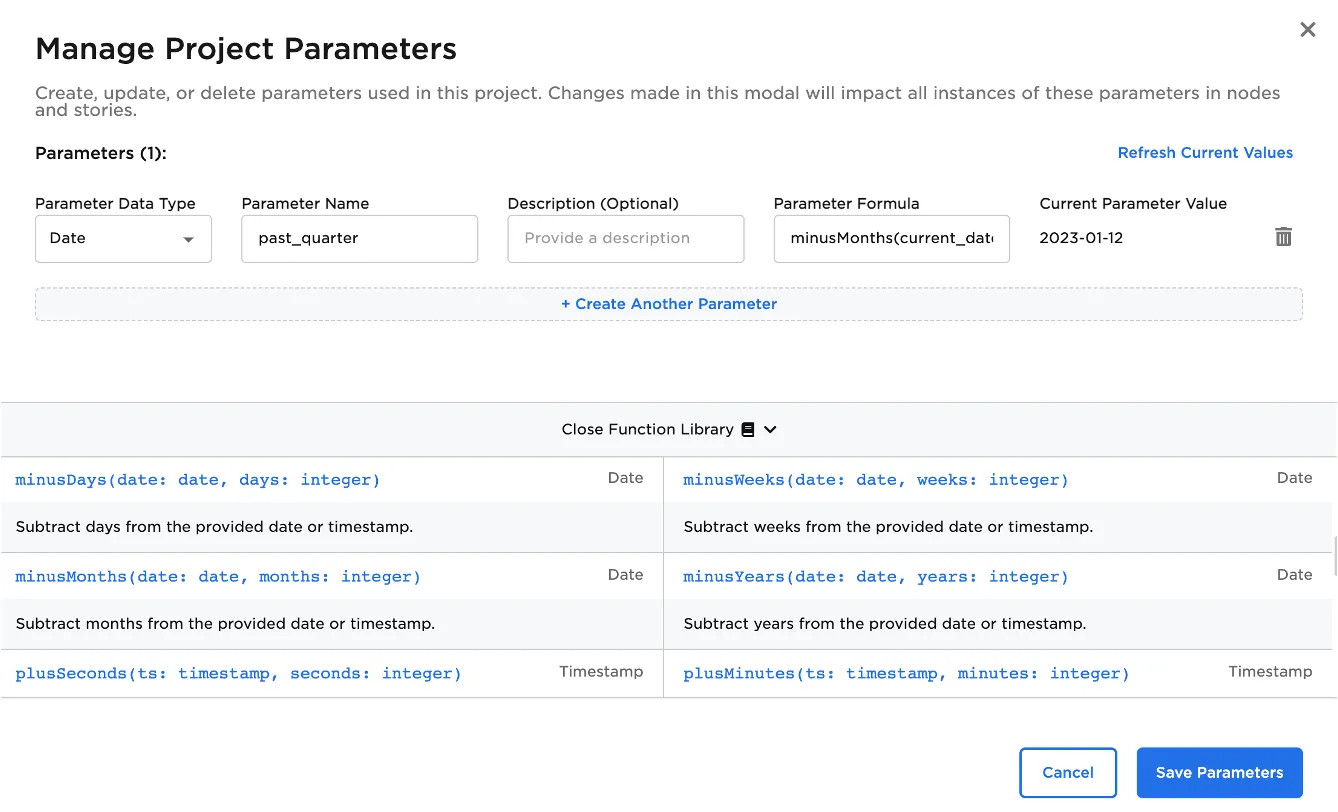
Figure 2: A parameter based on the current date
Drag a connector node onto the canvas. Configure the node to filter using the parameter you just created.
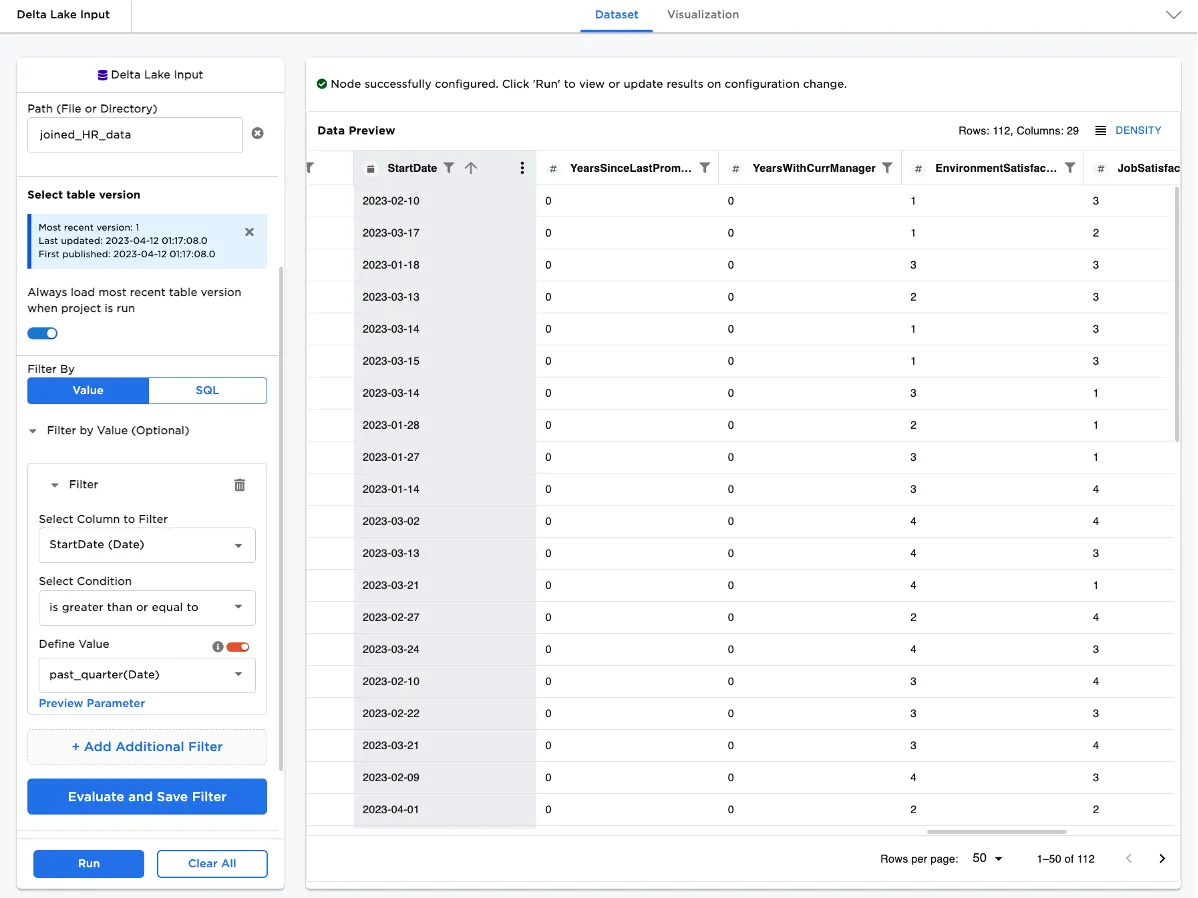
Figure 3: A connector node configured with a parameter
Connect the connector node to the trained ML pipeline, and run the node to generate predictions on the latest data specified by your parameter.
Create a schedule to automatically run the visual notebook on a specified timeline.
If you want to go even further, you can create a visualization that visualizes the model's predictions, add it to a story, then watch the story automatically update with the latest predictions on the latest data with each schedule run. For more information about creating stories see the topic on Stories.