Using AutoML in Visual Notebooks
AutoML is a simplified way of training machine learning models. Instead of having to manually specify model settings, or hyperparamaters, Visual Notebooks automatically tests out different combinations for the algorithm you chose and ranks the resulting models.
Visual Notebooks offers the follow AutoML nodes:
- Model Search Classifier
- XGBoost Classification
- Gradient Boosted Tree Classification
- Random Forest Classification
- GLM Classification
- XGBoost Regression
- Random Forest Regression
- Gradient Boosted Tree Regression
- GLM Regression
- K Means
- Isolation Forest
- Prophet
Using AutoML nodes
You can use AutoML nodes in both visual notebooks and ML pipelines.
If you want to save any of your trained models and use them on new data, you must use AutoML nodes in an ML pipeline. When used in a visual notebook, AutoML nodes are intended for rapid prototyping, as you can test out different algorithms and models but can't save them.
To begin using an AutoML node, connect it to an existing node that contains data you'd like to train models on.
All AutoML nodes have very few required fields, with a multitude of optional configuration options. If you are a beginner to machine learning, complete the required fields then select Train to have Visual Notebooks automatically train multiple models for you.
As models are trained, they appear on a leaderboard and are ranked according to a performance metric selected for that algorithm. The model Visual Notebooks determines to be the best appears at the top of the leaderboard.
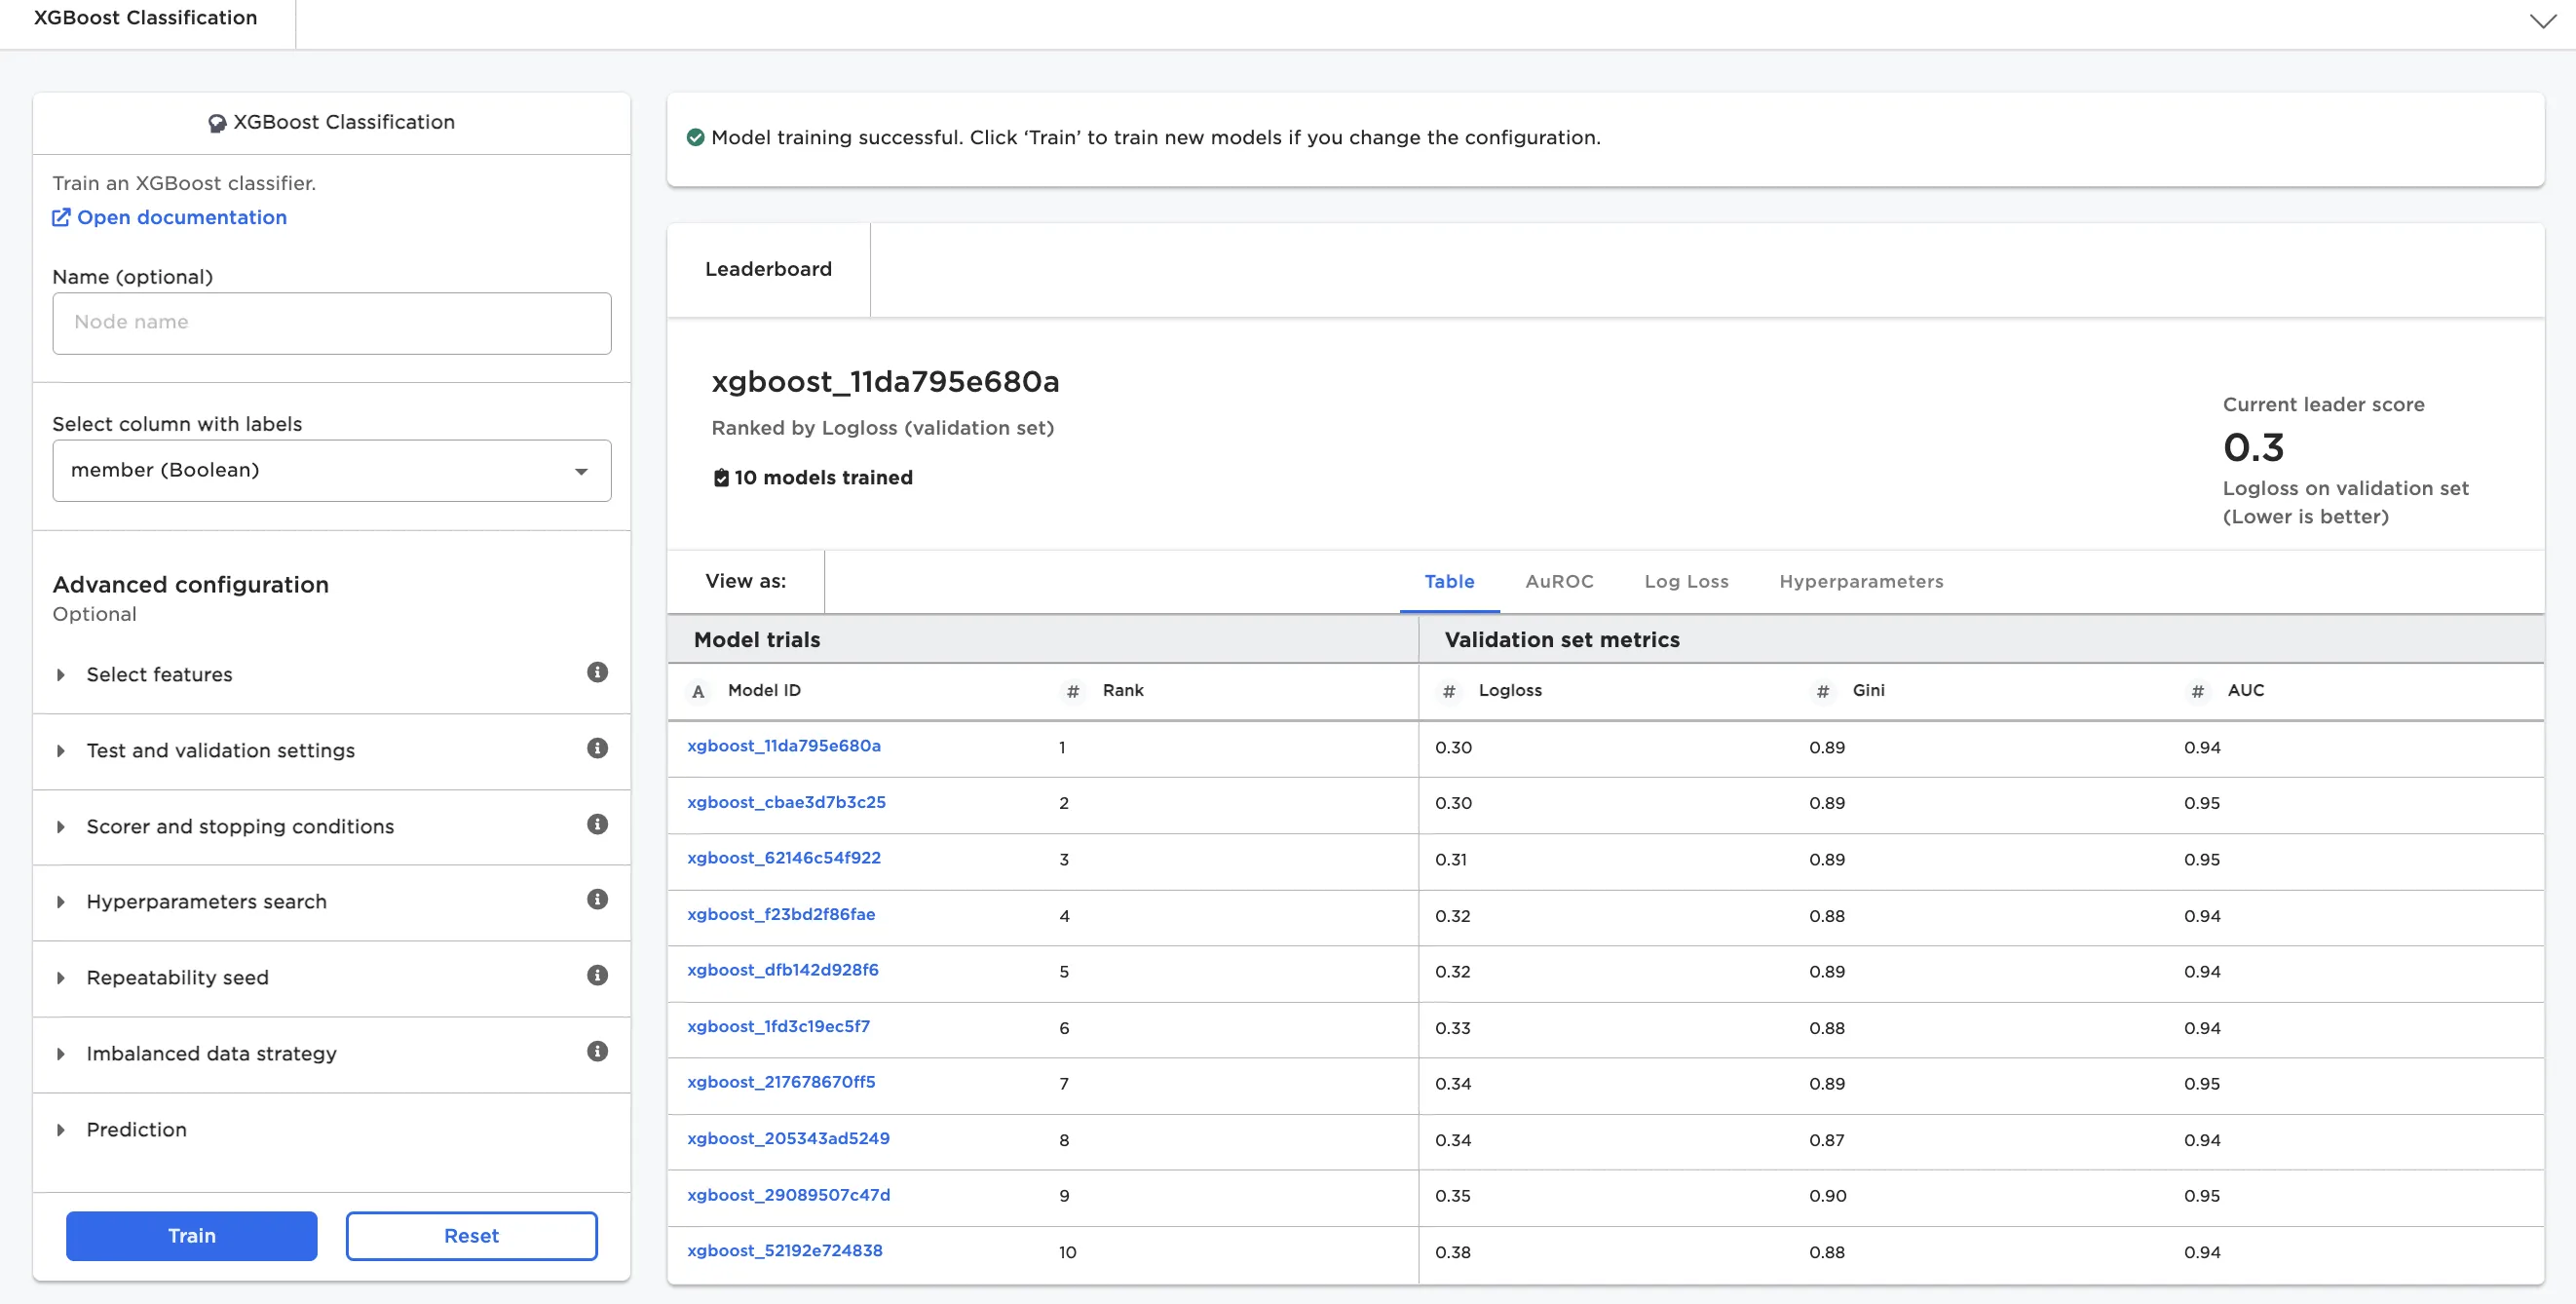
Figure 1: Model leaderboard for an XGBoost classification node
Select a model on the leaderboard to view more information about that model and analyze that model's predictions. Nodes display different information depending on the algorithm.
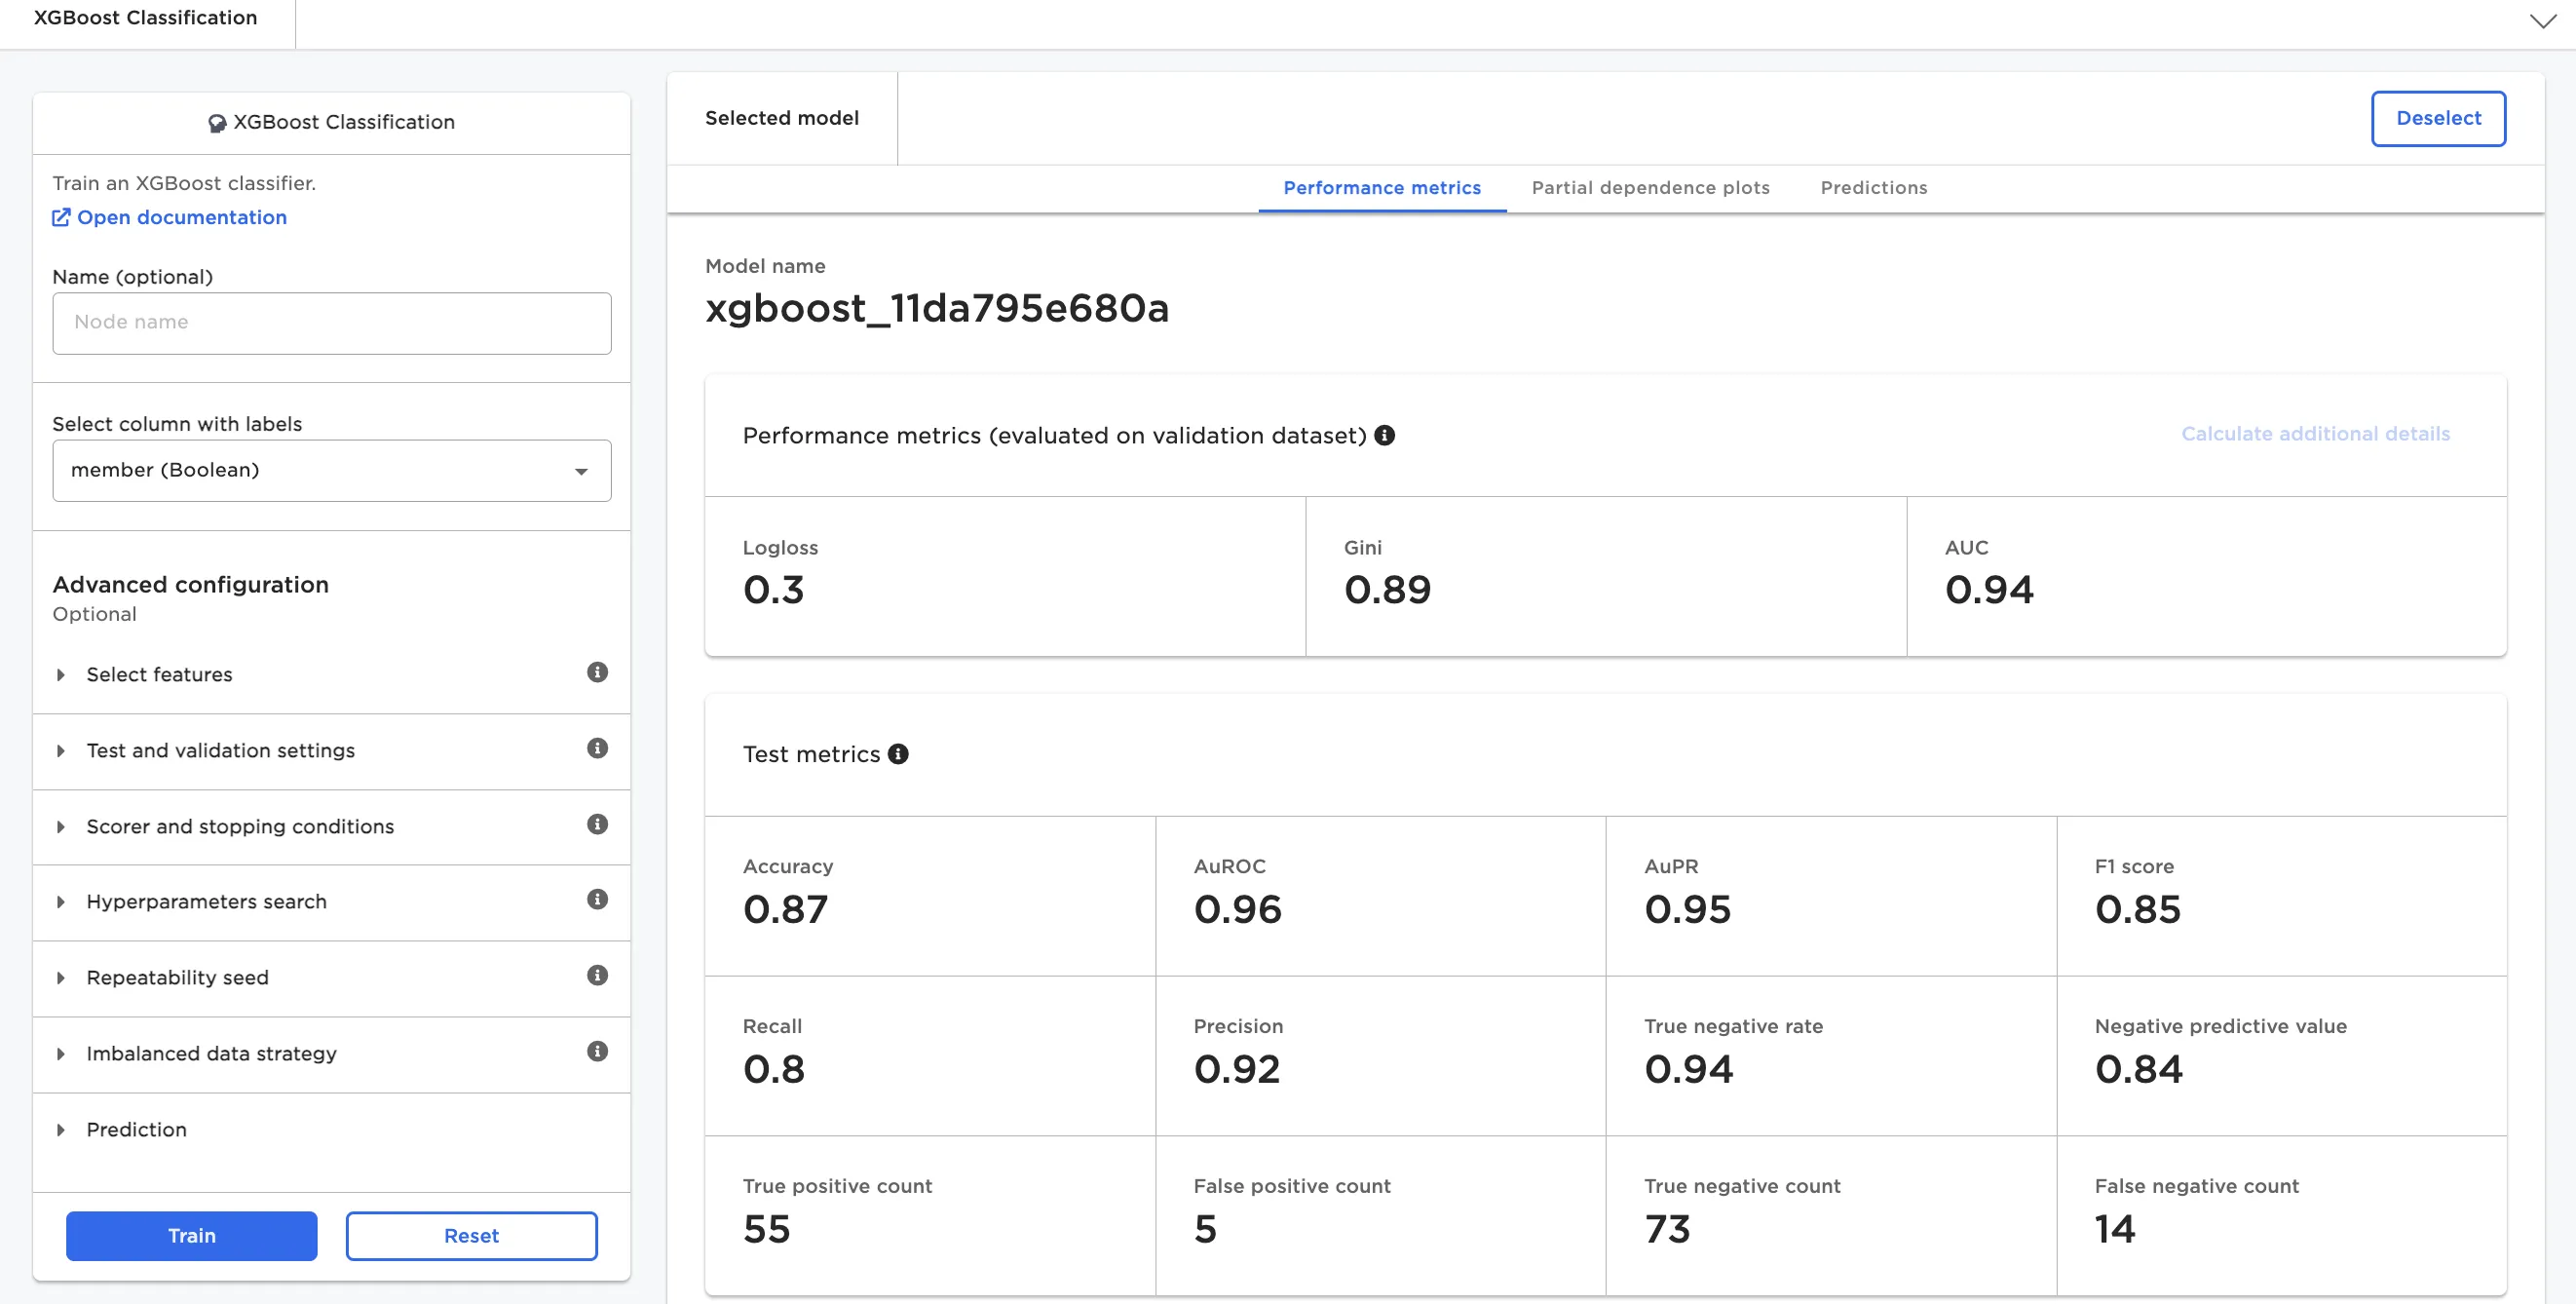
Figure 2: Model details for an XGBoost classification node
If you're using an AutoML node in a ML pipeline, the model that is selected when you close the node is the model that will be saved in the pipeline. Click on a model to select it. The selected model is displayed in a darker shade of gray. In figure 3 below, the third model on the leaderboard is selected.
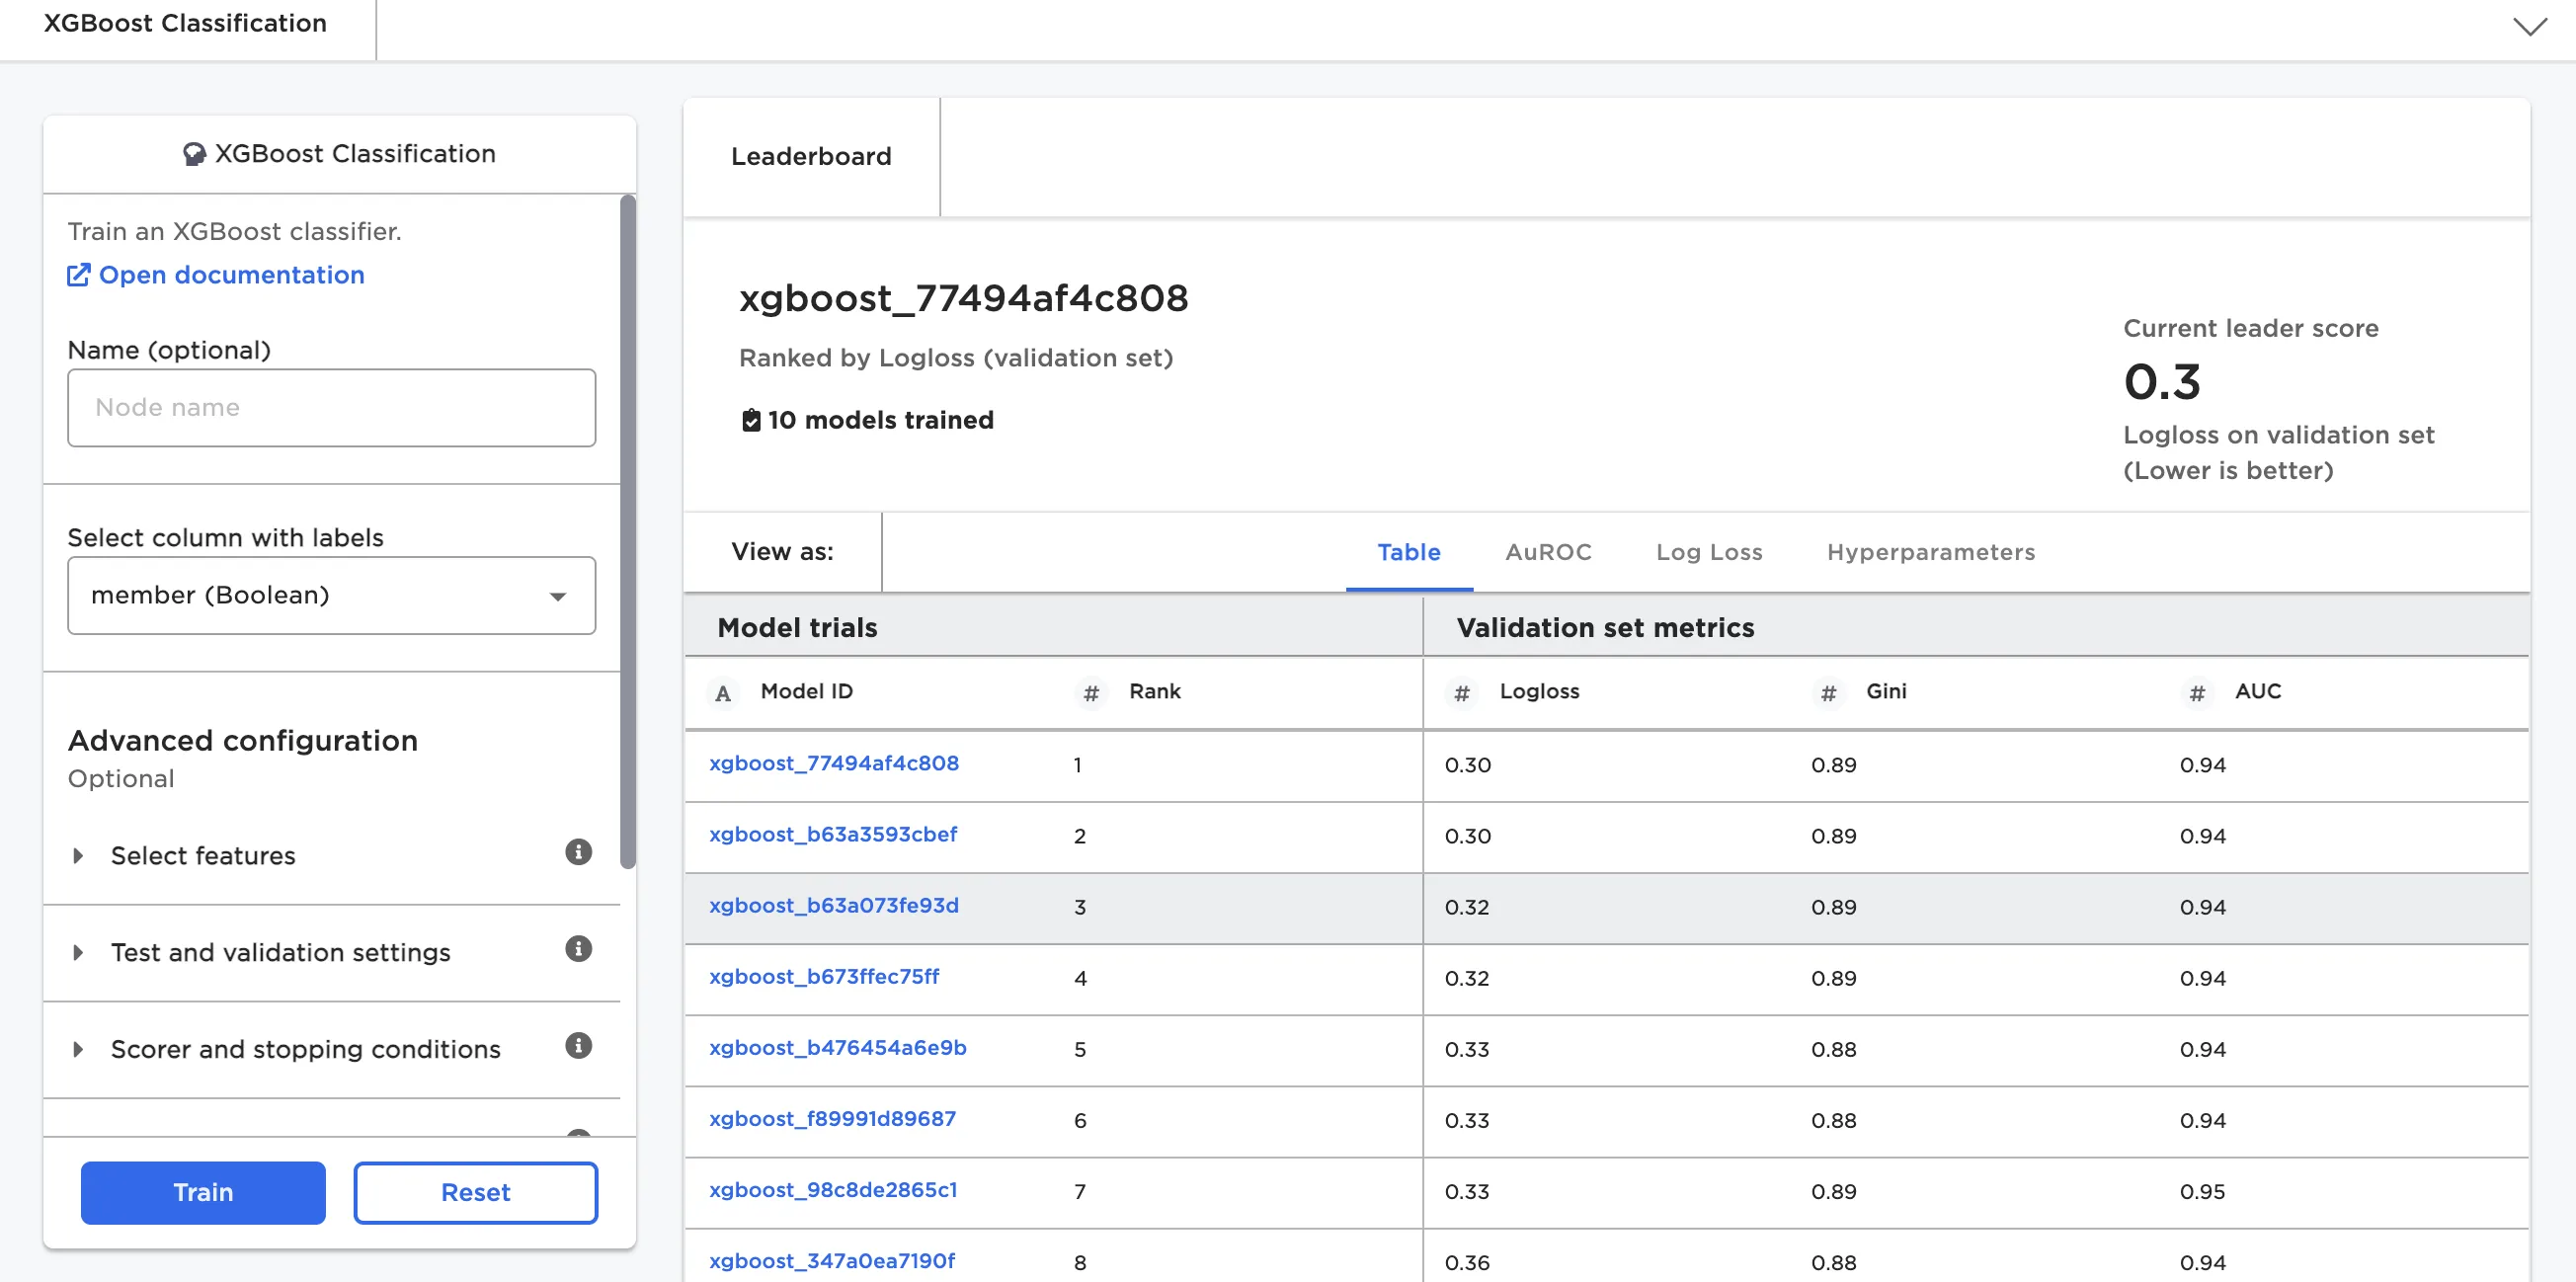
Figure 3: A selected model
If you are more experienced with data science, you may want to manually adjust the hyperparameters using the advanced configuration options for your node. For more details about the available fields, see the node documentation for the specific node you're using.