Build ML Models
You have data and want to predict something from it, such as which machines are likely to break down soon. The ML Agent, the machine learning agent in C3 Intelligence, turns that goal into a plan that you approve. It then trains and compares models and tells you how far to trust the result. It also uses CHARM, a C3 AI foundation model for time-series data, meaning values recorded over time, such as hourly sensor readings. CHARM is pretrained on large amounts of such data, so it forecasts readings and scores unusual behavior without training on your data.
In the example, you work with the factory data in three requests:
- Predict which machines may break down in the next 48 hours, after you approve the plan.
- Ask the ML Agent to explain why the top machine ranks highest.
- Forecast one machine's sensor readings for a week and flag readings outside their normal range.
At the end, you find the trained model and its report.
What the ML Agent can do
The ML Agent covers the path from a prediction goal to a trained, documented model. Describe the goal in plain words; the ML Agent chooses the methods and asks you about the decisions that depend on your knowledge of the business:
| Capability | What you get |
|---|---|
| Plan a model | A written plan with the approaches it compares and the decisions it wants you to confirm |
| Train and compare models | Several approaches run side by side, including results that turned out poorly |
| State reliability | A plain statement of how far to trust each result, and which predictions are extrapolation |
| Explain a prediction | The factors behind one prediction, with a short bottom line |
| Forecast with CHARM | Forecasts with a likely range, and readings flagged outside their normal range |
| Hand over the work | The trained model, a report, and notes on what worked and what did not |
Before you start
The ML Agent needs data files that hold the outcome you want to predict, or readings over time for a forecast. The orchestrator, shown as C3 Intelligence, sends prediction requests to the ML Agent, which appears as ML Agent in the agents list. Its replies sometimes call it the ML Engine; both names refer to the same agent. Start in either of two ways:
- With the Smart Factory example: continue the conversation after the three Analyze Data requests. The data is already loaded and profiled there, so you can compare your results with this page.
- With your own data: attach your files to your first request and describe what to predict in your own words. Use the prompts on this page as patterns. Profiling the data in Analyze Data first is optional, and gives the ML Agent a statistical profile of the data to start from.
Each run builds its own plan, scores, and dashboards, and each step ends with what to look for, so you can check your own result. To learn how agents and plans behave, see Conversation Features.
Ask for a prediction and a plan
A prediction request works best when it asks for the plan first. A wrong plan takes one reply to fix, while a wrong model means training again. Send this request:
Predict which machines are likely to break down in the next 48 hours. Compare a few approaches, show me your plan before you start, and tell me how reliable the final predictions are.The request states the outcome and the time window and asks for a comparison. It sets two checkpoints: the plan before work starts, and a reliability statement at the end. It names no algorithm, so the ML Agent chooses the approaches and you judge them.
The plan takes longer than a DI Engine reply, because the ML Agent first explores the data. The plan arrives before any training starts.
Review and approve the plan
The plan has five parts, and each one gives you something to check:
- Key data facts: what the ML Agent found in the data that shapes the plan.
- Approaches compared: a table of the candidate approaches, with the strengths and weaknesses of each for this data.
- Recommended plan: the approaches it intends to run and in which order.
- Reliability, stated up front: how precise the results can be, given the data.
- Decisions to confirm: choices that depend on your business, such as the time window to predict and how to treat machines that never failed.
The ML Agent checks the data before it trusts it. In the example, it noticed that faults on each machine recur at suspiciously regular intervals, about 19 to 33 days apart depending on the machine. Such regular spacing is a sign of generated sample data. It also flagged daily_failure_probability in the planning inputs file as a leaking column, one that almost gives away the answer. The plan reports results with and without that column.
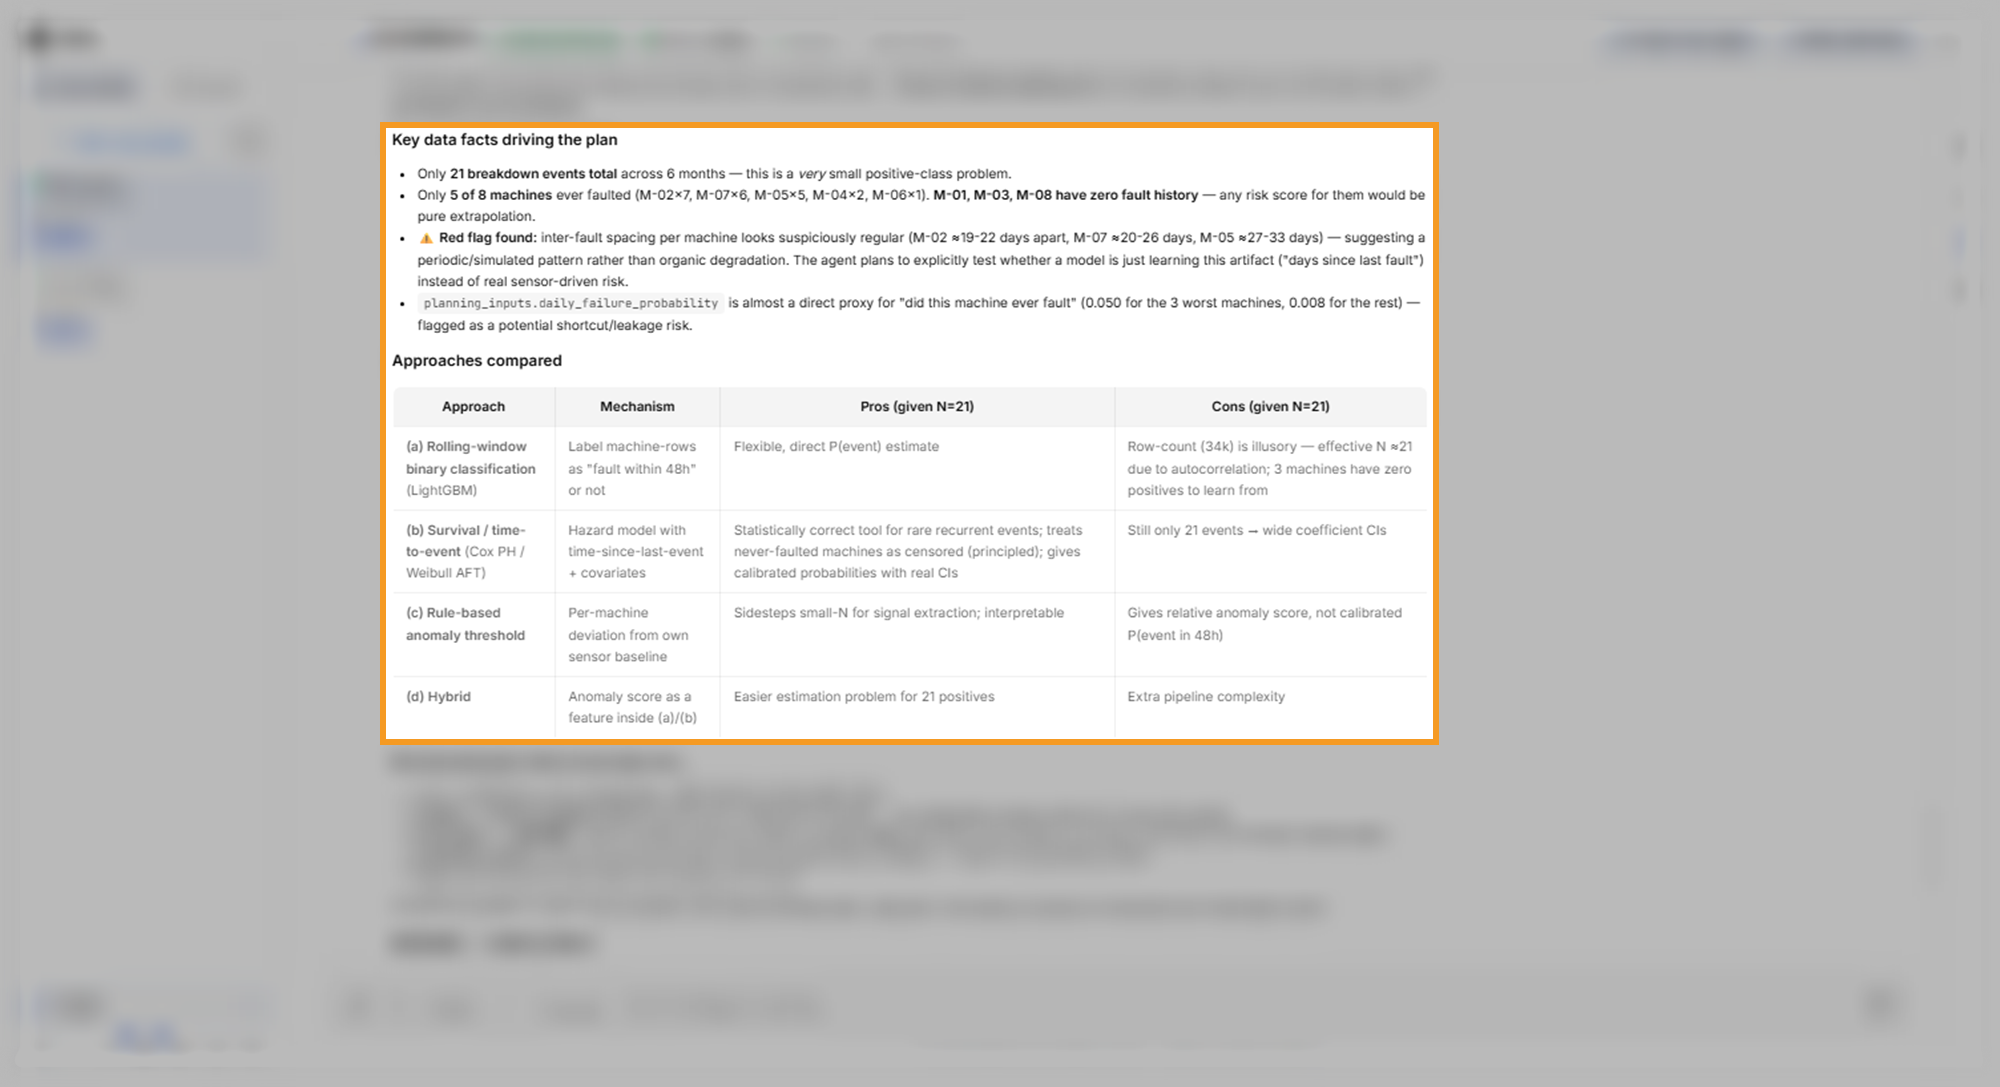
The approaches in the example show the range the ML Agent considers:
- Survival analysis: estimates how likely a machine is to fail within a time window, from how long it has run since its last fault. The plan made this the main approach because it suits rare, repeating events such as these 21 faults. It also counts machines that never failed as not failed yet, instead of guessing when they fail.
- A classifier such as LightGBM: learns from past examples which sensor patterns come before a fault.
- Anomaly scoring with CHARM: scores how unusual recent sensor behavior is, with no training and no fault labels.
The plan ends with eight decisions to confirm. Read them as questions about your business, such as how to treat machines that never failed. The ML Agent chooses the algorithms and their settings itself. Select Yes, proceed exactly as proposed to approve, or adjust a decision first.
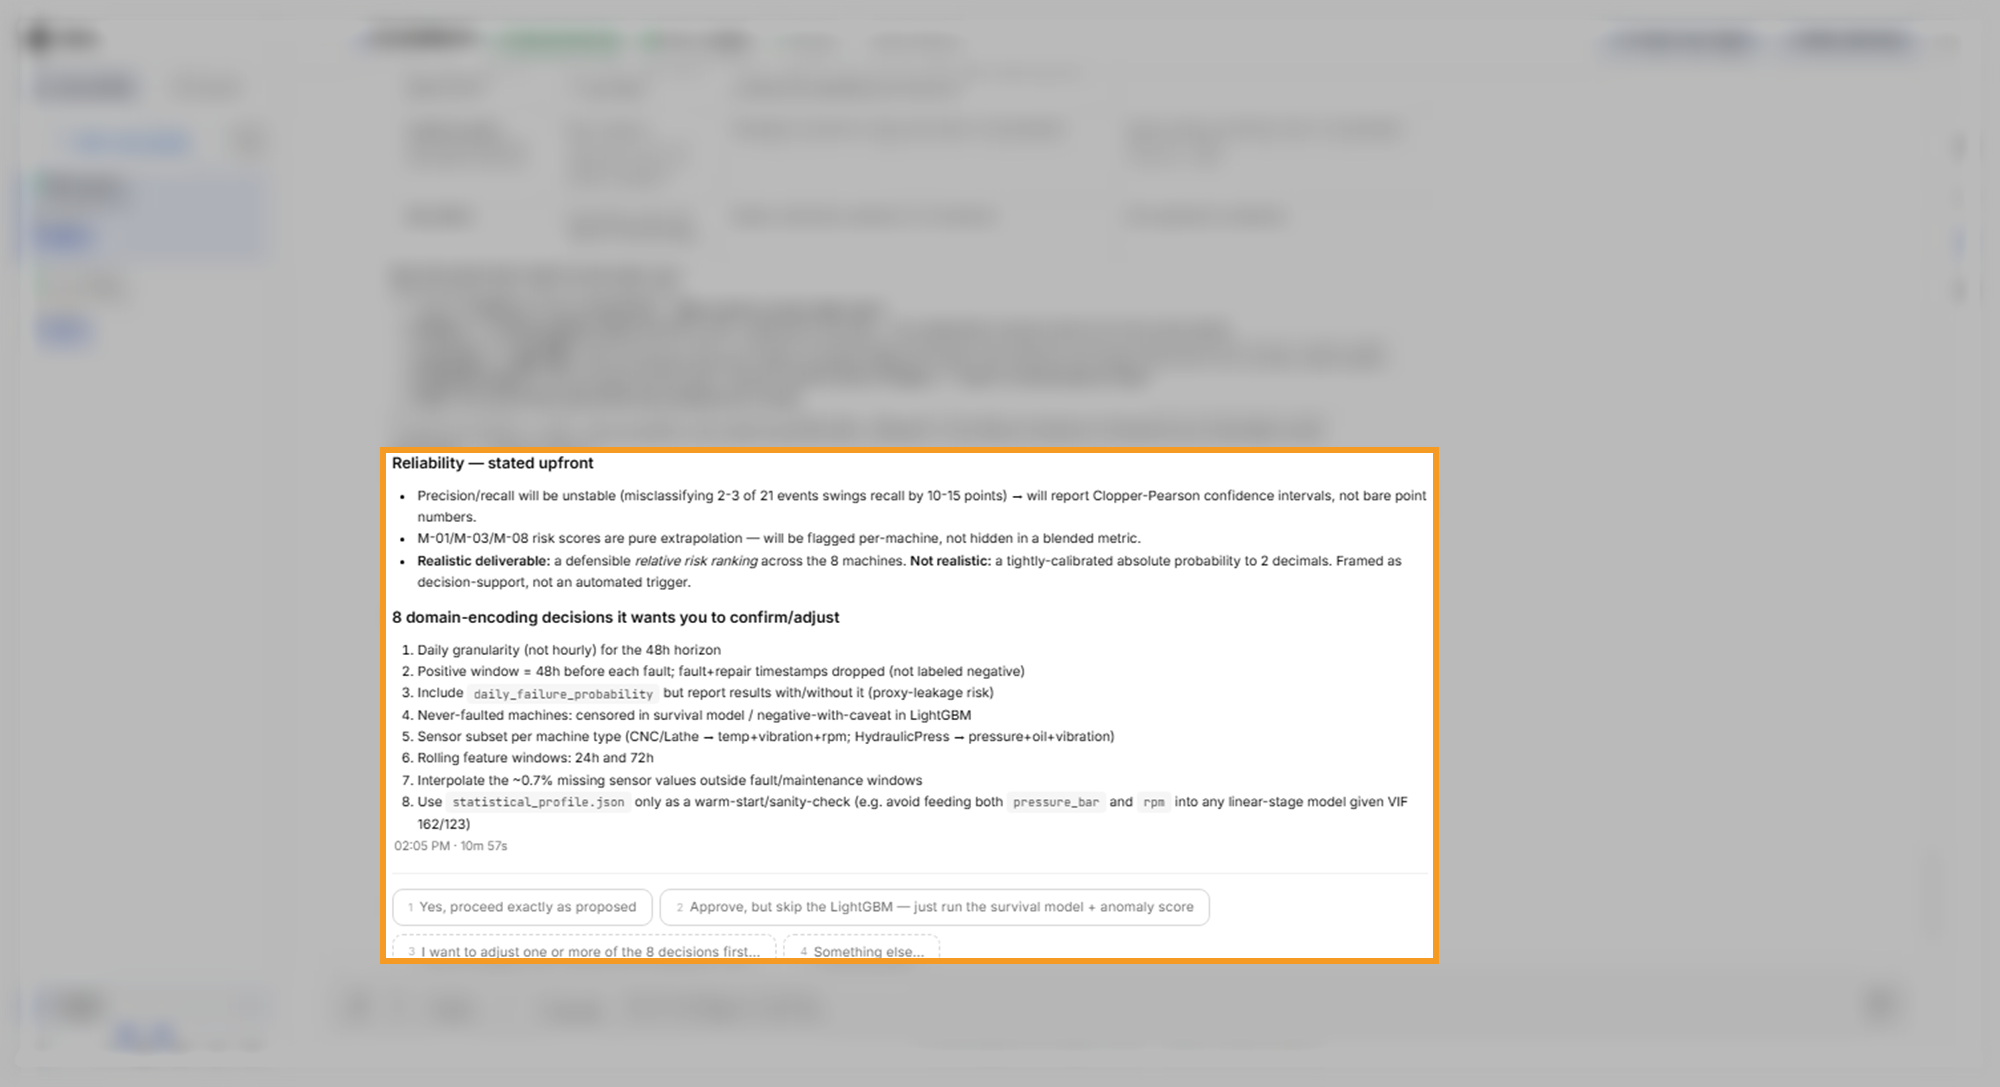
What to look for: a plan to approve, a comparison of approaches, and decisions you can change before any training starts.
Read the results and their reliability
Training can take a while after approval. The results come back with one line per approach, followed by a reliability verdict. The ML Agent can also stop between stages to report results and ask whether to continue; answer in the chat to go on.
In the example, the survival model gave M-02 a 21.5% chance of a fault within 48 hours, and M-07 and M-05 15.4% each. The ML Agent scored the classifier with AUC, which measures how well a model ranks the days just before a fault above other days. An AUC of 1.0 is perfect and 0.5 is random guessing. The classifier scored 0.886 on machines whose faults it had learned from. On a machine whose faults it had not seen in training, it scored 0.346, worse than guessing. The ML Agent reported that negative result next to the positive ones.
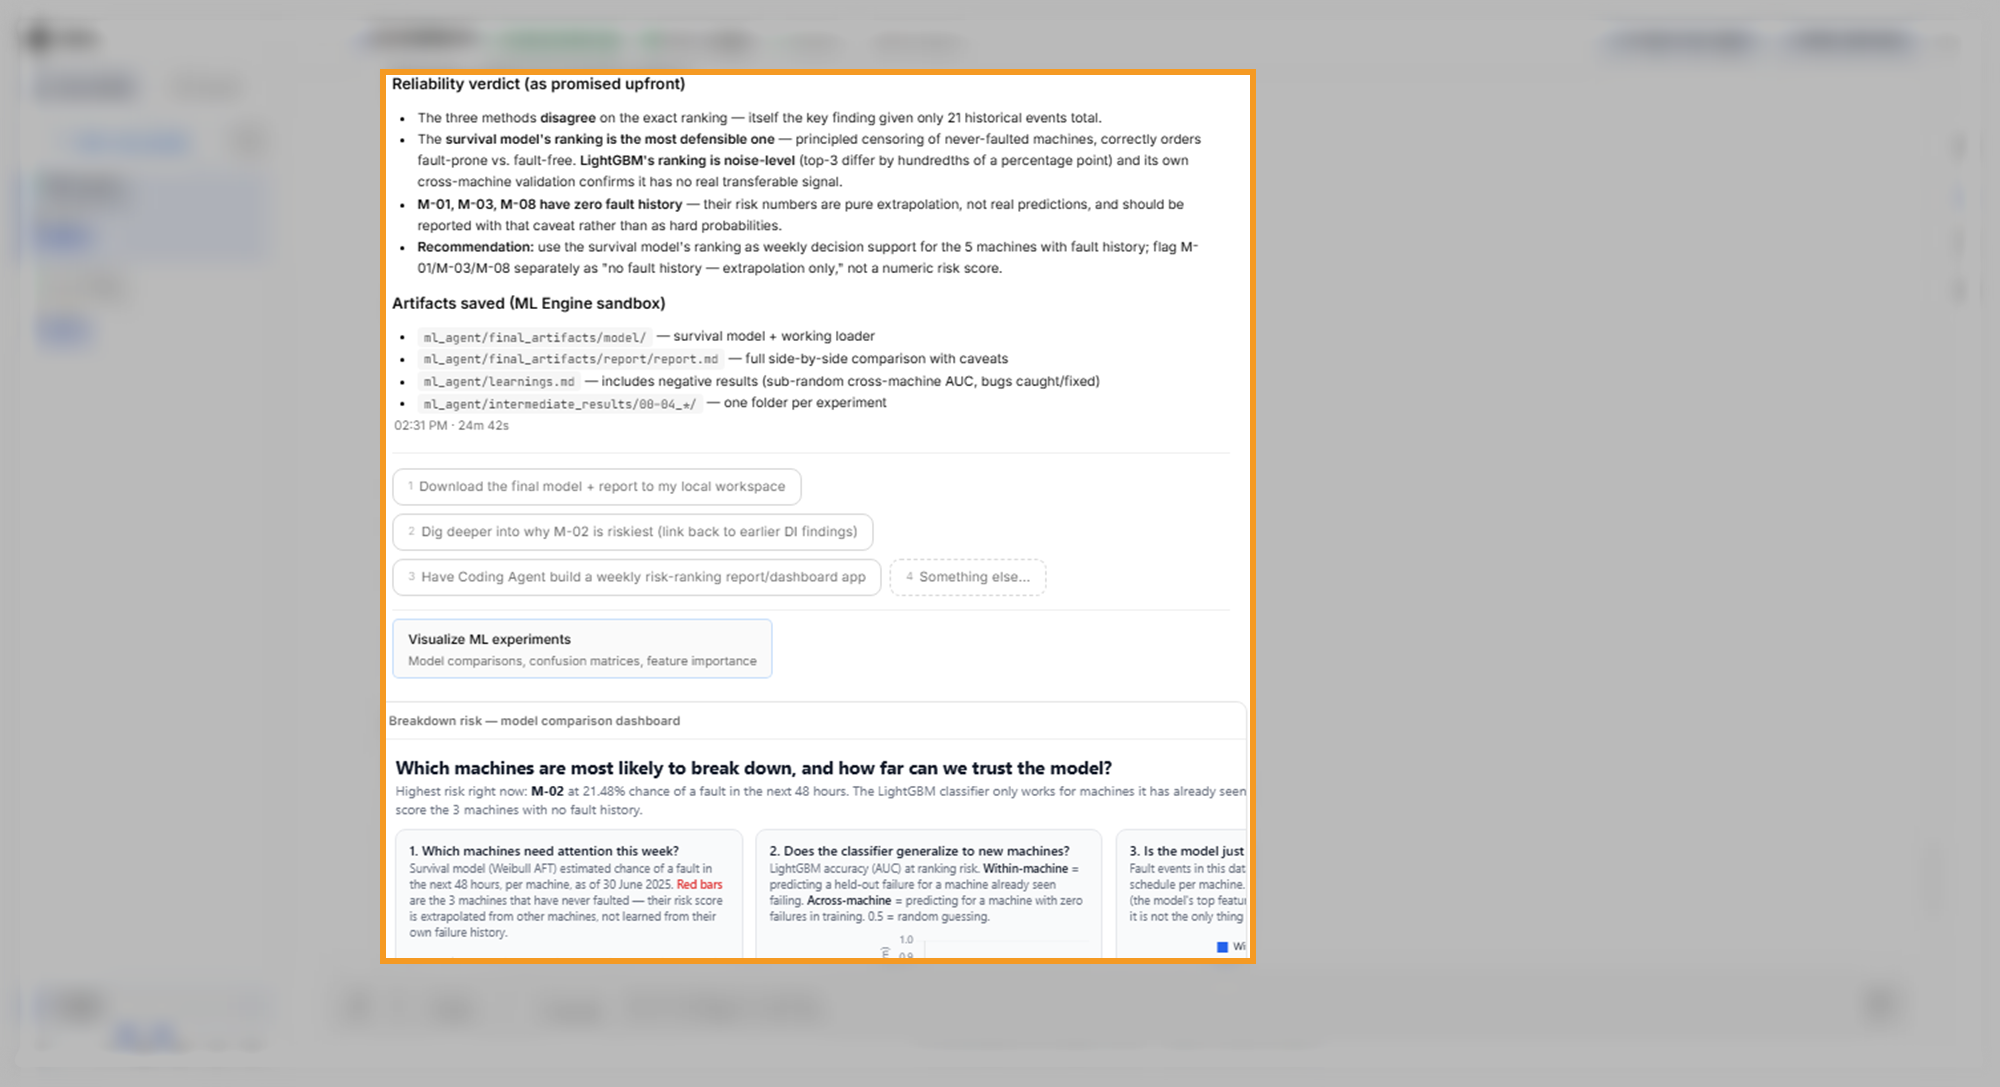
The reliability verdict states, in plain words, how to use the numbers:
- The three approaches disagree on the exact order, which is itself a finding with only 21 faults.
- The survival model's ranking is the most defensible.
- M-01, M-03, and M-08 never failed, so their risk numbers are extrapolation, an estimate stretched beyond what the data shows, and not a real prediction.
- The ranking suits weekly decision support, not an automatic trigger.
The card Breakdown risk — model comparison dashboard asks three plain questions, one per panel. Which machines need attention this week? Does the classifier work on new machines? Does the model only exploit a quirk in the data, the regular fault spacing? Point to the card and select Expand to full screen to read it.
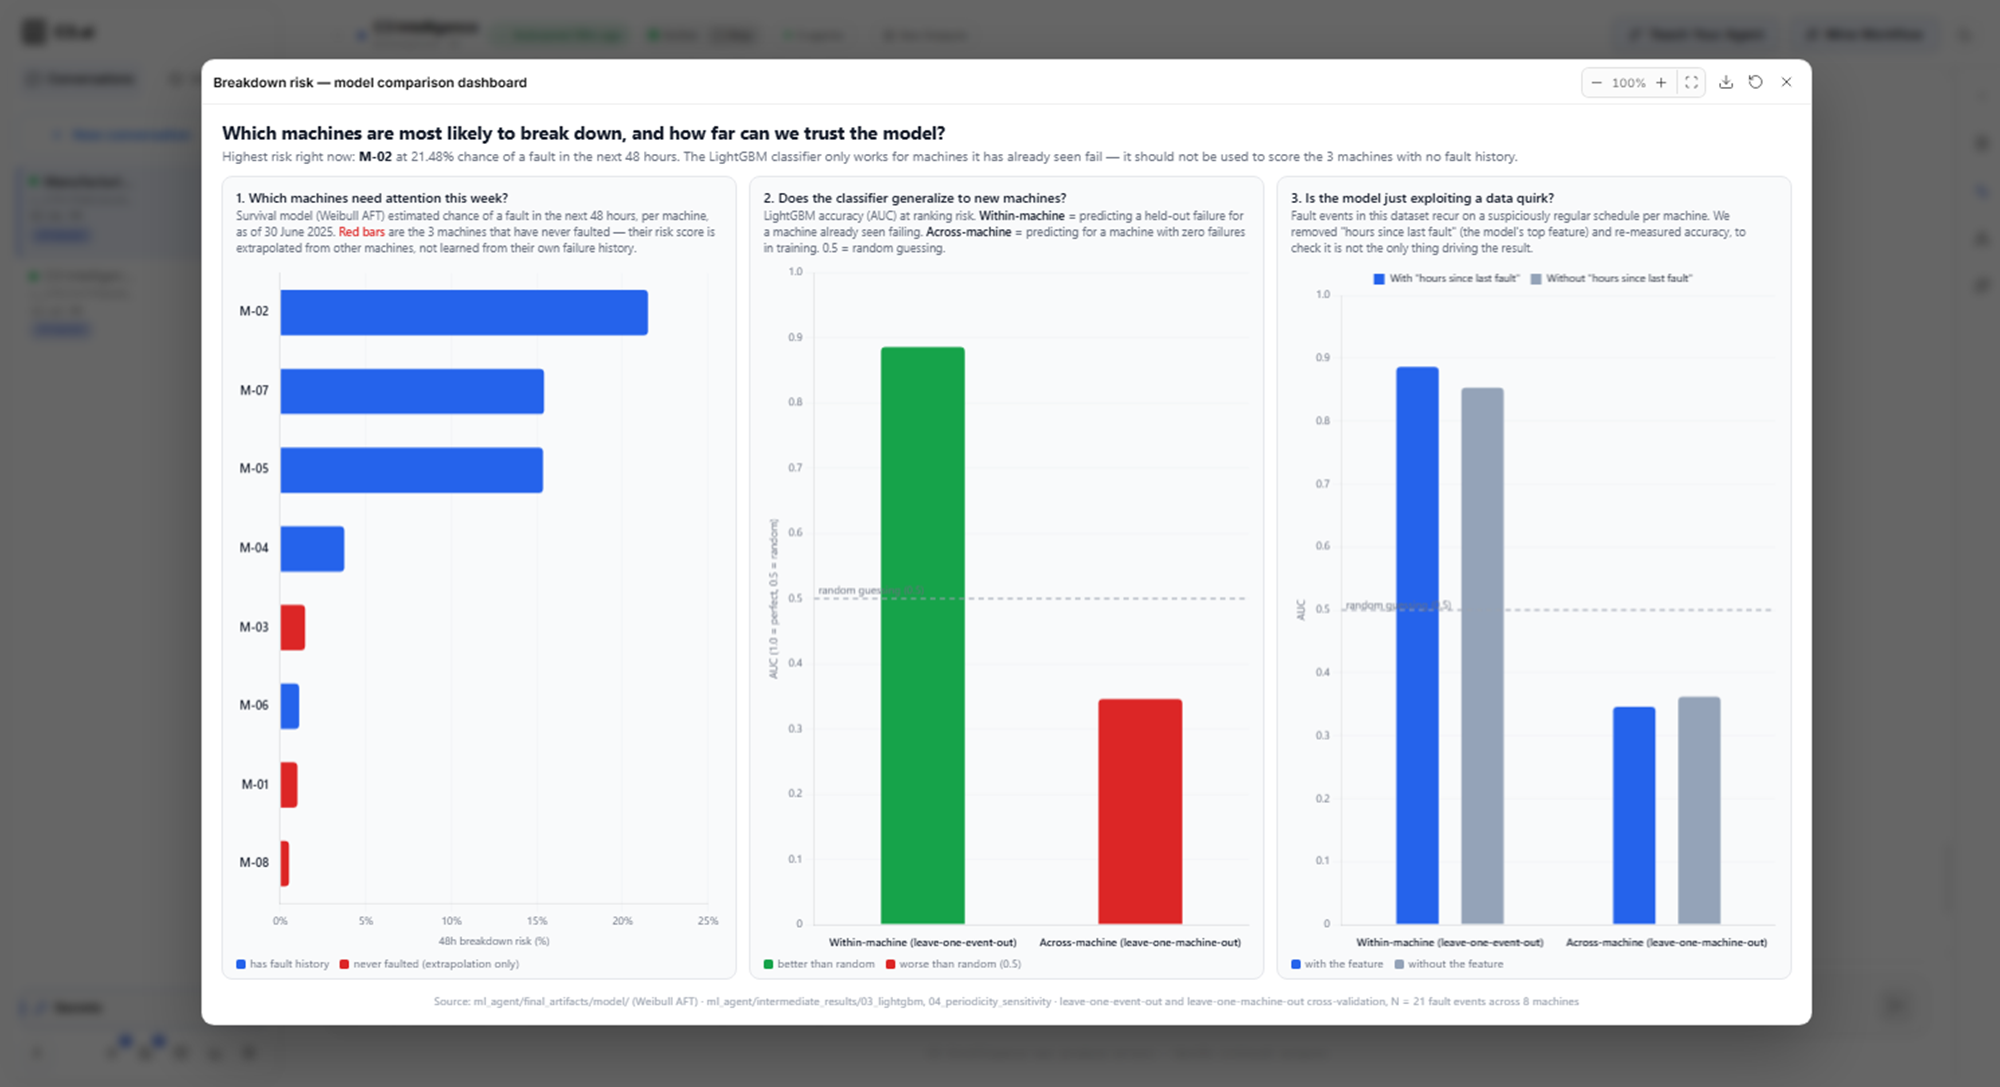
Read the first panel with its legend. Red bars mark machines that never failed, so their scores are estimates, not evidence of risk, and do not compare with the blue bars. In the example, M-03 ranks higher than M-06 although only M-06 ever had a fault.
What to look for: a risk score for each machine, a reliability measure explained in plain words, and a clear note on which scores are extrapolation.
Ask the ML Agent to explain a prediction
Knowing what drives a ranking tells you whether the ranking makes sense for your machines. Send this follow-up in the same conversation:
Explain why the model rates the top machine as the highest risk.The follow-up refers to "the top machine" without naming it, so the same words work on your own data. In the example, the reply arrived in a few minutes. It explained that M-02 ranks highest mostly because it is the most overdue. M-02 had run 2.17 times its usual time between faults, against 1.68 for M-07 and 0.57 for M-05.
The middle of the reply is technical, with the model's numbers for each factor. It ends with a Bottom line in plain language and a caveat about how far the numbers support the conclusion.
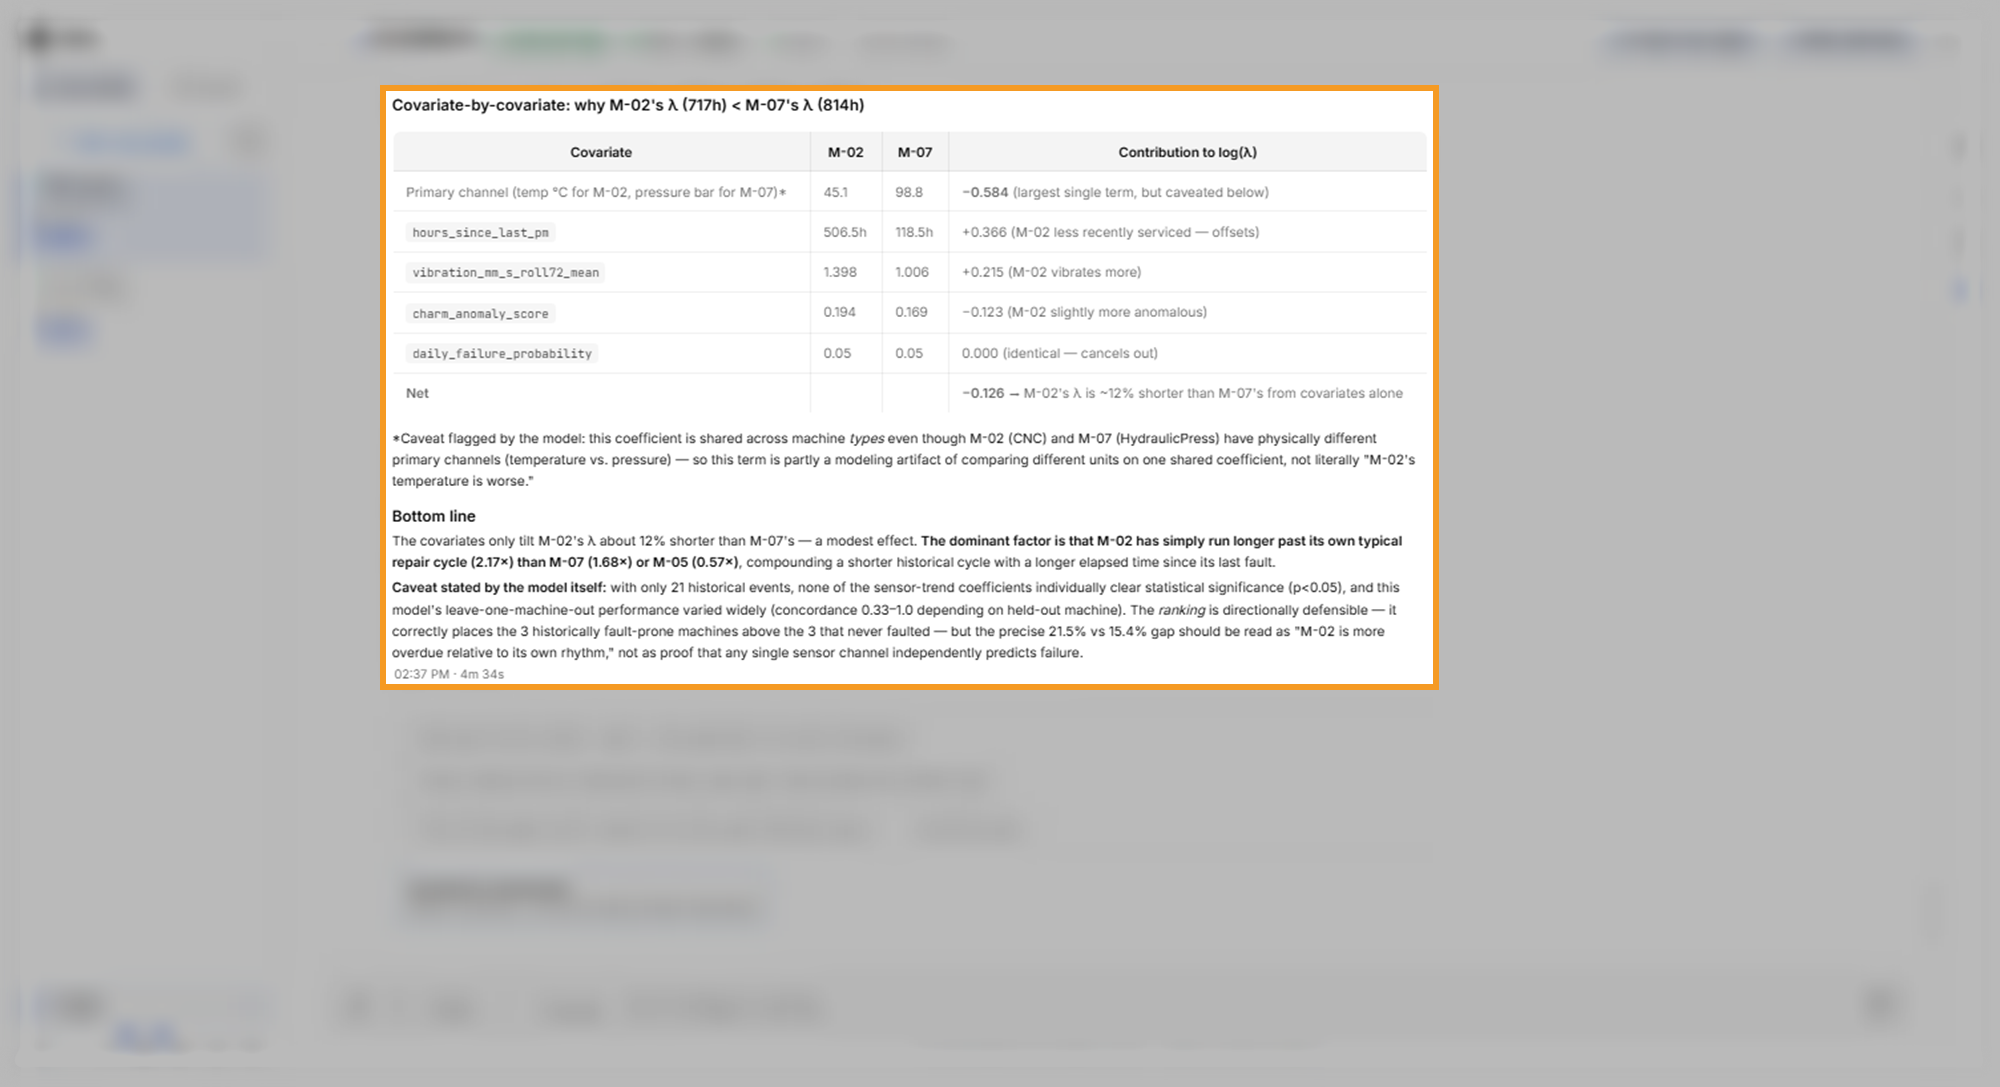
What to look for: a main reason you can state in one sentence, and caveats that say which parts of the explanation are weak.
Forecast sensor readings with normal ranges
A forecast shows where readings are heading, so you can act before a reading leaves its normal range. Send this request:
Forecast the vibration and temperature readings for machine M-05 over the next seven days, and point out any readings likely to move outside their normal range.The request names the readings, the machine, the horizon, and what to flag. It leaves "normal range" open, so the ML Agent proposes a definition for you to confirm.
Confirm the forecast plan
In the example, the ML Agent proposed a plan within a few minutes, with five decisions to confirm. The ML Agent chose CHARM for the forecast and compared it with a simple baseline, the value from the same hour one week earlier. Two of the decisions show why the plan deserves a careful read:
- Missing values: the empty hours matched M-05's repair windows, so it proposed to treat them as gaps instead of filling them.
- Normal range: it proposed a range fitted to M-05's own readings, because the range for the whole fleet gave an impossible negative vibration.
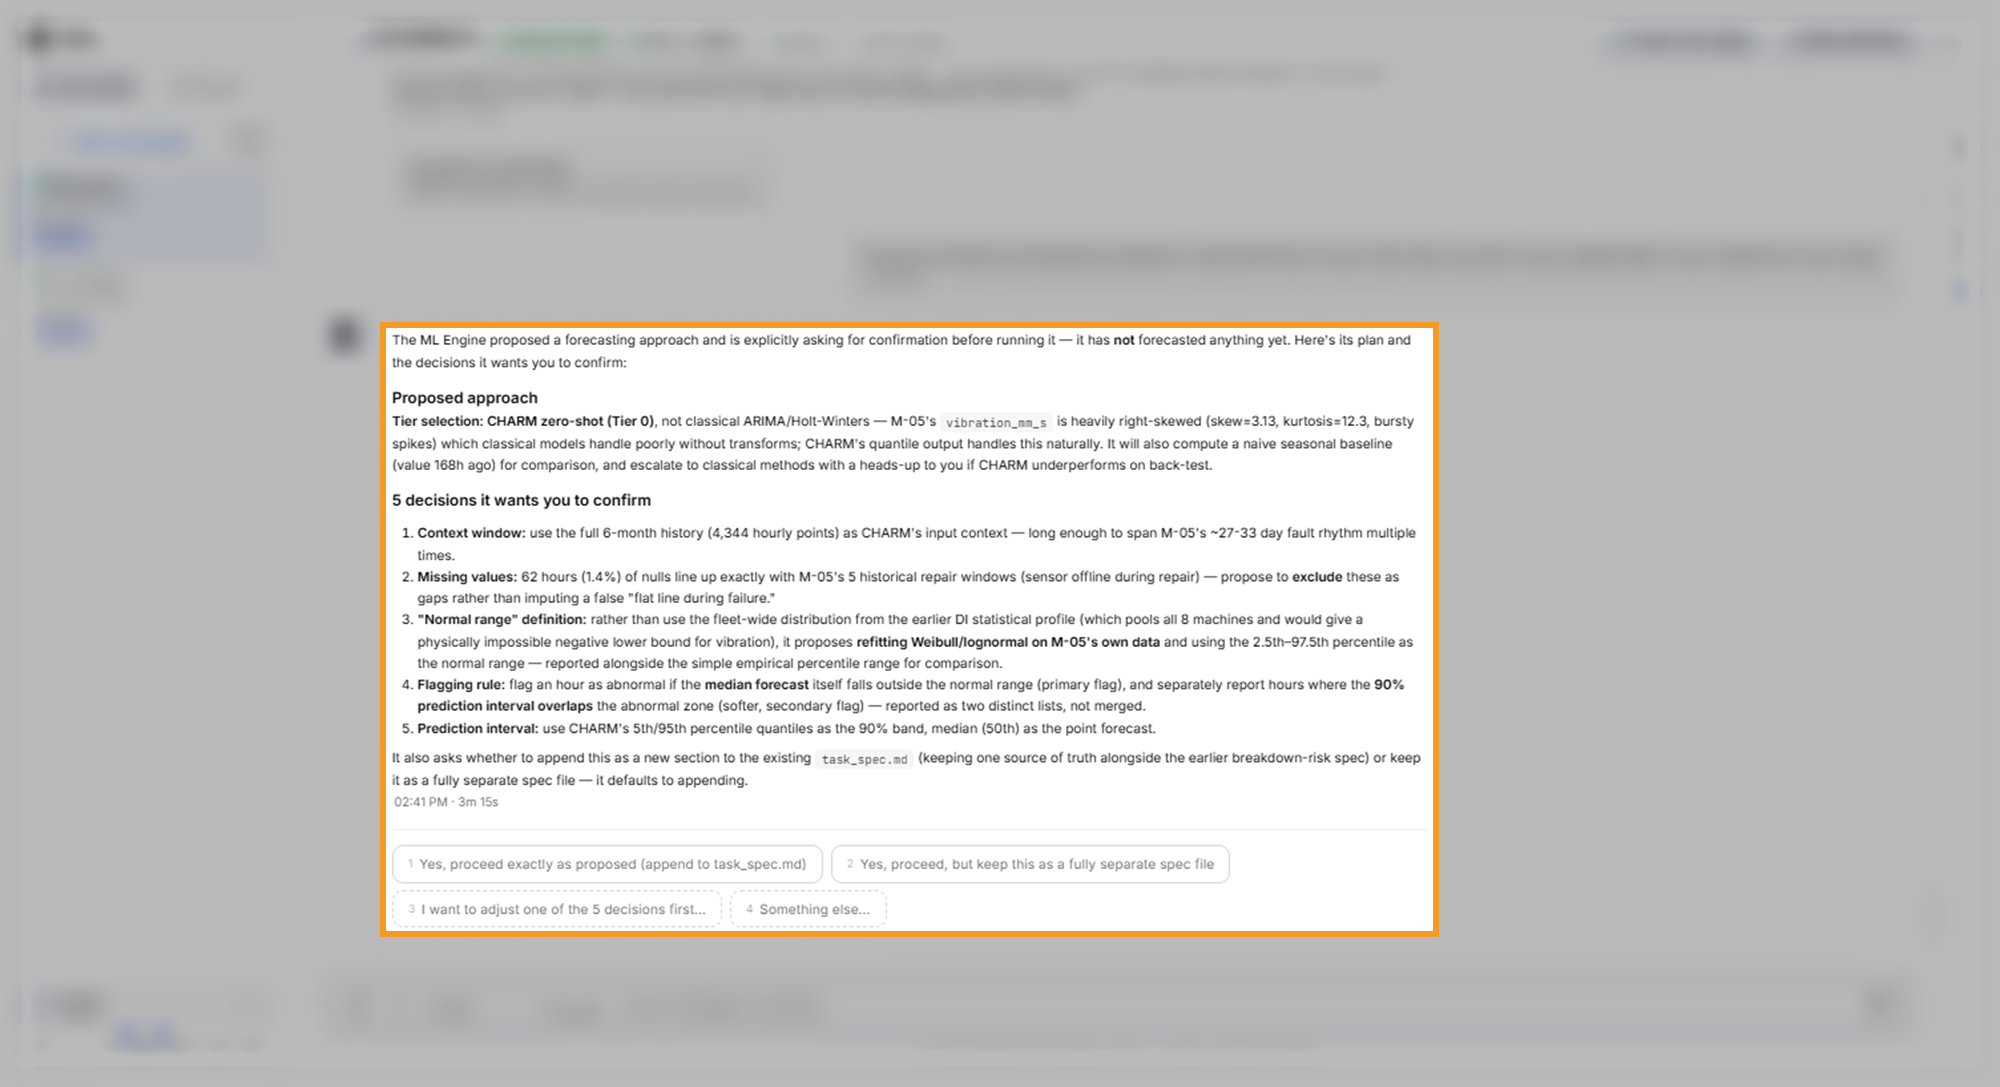
Select Yes, proceed exactly as proposed (append to task_spec.md) to approve. The plan file, task_spec.md, holds the approved plans for this conversation, and the option adds the forecast plan to it.
Read the forecast
The forecast reply gives each reading's normal range and two kinds of flag:
- Primary flag: the most likely value, the median forecast, falls outside the normal range.
- Secondary flag: the 90% prediction interval, the band where the reading falls nine times in ten, overlaps the abnormal zone while the median stays normal.
In the example, the reply arrived a few minutes after approval. No hour had a primary flag, while 73 hours had a secondary flag. All were on vibration and at the low end, which the ML Agent called a mild signal.
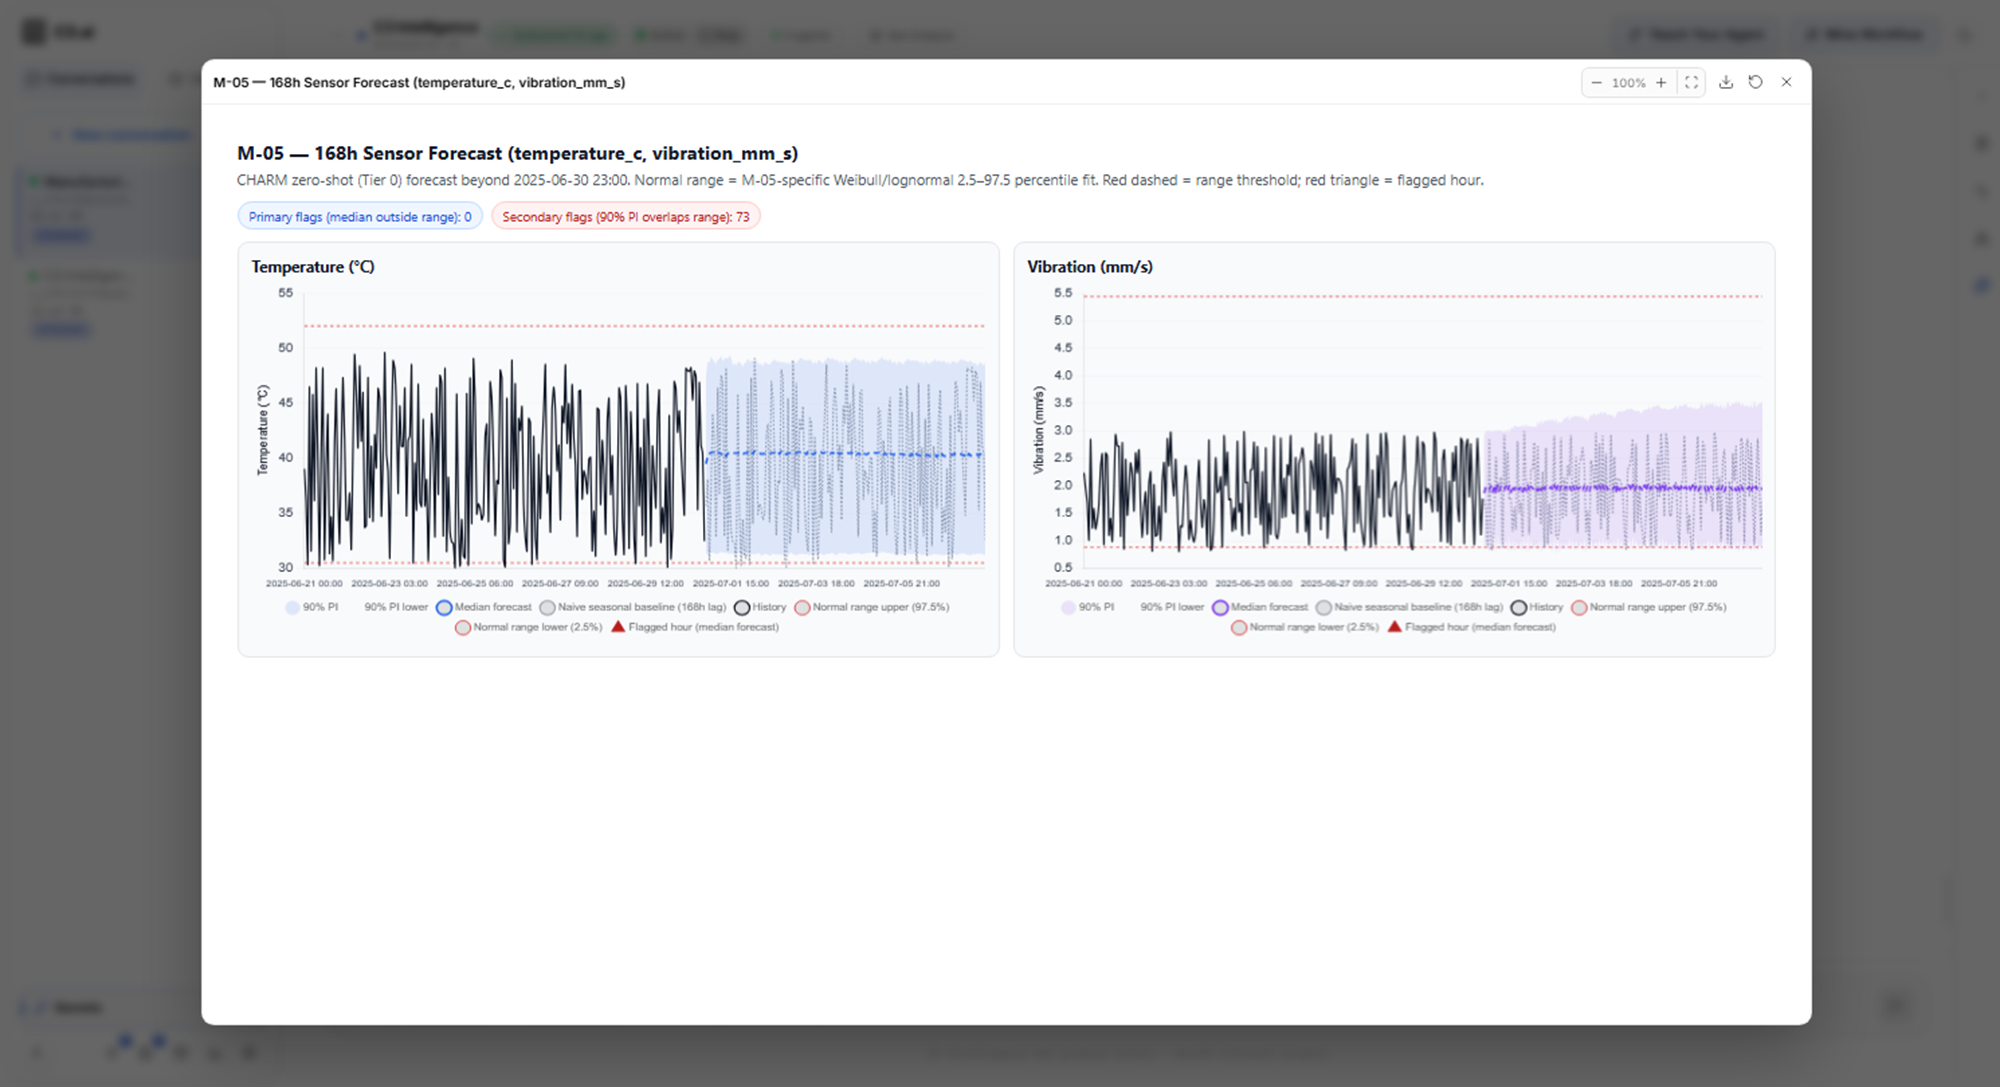
What to look for: a forecast chart for each reading with the normal range marked. Also look for a count of flagged hours with the reason for each flag.
Find the trained model and the report
Select See Outputs in the conversation header to open the Artifacts panel, which lists the dashboards from the conversation. The ML Agent keeps its model and report in the ml_agent folder of its workspace, the agent's storage area for this conversation:
ml_agent/final_artifacts/model/: the trained model, with code that loads it.ml_agent/final_artifacts/report/report.md: the full comparison, with its caveats.ml_agent/learnings.md: what worked and what did not, including negative results.ml_agent/task_spec.md: the plans you approved.
The results reply lists the first three paths. To open the files, select Files on the right edge of the conversation, then choose ML Agent in Select workspace agent.
To copy the model and report to the orchestrator's workspace, select the next-step option that downloads them. In the example, it read Download the final model + report to my local workspace, where "local workspace" means the orchestrator's workspace.
Get the most from the ML Agent
Four practices help the ML Agent build a model you can trust:
- Ask for the plan first: approve or adjust it before any training starts.
- Read the data facts: the ML Agent reports problems in the data, such as a leaking column. Each one changes how far you can trust the result.
- Ask for reliability in plain words: include it in the request, as the prediction request does.
- Ask why: a follow-up question about the top result shows whether the reason makes sense for your business.
Where to go next
With predictions in hand, pick the next step for your goal:
- To plan the maintenance these predictions call for, at the lowest cost, see Optimize Decisions.
- To find past sensor events like a new one, see Find Similarities with Time Series Data.
- To share the predictions in a report, see Generate Code.
- To profile or query the data behind the predictions, see Analyze Data.
- To choose another agent for your goal, see Use Data Science Agents.