Analyze Data
You have a set of data files and need to know what is in them before you build models, plans, or reports from them. The DI Engine is the data intelligence agent in C3 Intelligence. It reads your files, writes and runs the analysis code, and replies in plain language with tables and dashboards. Start here when you want to understand new data. The other agents can also build on what the DI Engine finds.
In the example, you work through a sample factory dataset in three requests:
- Describe seven files and how they relate, after you approve a short plan.
- Rank the machines by how much trouble they cause.
- Test whether emergency repairs cost significantly more than planned maintenance.
Along the way, you open each dashboard in full screen and compare the numbers in the chat with the numbers in the dashboard.
What the DI Engine can do
The DI Engine covers the path from raw files to answers about them. It reads CSV, JSON, Excel, and Parquet files. To use a capability, describe the task in plain words, and C3 Intelligence chooses the agent and the method:
| Capability | What you get |
|---|---|
| Describe files | For each file, its contents, row count, time period, and completeness, with a dashboard |
| Find relationships | The ID columns that link your files, and a diagram of how the files connect |
| Rank and summarize | Figures per item, such as per machine, sorted by the rule you state |
| Run statistical tests | A test of whether a difference is real or chance, with its size and a plain-language verdict |
| Build a database | Linked tables in one database, with a check that every ID points to a record that exists |
| Answer questions in plain language | After the database exists, answers to questions such as "Which machine had the most downtime in March?" |
Before you start
The DI Engine needs your data files, such as CSV, Excel, JSON, or Parquet files. You type requests in the message box, and the orchestrator, shown as C3 Intelligence, sends each one to the agent that handles it. Start in either of two ways:
- With the Smart Factory example: continue the conversation from Get Started with C3 Intelligence. The seven sample files are already loaded there, so you can compare your results with this page. To create the files, see Generate the Sample Data.
- With your own data: attach your files to your first request and describe what you want to know in your own words. Use the prompts on this page as patterns. For other ways to bring data in, see Bring Your Data to C3 Intelligence. To analyze records in one of your C3 applications, connect it as described in the C3 Application section of Connectors Reference.
Each run words its replies in its own way, and each step ends with what to look for, so you can check your own result. To learn how conversations, agents, and plans behave, see Conversation Features.
Describe your files and how they relate
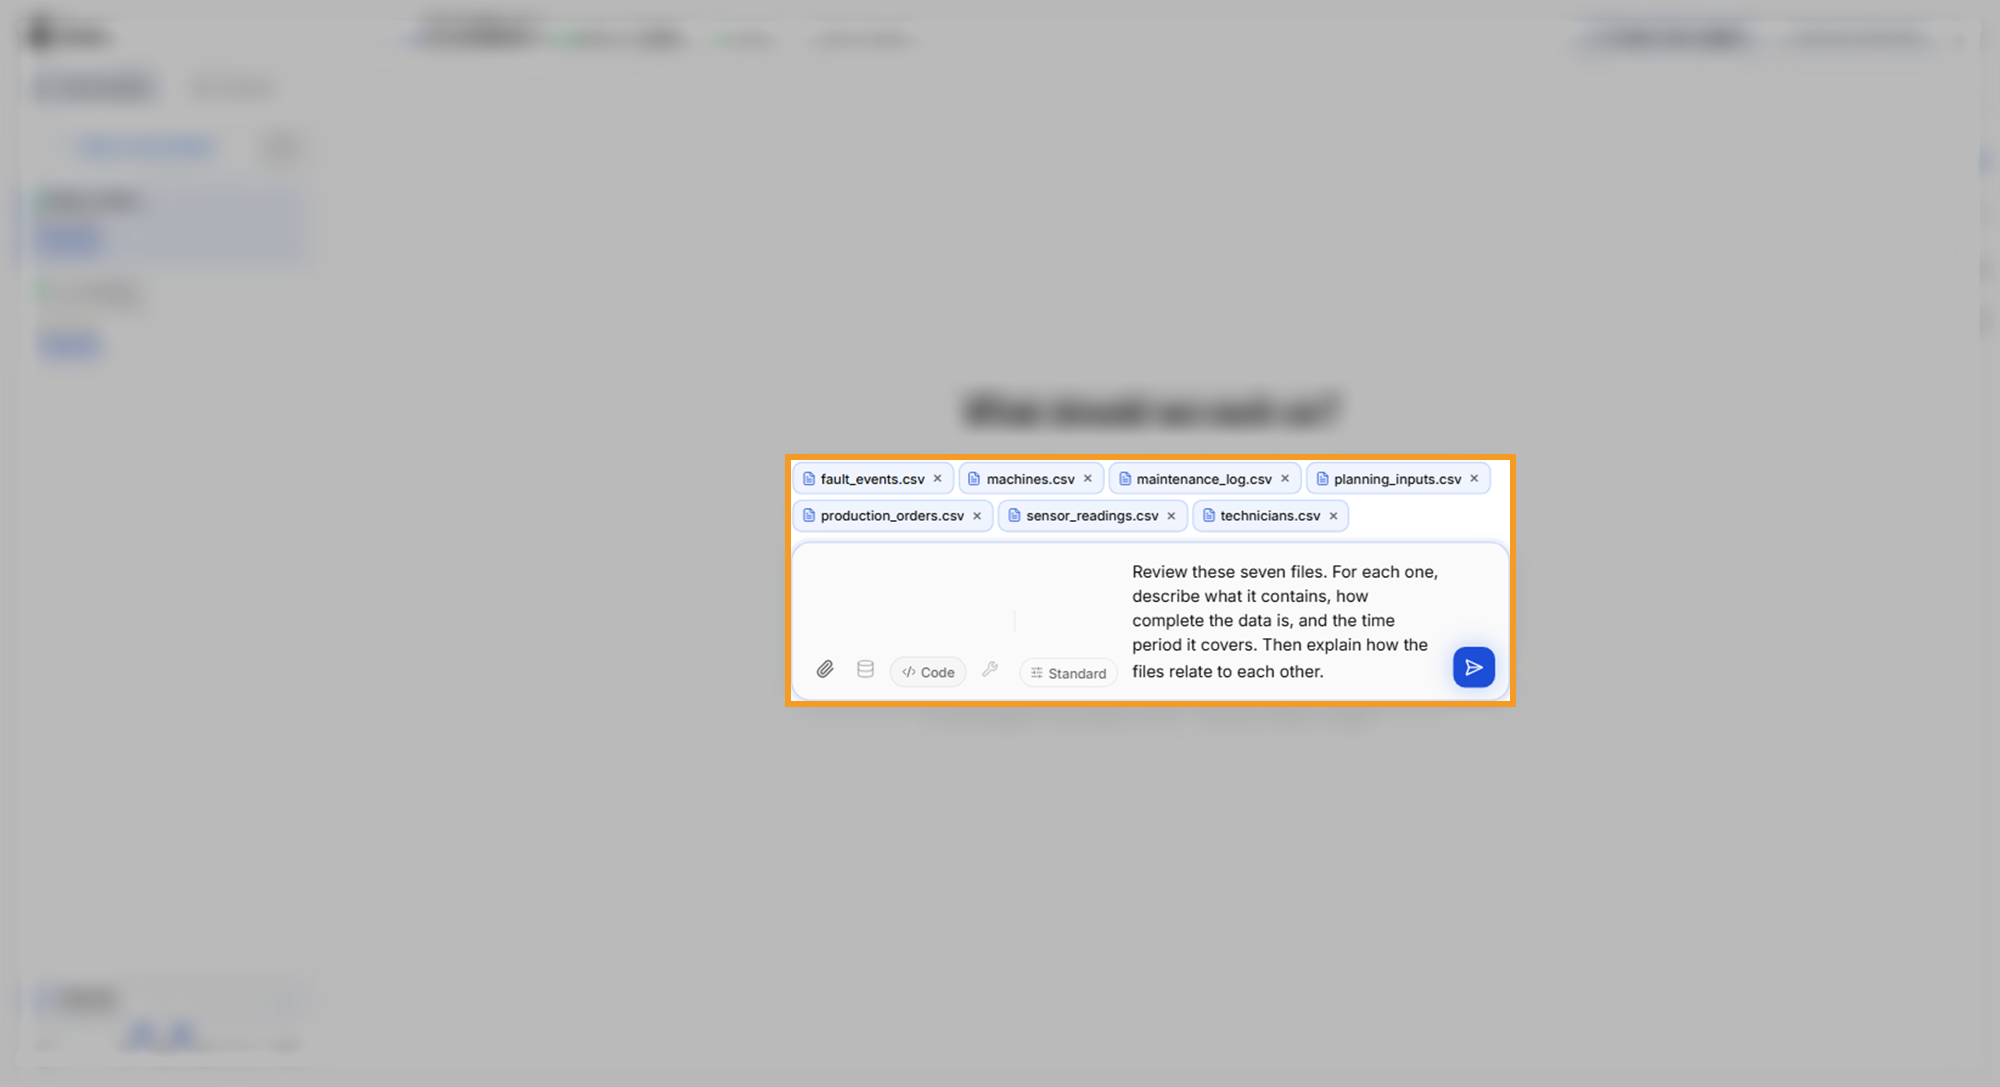
A first look at new data answers three questions: what each file holds, how complete it is, and which period it covers. If you generated the files in this conversation, send the request as it is, and the agents use the files in the smart-factory-data folder. If you downloaded the files, attach the seven files with the paperclip control in the message box first. Send this request:
Review these seven files. For each one, describe what it contains, how complete the data is, and the time period it covers. Then explain how the files relate to each other.The request states the outcome and the scope, all seven files, and it lists what to return for each file. It names no method, so the DI Engine chooses how to profile the data and you check the result.
Approve the plan
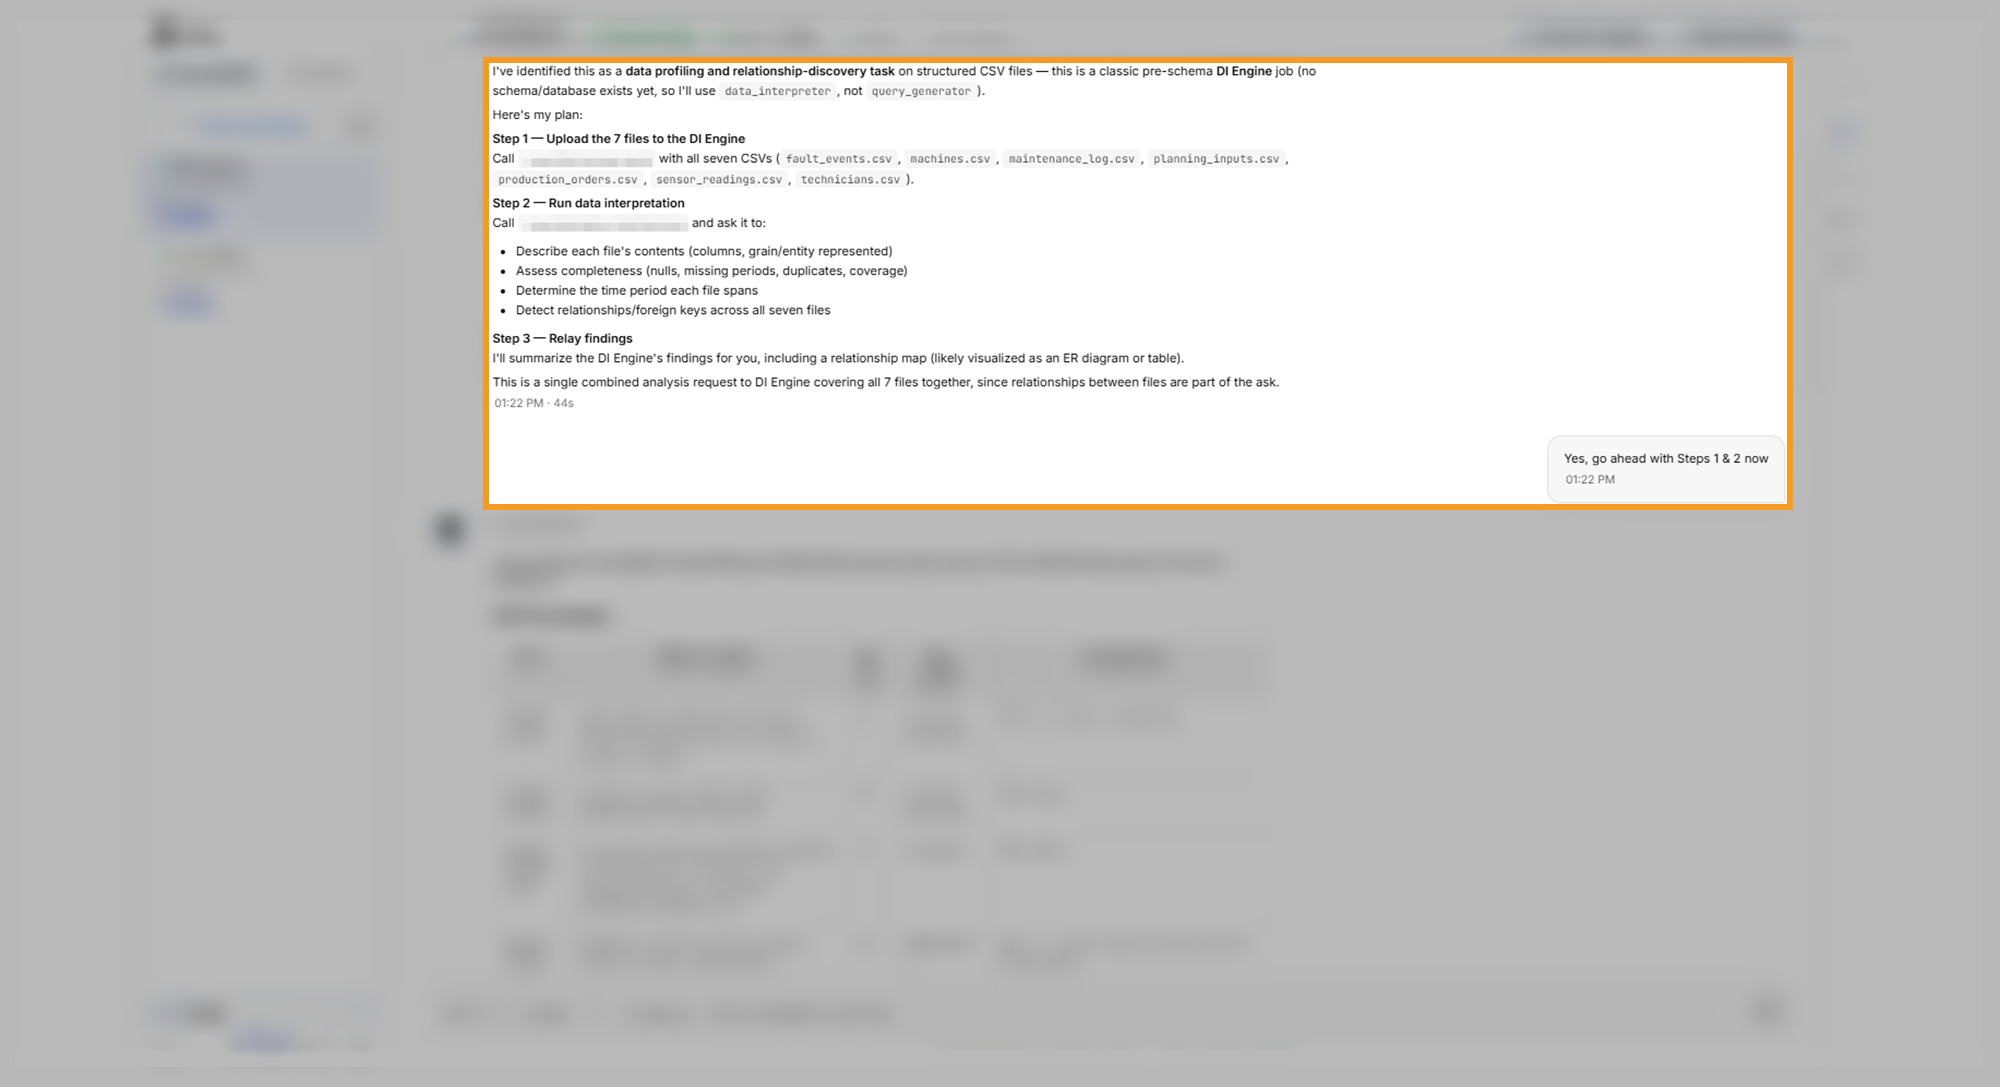
Before work that takes several minutes, the orchestrator can reply with a short plan to approve. In the example, the plan had three steps: upload the files to the DI Engine, run the analysis, and report the findings.
Approve the plan. In the example, the option read Yes, go ahead with Steps 1 & 2 now. The third step is the orchestrator's own summary of the results, so approving the first two steps runs the whole request. To change the plan instead, type your change.
Read the per-file summary
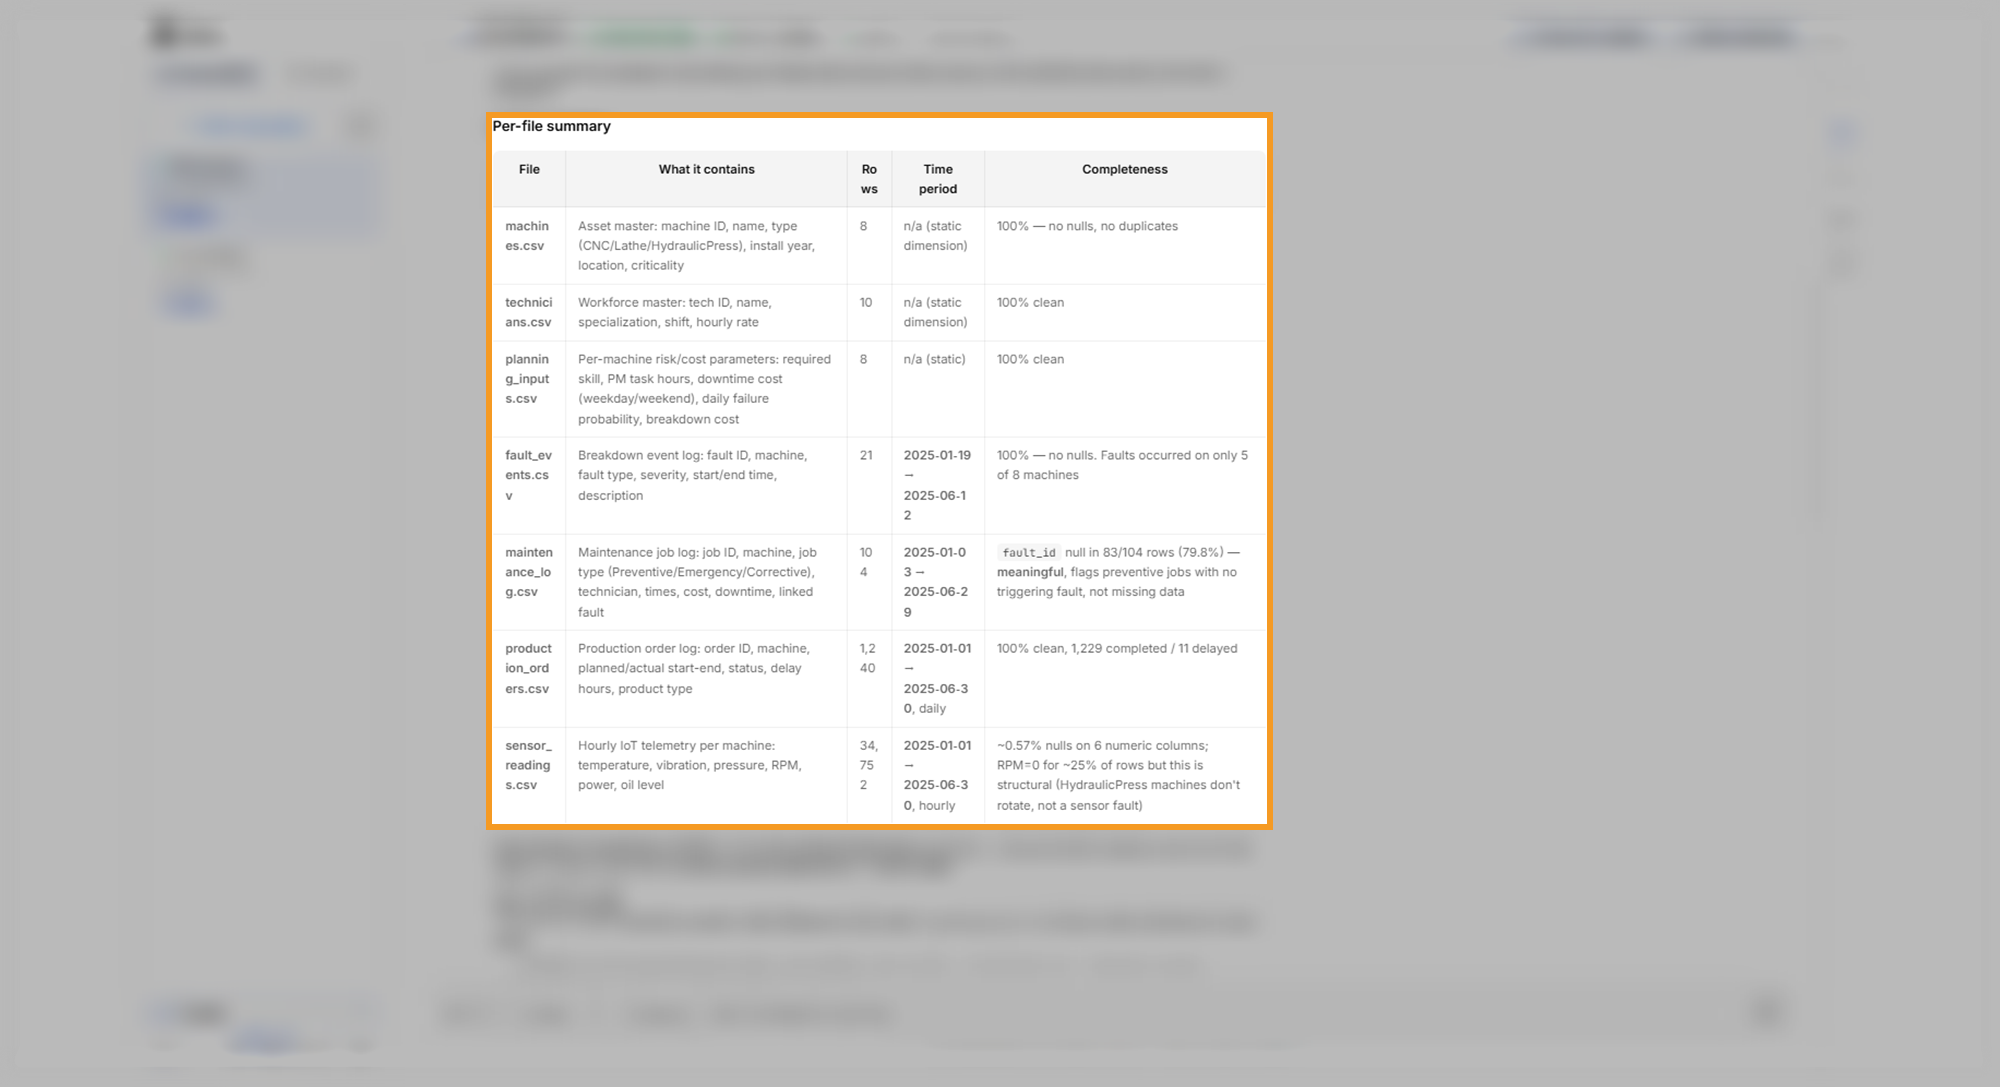
The DI Engine works for several minutes after approval. To follow the work as it happens, select Show logs on the reply. The reply opens with one table that gives each file's contents, row count, time period, and completeness.
Under the table, the reply explains how the files relate. In the example, machine_id links six of the seven files, fault_id links each fault to its repair job, and tech_id links each job to a technician. The reply also reports that no ID points to a missing record.
The DI Engine also ran statistical tests without being asked. In the example, it compared the temperatures of machines with and without faults. It also found that the sensor readings explain only about 11% of the variation in production delays, so most delays have other causes.
What to look for:
- Time period: January 1 to June 30, 2025, for the sensor readings and production orders, with the faults and maintenance jobs inside that window.
- The link between files:
machine_idties the machine list to the faults, jobs, orders, and sensor readings. - Completeness: a few empty sensor cells, under 1%, and an explanation of empty values that are normal, such as planned maintenance jobs with no fault ID.
Open a dashboard in full screen
Each analysis reply can include a card, an interactive dashboard inside the chat. In the example, the card is Manufacturing Data Analysis Dashboard. To read it at full size, point to the card and select Expand to full screen.
The dashboard has four tabs:
- Overview: totals for the dataset, row counts per file, and a diagram of how the files link.
- File Details: each file's row and column counts, marked Clean or Nulls present.
- Relationships: a check of every link between files, the faults matched to repair jobs, and charts of fault types and job types.
- Statistical Analysis: the tests the DI Engine ran, with the result of each and a short explanation.
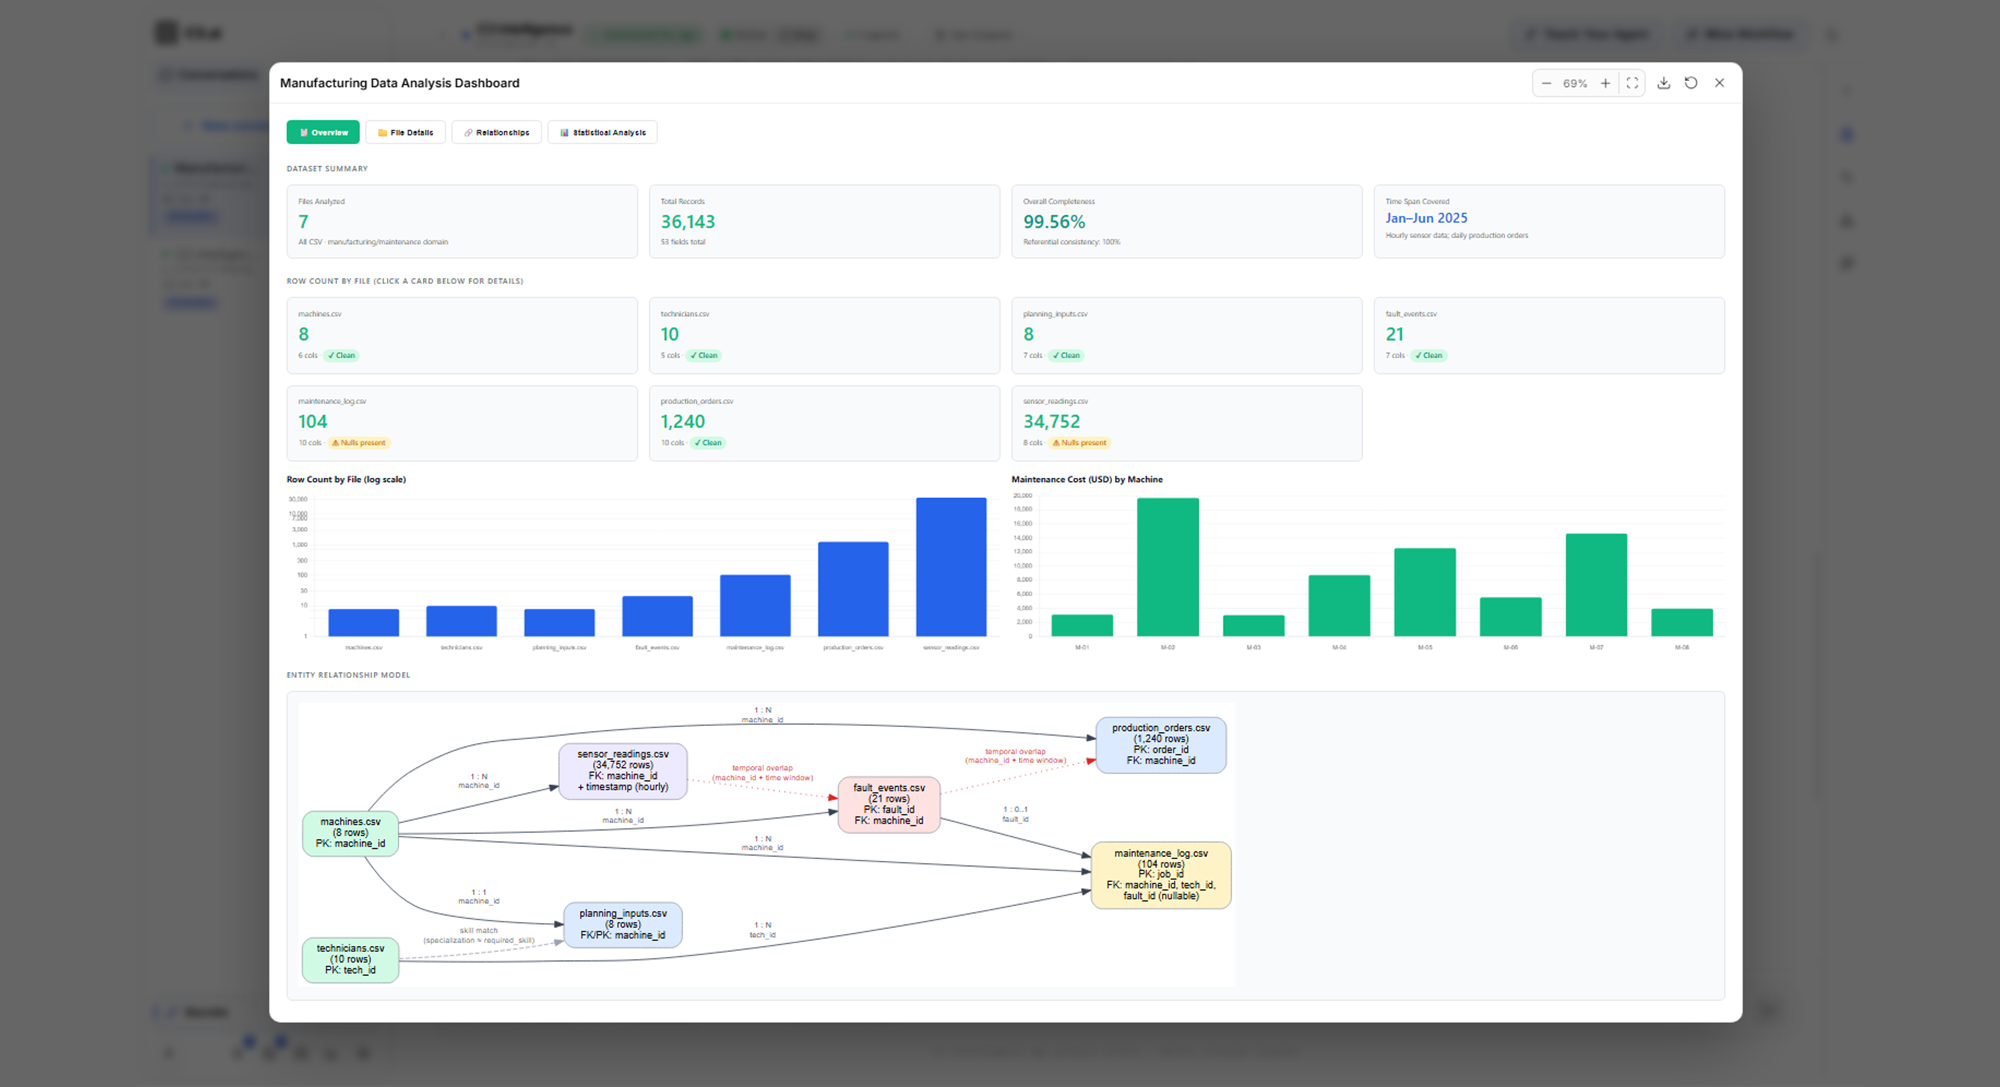
In full screen, Fit to page can shrink a tall dashboard until the text is hard to read; zoom in and scroll instead. Select Close (Esc) or press Esc to return to the chat.
Rank the machines by trouble
After you know what the files hold, ask a question that combines them. Send this request in the same conversation:
Rank the machines by how much trouble they cause. For each machine, show the number of breakdowns, total maintenance cost, total downtime, and number of delayed orders, starting with the worst.The request names the four figures to show and the sort order, so the reply comes back as one table you can scan. In the example, the reply arrived in a few minutes with no plan step, because the request was short and clear.
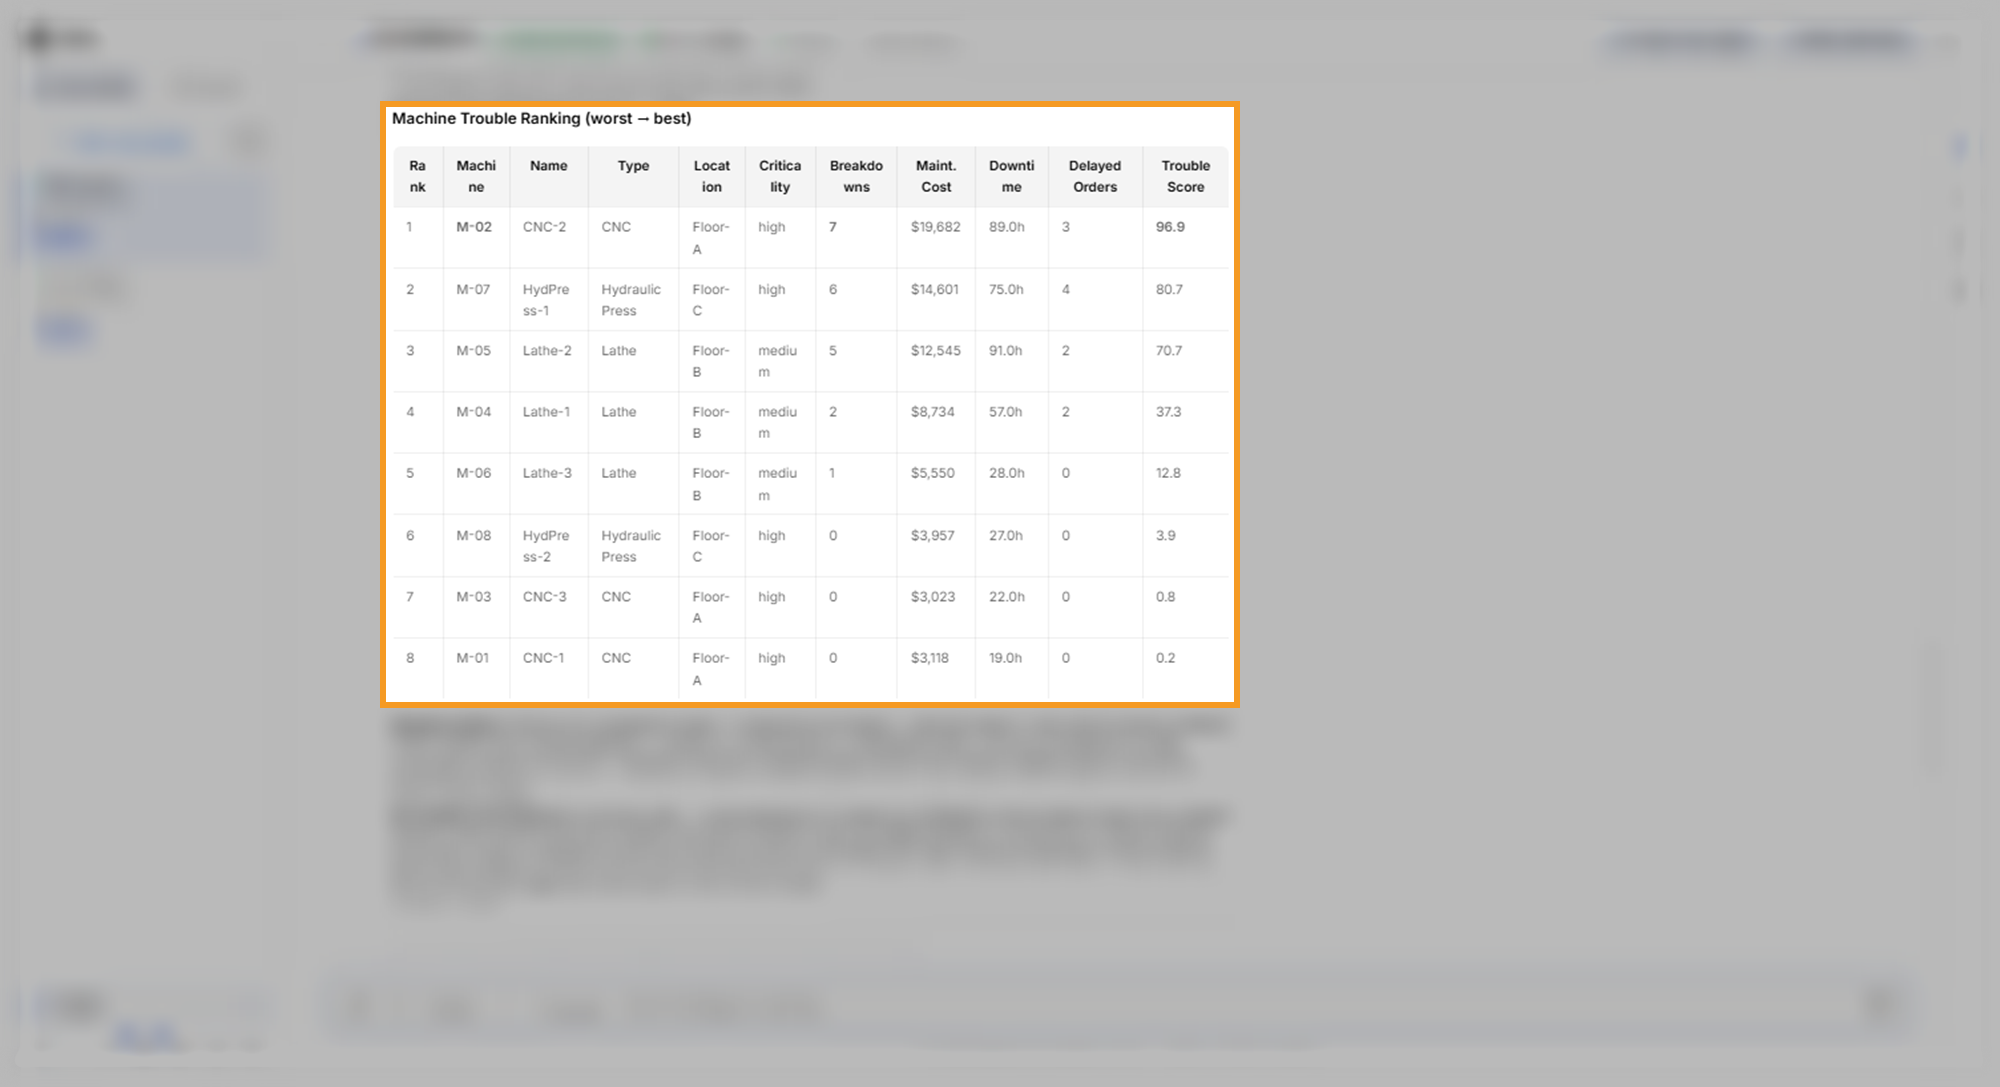
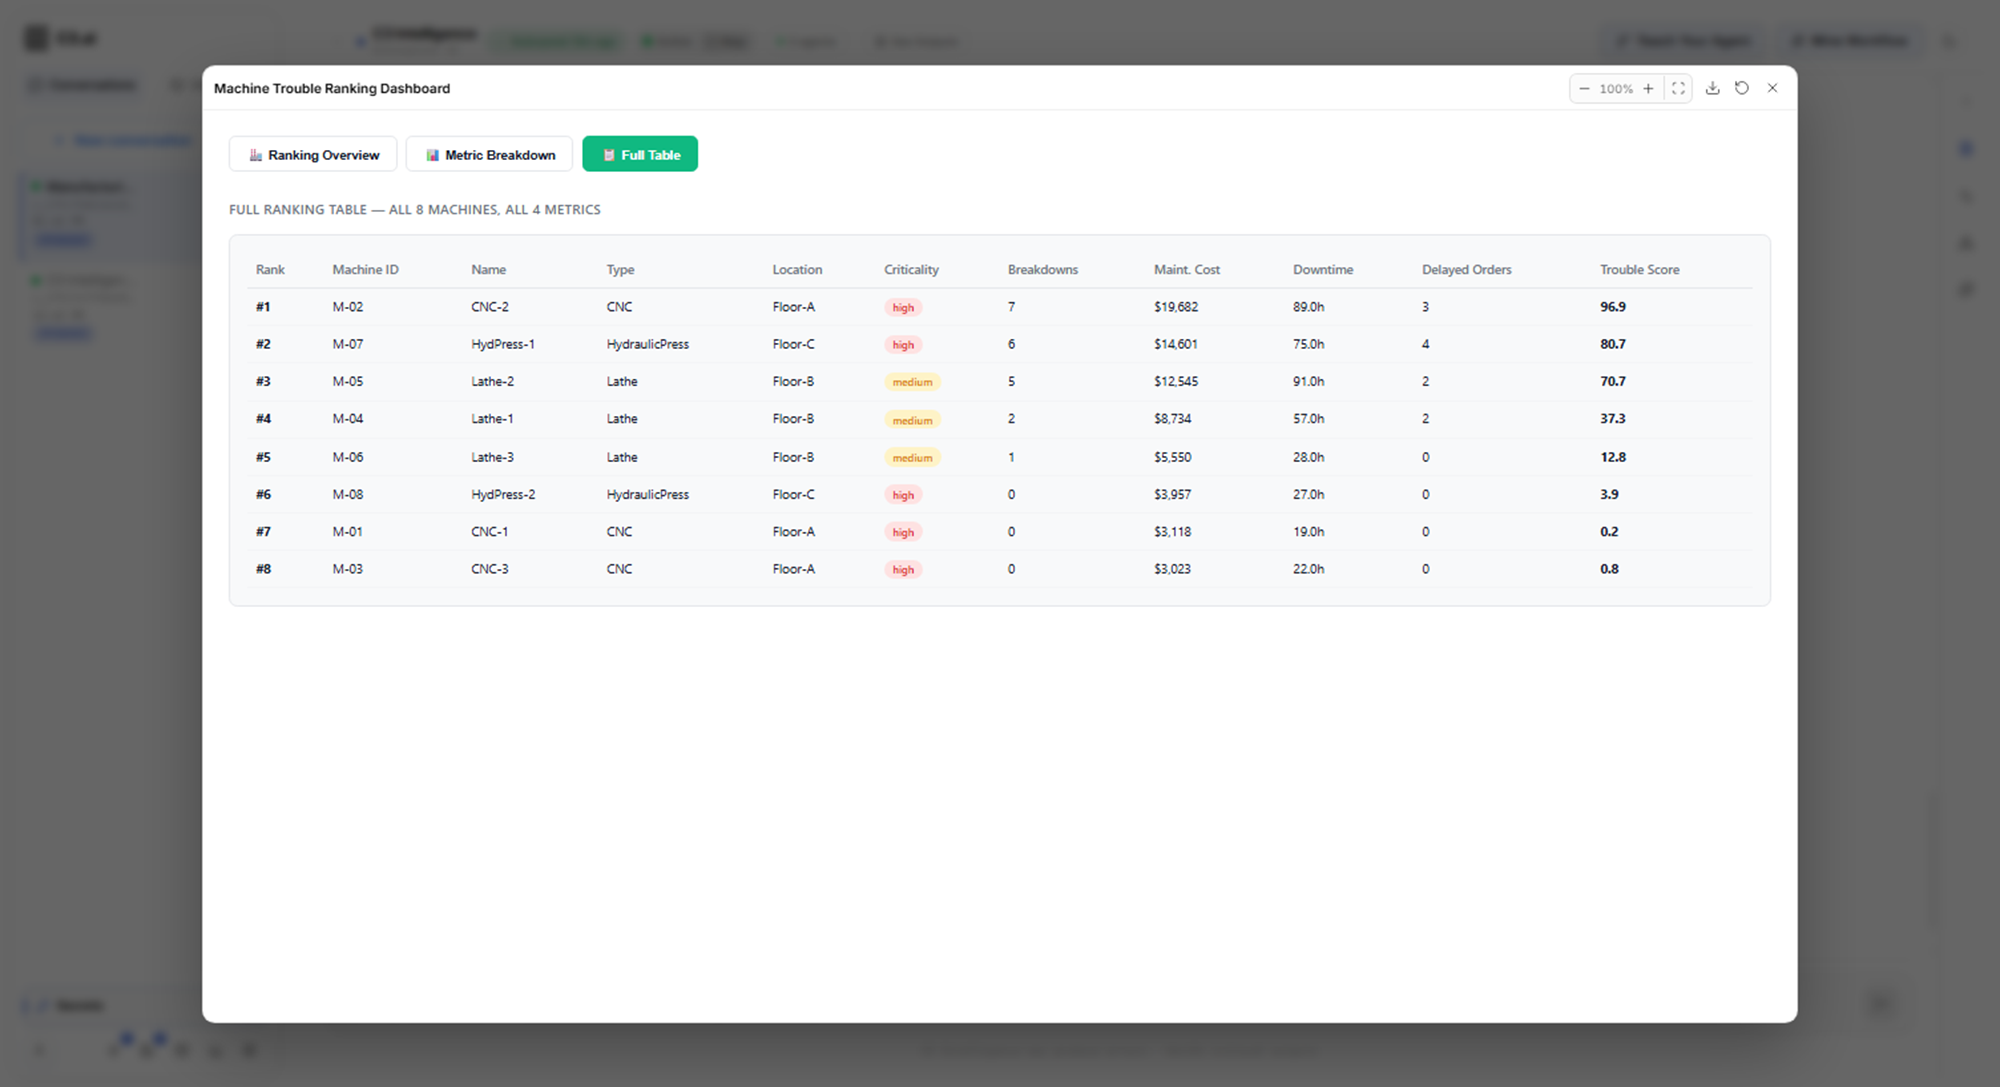
The reply states its ranking method: breakdowns first, then maintenance cost, then downtime. It also adds a trouble score from 0 to 100 that blends the four figures into one number for charting. The card Machine Trouble Ranking Dashboard has the tabs Ranking Overview, Metric Breakdown, and Full Table.
What to look for: M-02, M-07, and M-05 at the top. In the example, M-02 had 7 breakdowns and the highest cost, while M-01, M-03, and M-08 had no faults in the six months.
Check the chat against the dashboard
The chat reply and its dashboard are two summaries of the same analysis, so they let you check each other. Before you quote a result, compare the numbers in the chat with the numbers in the dashboard. Also check that the order and the wording agree with the numbers.
Two comparisons from the example show what to check:
- Order: the chat ranks M-03 seventh and M-01 eighth. Both machines had no breakdowns, so the rule ranks the higher cost as worse, and M-01 cost $3,118 against $3,023 for M-03. The Full Table tab lists M-01 seventh, which follows the rule.
- Wording: the chat says machines with faults run cooler, 44.3 °C against 47.5 °C. The Statistical Analysis tab shows the same two temperatures but describes them as running hotter. The numbers decide it: 44.3 °C is cooler.
When the two disagree, ask the DI Engine in the chat which one is correct, and name the figure.
Test whether a difference is real
A ranking shows differences; a statistical test tells you whether a difference is large enough to act on. Send this request:
Check whether emergency repairs cost significantly more than planned maintenance. Tell me whether the difference is large enough to be meaningful or could be due to chance.The request asks a yes-or-no question and asks for a judgment about chance, which is the checkpoint. The request leaves the choice of test to the DI Engine.
The reply gives the average cost of each job type, names the tests it used and why, and ends with a Verdict in plain language. The reply calls planned maintenance jobs preventive jobs. Three terms in the reply tell you how far to trust the result:
- p-value: the chance of seeing a difference this large if there were no real difference. A very small p-value means chance is an unlikely explanation.
- Effect size: how large the difference is compared with the usual spread of costs. A large effect means the two groups barely overlap.
- Confidence interval: a range that likely contains the true difference in cost.
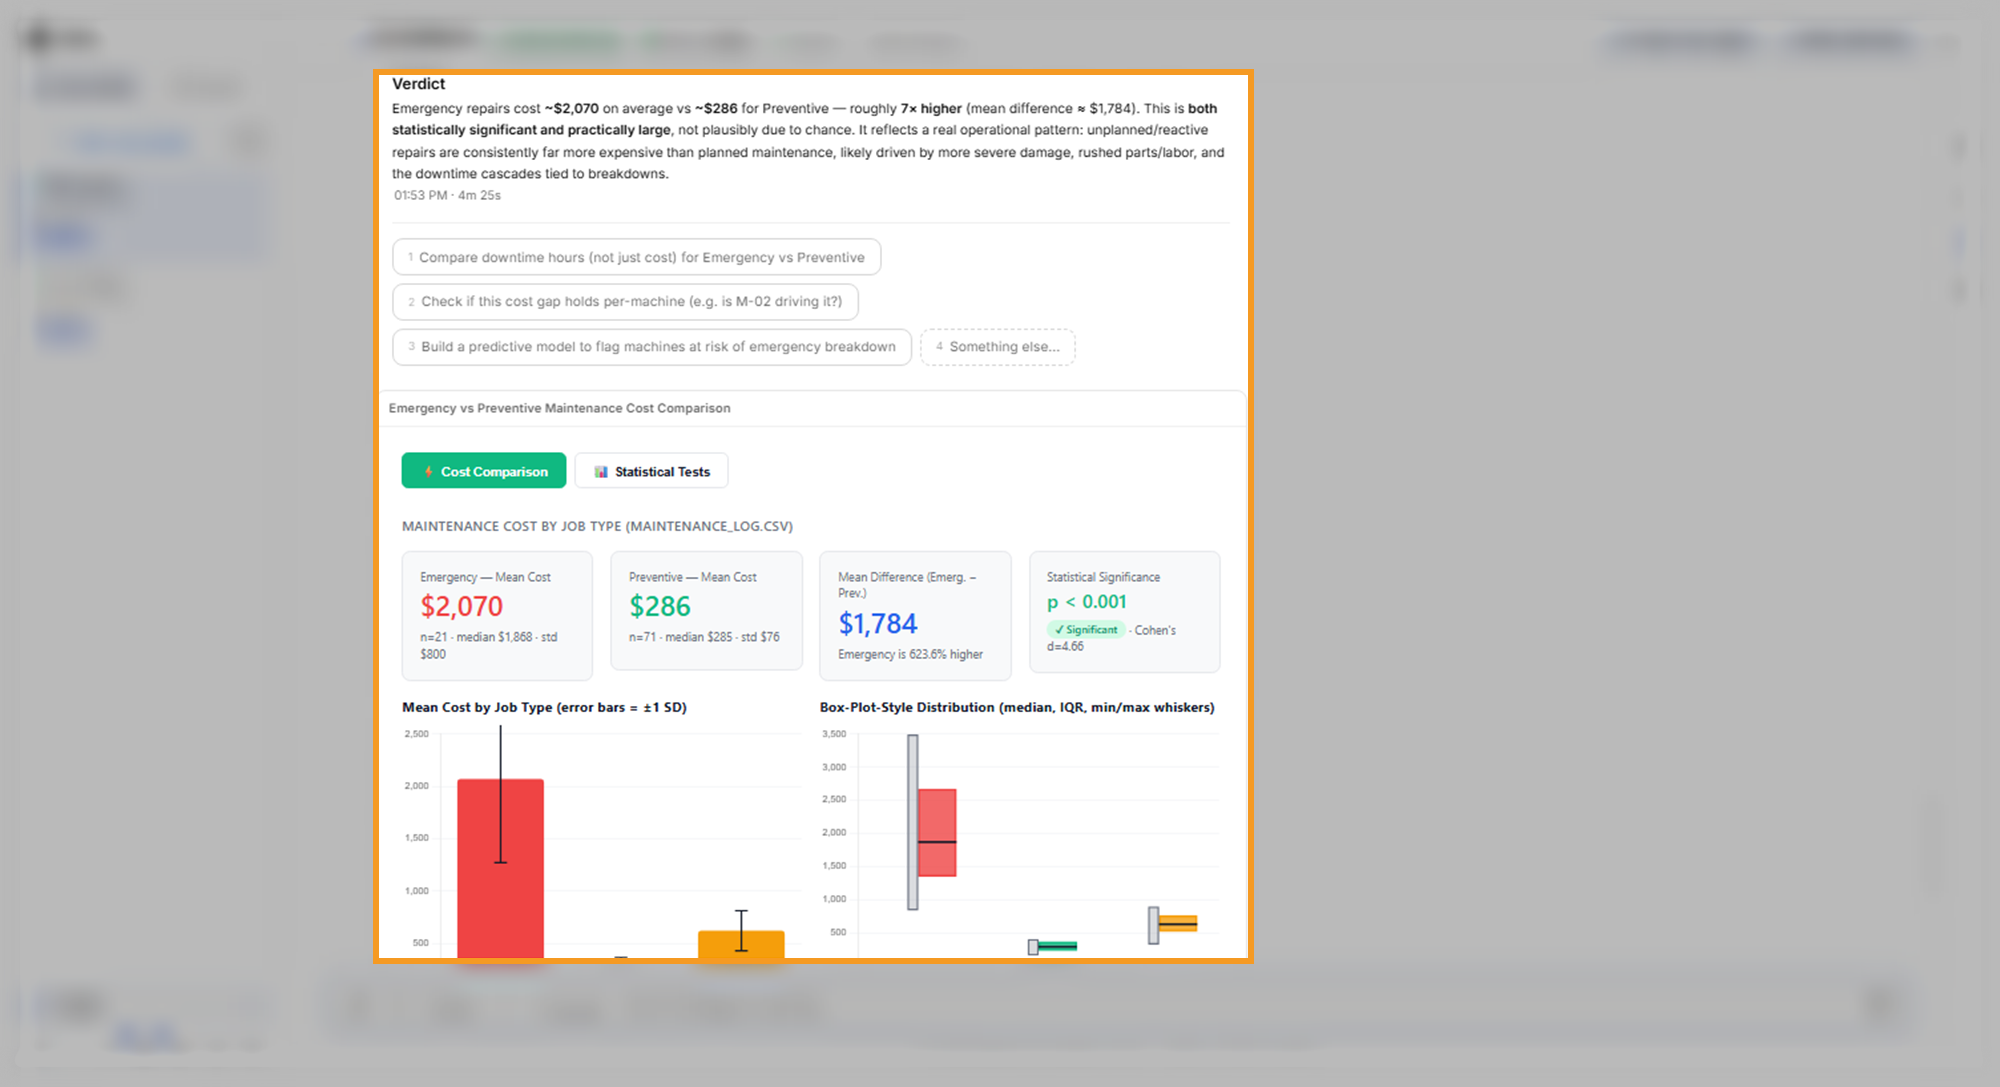
In the example, emergency repairs averaged about $2,070 against about $286 for preventive jobs, about seven times more. Every emergency job cost more than every preventive job. The reply noted that only 21 emergency jobs exist, a small group for a test. Two different tests agreed, which makes the result more trustworthy despite the small group. The card Emergency vs Preventive Maintenance Cost Comparison has the tabs Cost Comparison and Statistical Tests.
What to look for: a clear statement that emergency work costs more, with a stated level of confidence. This result is the business case for planning preventive maintenance, which Optimize Decisions walks through.
Get the most from the DI Engine
Four practices make the DI Engine's results faster to produce and easier to check:
- Give each request one goal: a request with one goal finishes sooner, and you can check its reply before you build on it.
- Name the figures and the order: list the figures you want and how to sort them, so the reply matches the table you need.
- Ask for a verdict: when you ask whether a difference matters, ask for a plain-language conclusion, as the cost request does.
- Read the stated method: each reply says how it ranked or tested the data, so you can check the result against the rule.
Where to go next
With your data profiled, pick the next step for your goal:
- To predict breakdowns or forecast readings from this data, see Build ML Models.
- To plan maintenance at the lowest cost, see Optimize Decisions.
- To answer questions from manuals and procedures, see Build a RAG Knowledge Base.
- To combine the results into one report, see Generate Code.
- To choose another agent for your goal, see Use Data Science Agents.