Use Configuration Tools
Configure is where you open the platform tools that run behind your pages, all against your own workspace. Use them to connect your data, build agents and machine learning models, run scheduled work, control who has access, and watch the application while it runs.
You can ask the agent for most of this work instead. Open a screen when a screen suits the task better than a sentence, and for the work only a person can do.
Bringing in live data needs the agent and you. You ask the agent for the pipeline, and the agent builds it. You open Data Fusion yourself to enter the sign-in details, because credentials always come from you.
Select Configure in the workspace header to open the catalog.
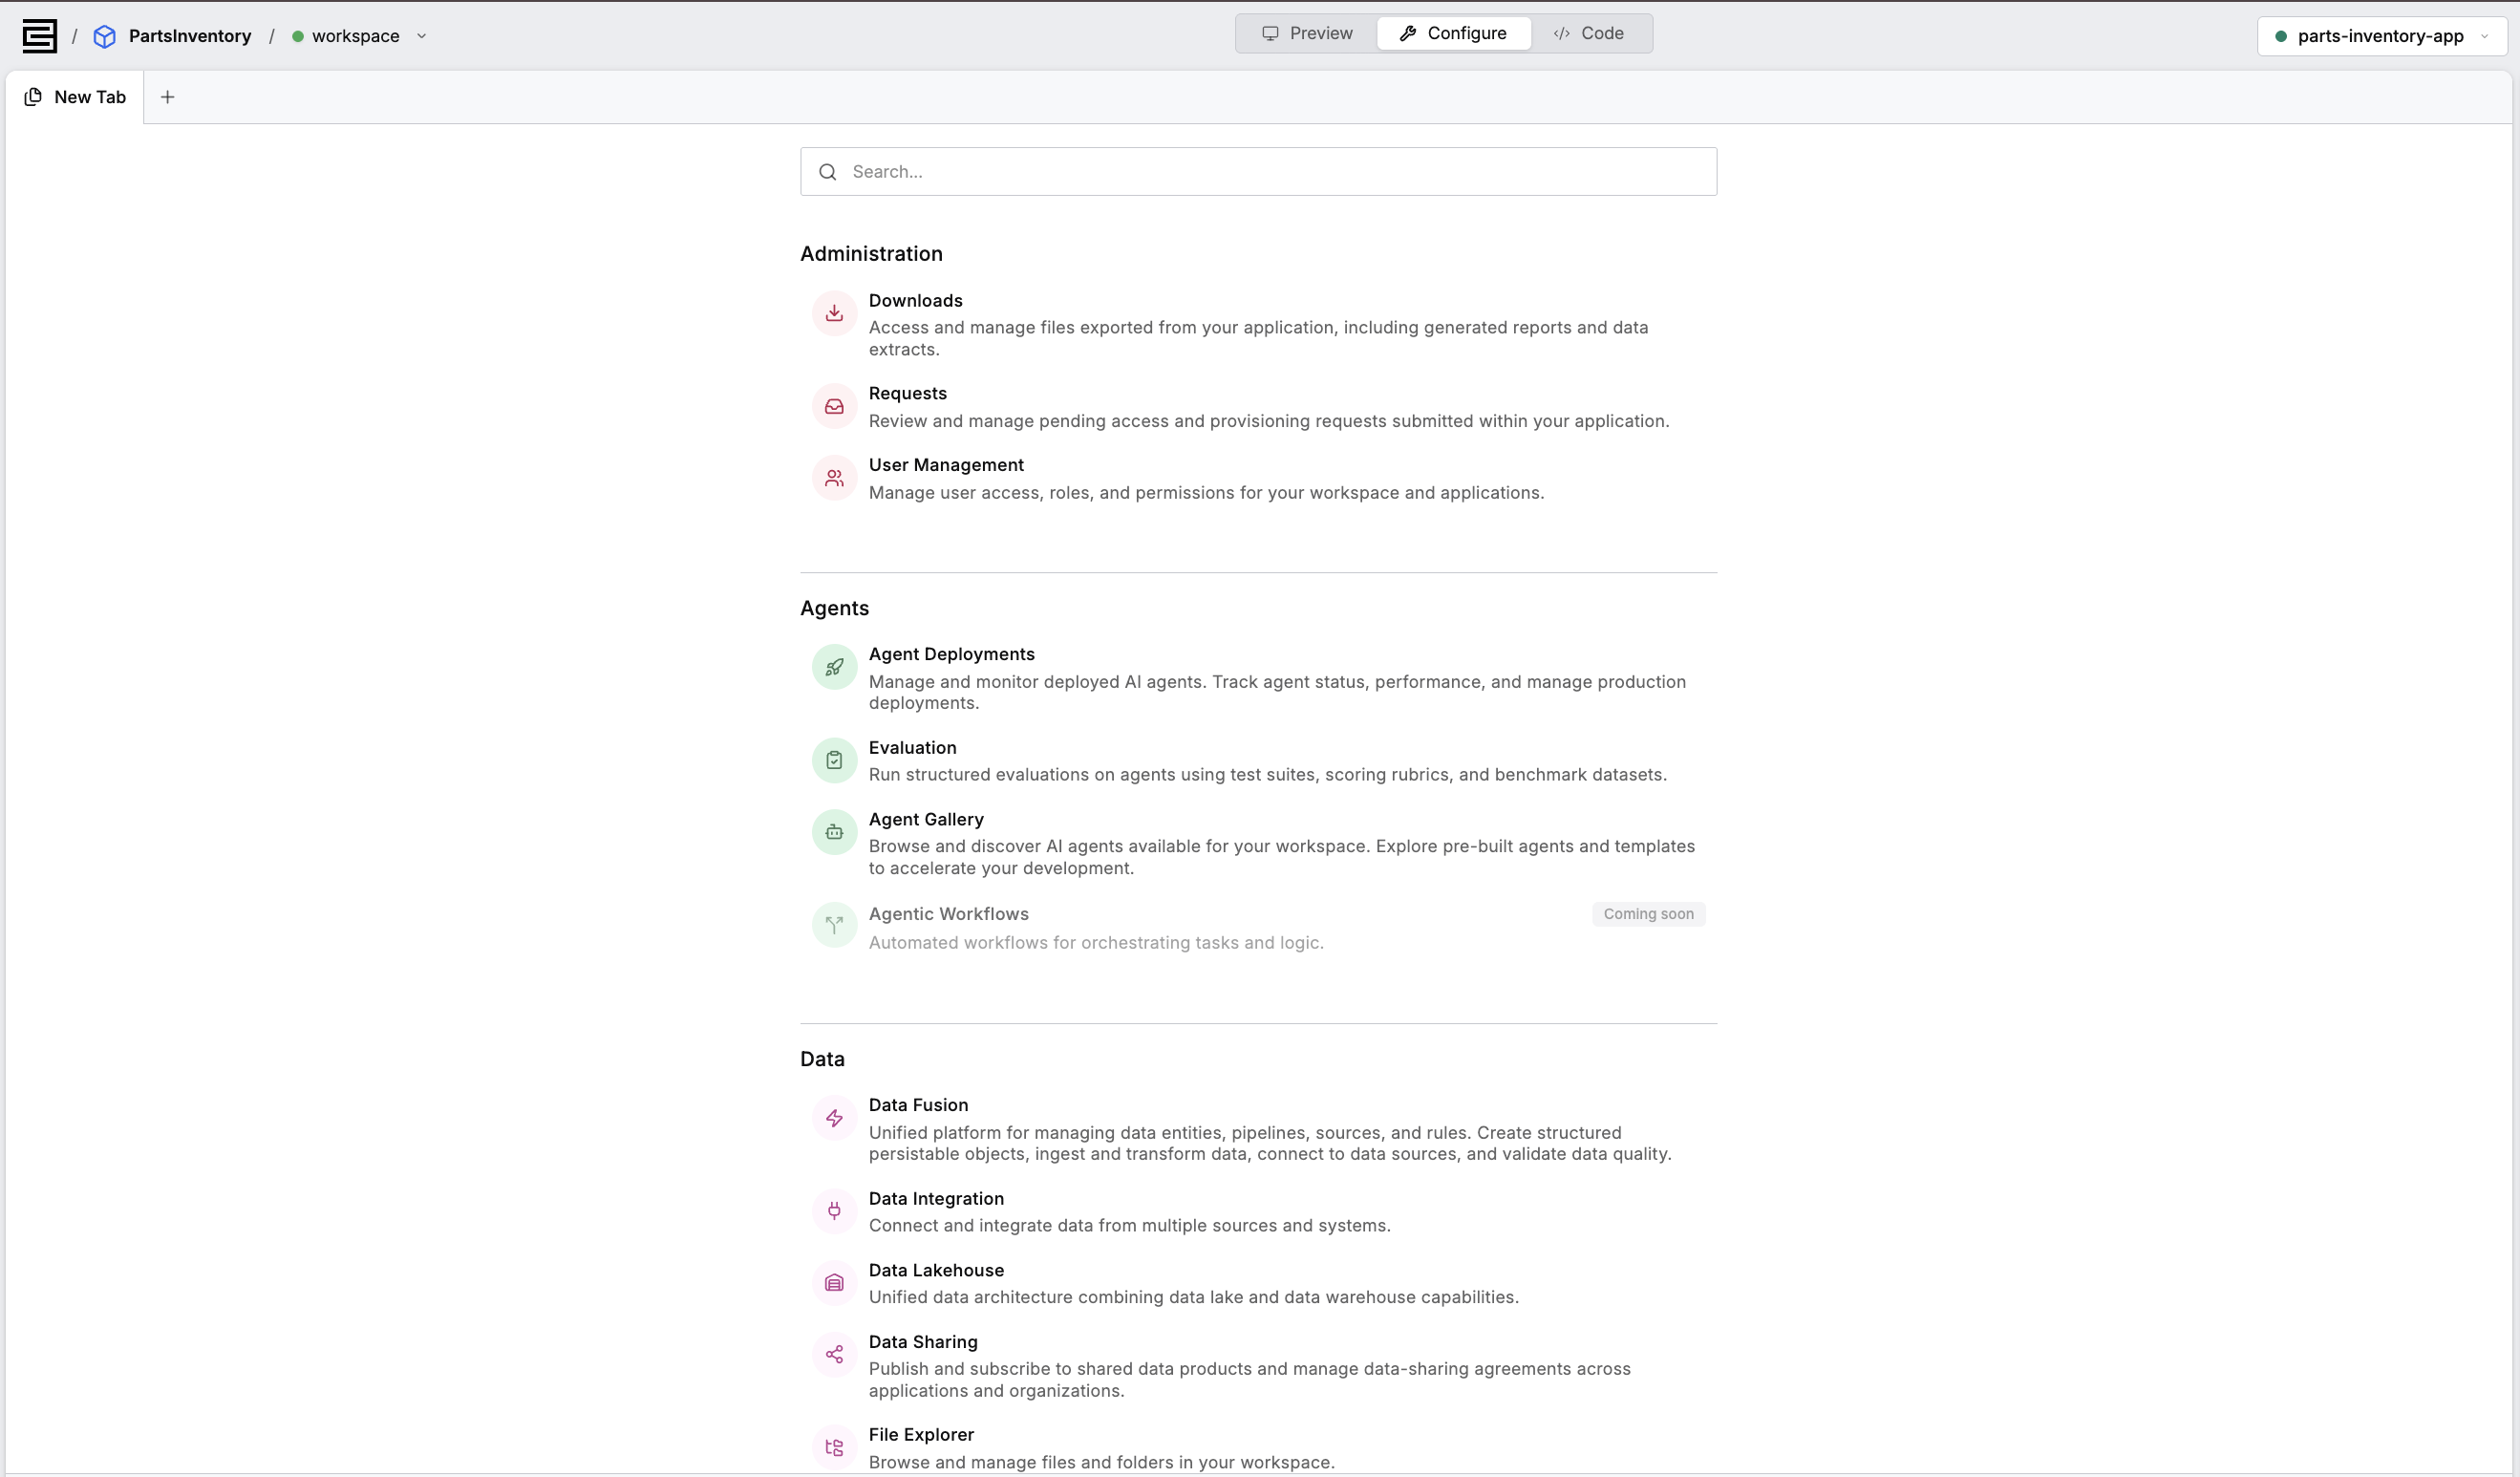
The catalog groups the tools into eight categories and includes a search field. Each tool opens in a tab of its own, so several tools stay open while you work.
Most applications use a few of these tools. The tools appear in catalog order, so you can find the ones your application needs.
Ask the agent, or open the tool yourself
The agent writes the same files and runs the same code these tools do. Ask the agent in the chat panel for a pipeline, a scheduled job, a role definition, or a machine learning model. The agent builds what you asked for, and reports what it verified.
The agent works within your own permissions. It reaches the data and the tools you can reach, and no more, so asking the agent for something never returns records your account cannot open.
You handle three kinds of work yourself:
- Credentials: entering and testing the sign-in details for an outside system, an authentication provider, or an access token. Credentials always come from you.
- Decisions about real people: approving a request, or giving a named colleague access. The agent writes what a role is allowed to do, and you decide who holds that role.
- Watching a running application: live dashboards, log tails, and service restarts. Point the agent at a failure and it reads the logs and diagnoses the failure. You watch the live view from these screens.
A few tools are places you work by hand, such as Jupyter and Visual Notebooks. The agent runs the same code through the chat panel, so choose whichever route suits the task.
Administration
Three tools govern who uses the finished application, and what data leaves that application. C3 Code collaborators are separate, and cover who builds the application.
Ask the agent to define what a role is allowed to do, to gate pages behind a role, or to build an export that writes a file. These screens are where you assign a named person to a role, and approve a real request.
- Downloads: lists the files exported from your application, such as generated reports and data extracts, and is where you retrieve those files. See Data Lakehouse Downloads.
- Requests: reviews the access and provisioning requests people submit inside your application. An administrator approves or denies each request. See Studio Admin App Requests.
- User Management: assigns application access to individual users or to user groups. Assigning by group is what keeps permissions consistent as people join and leave. See App User Management.
To design the roles themselves, rather than assign them, the platform documentation covers roles, permissions, and access control on individual records. See Roles, Permissions, Role-based Access Control for Application Developers, and Add Access Controls to a Role Using Data Permissions.
For adding people and sharing a preview link, see Share with Collaborators.
Agents
The Agents group covers an agent inside your application, from a starting point through deployment to measurement. An agent is a part of your application that takes a request in plain language, works over your data, and calls the tools you give that agent.
Ask in the chat panel and C3 Code builds an agent for you, setting up the tools and the standing instructions, then testing the agent once. C3 Code also writes evaluation suites with a scoring rubric, and reports the scores. These screens are where you promote an agent to a monitored deployment and watch the agent run.
- Agent Deployments: develops, tests, deploys, and monitors agents. One screen covers the whole lifecycle. See Agentic Lifecycle Management.
- Evaluation: measures agent quality offline using versioned datasets, experiments, runs, and metrics. Agents are sensitive to change, so a new prompt or a swapped model shifts results in both directions. Evaluation measures that shift before the change reaches production. See Agent Evaluation Overview.
- Agent Gallery: catalogs every agent created in your application, deployed or not, and is where you resume work on one. See Agent Gallery.
To go further into how agents are built, the platform documentation covers creating an agent, the skills an agent follows, and the tools an agent calls. See Creating Agents from Scratch, Creating Agents from a Template, Agents Overview, Skills Overview, Tools Overview, and Observability Overview.
Data
The agent builds your data model and loads the files you attach. C3 AI calls each kind of record a Type. These six tools cover everything around your records: connecting to outside systems, running repeatable pipelines, and storing data outside the application database.
Your records have to exist before most of these tools help, because a pipeline needs a destination for the data and a query needs records to query. Build the data model first, then connect the source.
- Data Fusion: brings structured and unstructured data from your source systems into your application. You build a pipeline as a flow of nodes on a canvas, combining source systems, transformations, and targets. See Understand the Data Fusion Pipelines.
- Data Integration: pulls data from sources such as databases and APIs into one application-specific model, through a visual interface. Use this tool when your records must stay current against a system of record. See The Data Integration Interface.
- Data Lakehouse: stores large volumes of tabular data at low cost. Four tabs cover tables, catalogs, a SQL editor, and editor history. See Data Lakehouse in C3 AI Studio and Data Lakehouse Quickstart.
- Data Sharing: publishes data domains that other applications in the same cluster subscribe to. Once subscribed, requests for shared Types route to the provider application at run time. See Cross Application Data Sharing in Studio.
- File Explorer: browses mounts and folder hierarchies, and uploads, copies, moves, deletes, and downloads individual files. See File Explorer in C3 AI Studio.
- Visual Notebooks: applies data science without writing code, through a visual interface aimed at analysts and subject matter experts. See Visual Notebooks Product Overview.
Bring your data in and check it landed
Data Fusion is where most applications get their real data. These five steps take you from connecting a system to seeing your application run on that data in Preview:
- Open Data Fusion in Configure, and add the system that holds your records. Enter the sign-in details and test the connection. This step is yours, because credentials come from you.
- Ask the agent to bring the data in. The agent writes the source definitions, the transformations that map source fields onto your records, and the validation rules, then runs the load.
- Open the Data Integration tab in Data Fusion to see the finished pipeline: the source system, the collection of files or tables, and one transformation per kind of record.
- Open the Object Model tab to confirm your records now carry your own field names.
- Return to Preview. The pages read from your rows, so the figures should match your source.
The platform documentation covers each step of a pipeline in depth: the source system, the source schema, transformations, field mapping, change data capture, running the pipeline, validation rules, and rebuilding application dependencies afterward. For documents rather than tables, see Understanding Unstructured Data Integration Pipelines. For a specific system, see the Connector Reference Table.
Development Tools
Three entries open a full tool in a new browser tab, rather than in an embedded tab.
The agent already runs queries and code against your live application, which is how it verifies its own work. Open the Console or a notebook when you want to run a query or a script yourself.
- C3 AI Studio: the graphical workspace for building, testing, and deploying applications on the platform. See Introduction to C3 AI Studio.
- C3 Console: a JavaScript shell against your workspace. The Console queries, filters, and updates application data, and tests expressions directly. See Access Your Environment.
- Jupyter: opens a managed JupyterLab notebook against your application's data. This is where you write machine learning models, and where you set up optimization problems such as a production schedule or a supply plan. Both run against your real records. See Configure and Use C3 AI-Managed JupyterLab Notebooks.
The Console reads and writes your application's data directly. Query a record type in the Console to see what the application stored, which tells you whether a blank page is a data problem or a query problem.
Machine Learning
Two tools manage machine learning assets. One holds the inputs, and the other governs the models that consume those inputs.
Ask the agent for a feature, a full training pipeline, or a weekly retraining schedule. These screens are where you review model health and promote a model by hand.
- Feature Store: holds features and feature sets, and shows the models that consume each. A feature is a processed data point capturing an attribute of a record, and defining a feature once means training and prediction read the same computation. See C3 AI Studio Feature Store.
- Model Ops: reviews models and model routes, and changes the status of deployed models. A route decides which model serves which records. Model Ops also publishes models for other applications, and loads published models into yours. See C3 AI Studio Model Ops.
To go further, the platform documentation covers the metrics behind a feature, the pipelines that train a model, and the registry that governs versions. See Metrics, Machine Learning Pipes, Model Development Workflow, and Model Registry.
MCP
Five tabs publish your application as a Model Context Protocol (MCP) server, so AI coding assistants in an editor can call what your application does. MCP servers you register on the Settings page give your workspace agent tools from elsewhere. These tabs work in the opposite direction, publishing your application's tools to those assistants.
Ask the agent to implement the tools your server exposes, and to write prompt templates into the repository. Generating an access token and registering a server both happen in these tabs, and take a workspace restart.
- MCP Access: the starting point. Generate an API token and install the server connection before any other tab is usable. Administrators also manage user access here. See MCP Access.
- MCP Monitor: records every tool and prompt invocation the server receives, with arguments, results, and errors. Entries appear once an editor has connected. See MCP Monitor.
- MCP Prompts: publishes prompt templates that assistants invoke with a slash command, including arguments filled in at call time. Published prompts persist across restarts and deployments. See Manage MCP Prompts.
- MCP Servers: runs more than one named server in a single application, each with an address and a catalog of its own. One group of users can see a curated set of tools without affecting another group. See Multiple App MCP Servers.
- MCP Tools: registers the tools the server exposes, and controls which tools are available. A global toggle disables the whole server regardless of individual tool settings, and only an application administrator can change that toggle. See Manage MCP Tools.
For the wider picture, see App MCP Overview and Connect MCPs.
Model Hub
Two tools control how outside systems reach your workspace, and which models your application uses. Both screens hold credentials and real client identities, so both remain your responsibility.
- Authentication: configures authentication providers, token policies, and session management for workspace access. See Authenticate Users.
- Model Clients: lists the client applications connected to the workspace and reports API usage. This is also where the model provider credential is stored, which every generative AI feature depends on. See Set Up LLMs and Embedders Via UI and Default LLMs and Embedders.
Monitoring
Eleven tools report on your application while the application runs. Use these tools when an application renders correctly in Preview and then fails under real data volume or real usage. The job screens belong to this group because a job runs on a schedule, so you watch a job rather than calling one.
Ask the agent to write and schedule any of these jobs, and to define alert rules. Point the agent at a failure and it reads the run history and the logs to diagnose that failure. These screens are where you watch work that is already running.
- Action Profiler: drills into an executed action and its sub-actions to any depth, showing how each performs over time. Use the profiler to locate a bottleneck rather than guessing at one. See Analyze Code Using the Action Profiler.
- Alert Center: creates alert rules from templates for application and environment health, and collects triggered alerts across applications. See Configure Alerts to Monitor System Health.
- App Monitoring: reports resource usage for the environment and the application while both run. See Monitor Environments and Applications.
- Batch Jobs: gives a historical view of batch runs. A batch job splits one long operation into parallel processes, so this is where you confirm all of those processes finished. See The Batch Jobs Interface.
- Cron Jobs: creates and manages recurring scheduled tasks, and reports run history and failures. See The Cron Jobs Dashboard.
- Logs: records environment and application activity for monitoring status and troubleshooting errors. See C3 AI Studio Logs.
- MapReduce Jobs: reports active and recent distributed jobs. The platform handles distribution, redundancy, and fault tolerance, and these jobs usually originate from Data Integration. See The MapReduce Jobs Interface.
- Services: shows the cloud and compute services each environment uses, and scales those resources. See Service Catalog.
- Spark Executions Jobs: reports every Spark query that ran on a cluster, with filters by status, user, and origin, and a detail view for each run. See Monitor and Maintain the Data Lakehouse.
- Workflow Jobs: monitors workflows, which are long-running operations built from discrete steps, and reports each step's outcome. See The Workflows Interface.
- Workload Management: monitors and manages the queues the platform uses to parallelize work and run background logic. See Workload Management.
When a data load does not finish
A load that stalls or fails appears on these screens, and the platform documentation explains what each symptom means.
Start with Confirm Data Fusion Pipeline Run Completion to see whether the run finished, then Monitor Data Loads using C3 AI Studio for the load itself. Common Data Ingestion Issues covers the most common failures. When work is queued rather than failing, see Monitor and Manage Queues and Invalidation Queues and Asynchronous Processing. For a job that finishes but takes too long, see Configure and Tune Batch Jobs. To stop a runaway action, see Stop Actions using Action Id.
Where to go next
These pages cover building, deploying, and connecting these tools to your application: